 E-Mail this Post
and get first instructions and information about the brand new and worldwide exclusive GUNNER24 Forecasting Trading Technique.
For December 26, 2018 was a big intraday reversal day where stocks rallied close to +5% accompanied by NYSE Up Volume of more than 10 times the amount of Down Volume, distinguishing it as a “10-1 Up Volume Day”. These are pretty rare trading day conditions. Generally speaking, a 10-1 Up Volume Day which appears in the middle of an up move can mark a bullish exhaustion for that uptrend. But a 10-1 Up Day which was triggered right after a brutal downtrend resp. after a recognizable panic cycle usually signals strong upward initiation, and a reversal of that decline.
And because, in addition, the e-mini S&P 500 continuous future contract (ES #) has also almost exactly reached its anticipated panic cycle downwards target range (2311 to 2300 pts) within expected turnaround time, this very important forecast now comes into force:
"IF market bottoms out at 2300 surroundings supported by PANIC VOLUME until the end of the very first trading week of 2019, followed by visible bounce which then is able to overcome 2500 pts on weekly closing base there is a 65% chance that entire downtrend has ended and the next strong multi-month bull market upwave has begun, which then should be able to print some higher alltime-highs in course of 2019 and 2020..."
Source: GUNNER24 Forecasts, 12/22/2018: "Fed finally breaks the equity market"
==> GUNNER24 Trading Method now anticipates that the achieved December 26, 2018 lows mark the end of the last bear market and will be the start of the next longlasting new bull market. Of course we need some more technical proof or time to be as sure as possible that such 1 to 2 years lasting new bull is now underway.
==> Why the US stock markets are supposed to be running smoothly upwards for a total of 5 to 8 week candles, and how high the journey should/could be, follows below again with the help of the ES #:
Within GUNNER24 Forecasts, 12/22/2018: "Fed finally breaks the equity market", I only presented this one chart and this one weekly GUNNER24 Setup to you. Sometimes it does not take much when the facts are so clear:
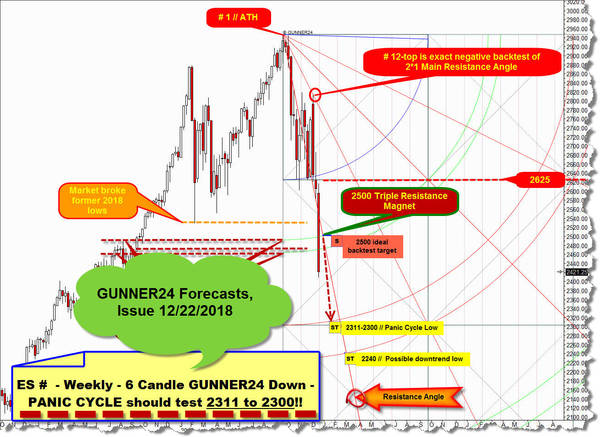
Then we used a weekly 6 Candle down setup that starts at # 1 // ATH = alltime-high to fix the likely panic cycle low target and possible - then - bear market - MAIN TARGET which was the work off and test of upper line of 2nd double arc downtarget at 2311 to 2300 pts until the latest on January 4, 2019.
The final work off of the important looking upper line of 2nd double arc support should at minimum lead to a knee-jerk cycle which usually should test back 2500 pts Triple Resistance Upmagnet within a 2 to 3 weeks lasting sharp bounce!
Any touch of the 2500 pts within Xmas trading week should be sold. But only if the 2311-2300 panic cyle target had not been processed before.
Already 2 trading days after this recent forecast, the market dropped into its final panic cycle low at 2316.75 pts. 2316.75 marks the final low of 2018:
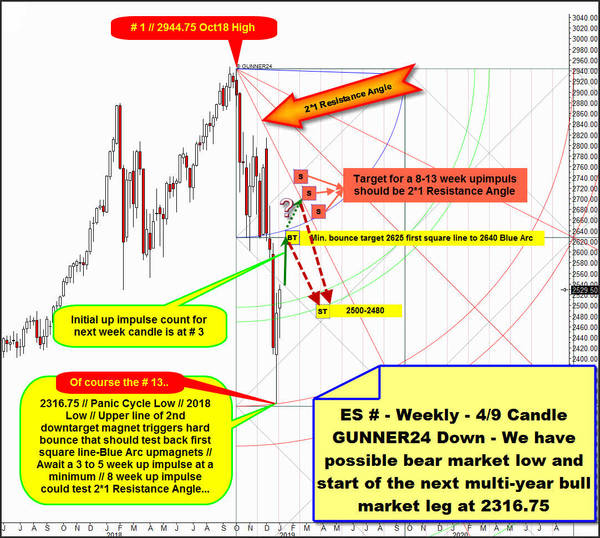
Cause at 2018 Low a visible, strong upwards impulse is triggered after a 13 Fib number week candles lasting downtrend - if we let the downtrend count begin at # 1 // 2944.75 Oct18 High - also the time factor indicates the trend changed after perfect work off of upper line of 2nd double arc within above overlayed weekly 4/9 Candle down.
Where the trend began at Fib No. 1 top, in order to be stopped then together by low of downtrend week # 4 and the low of downtrend week # 9. Means 4 - 1 = Fib No. 3 and 9 - 1 = Fib No. 8. Afterwards finally ending and turning at Fib No. 13.
You realize that from now on I measure the past developments since 2018 highs in a slightly different way than in my last analysis.
This makes a lot more sense because A) the 2018 low must have been made at an important downmagnet/downtarget that usually is B) a GUNNER24 Double Arc line and C) we also have a time influence from high to low to recognize/to count that makes total sense.
Next please watch the structure of that # 13 downtrend candle. We remember from above that market was heavily bought on 12/26 which led to bounce continuation. In the end the # 13 formed a so called "Spike Low", signaling total bearish exhaustion starting at a natural Gann Magnet. The final low of 2018 printed a Spike Low in the weekly and on monthly base. Or, bearish exhaustion visible in the weekly and the monthly chart. And such is shortterm bullish condition, and yeah usually also highly bullish for midterm!!
Means the bounce that started at # 13-low usually will last at minimum 5 week candles until next important weekly cycle high could be made! Next week will be No. 3 of bounce.
But more likely the bounce that started at 2316.75 will run for 8 to 13 week candles until bounce highs are made.
Monthly chart and ruling monthly GUNNER24 Setup below points to the possibility that the bounce could run for 5!!! month candles! Means ES # could grill and roast the bears until April-May 2019!
Above within 4/9 Candle down I`ve placed the quite normal price targets for the bounce:
A 5-week bounce quite easily should test the 2625 first square line and the 2640 Blue Arc very important backtest magnets cause bounce week # 2 was able to re-conquer 1st double arc resistance area on weekly closing base, thus officially activating the backtest of first square line resp. Blue Arc upmagnet resistances within running weekly bounce.
Both, 2625 first square line as 2640 Blue Arc usually are heavy resistances, thus a 5-week bounce should test back resistances = normal bounce targets = weekly GUNNER24 Uptargets in a negative way, followed by a next multi-week down cycle which usually will find support at then strong 1st double arc support environment which then runs 2480 to 2500.
Suppose, the first test or backtest of first square line at 2625 is imminent and will happen in course of next week.... Watch dark-green up arrow.
A weekly close above 2645 in course of January and/or February activates the imminent test of the 2*1 Resistance Angle in bounce direction. This is heavy or concrete future resistance angle which usually just will be tested IF market shows a close above 2645 in course of January and/or February. In such a case the 2*1 Resistance Angle should be tested within a 8 to 13 weeks lasting bounce cycle somewhere between 2730 to 2680 pts.
The - still valid and still nicely confirmed - ES # up setup on monthly base is a 8 Candle up starting at higher year 2016 Bull Market Low. The last time I presented that setup to you was on 10/14/2018:
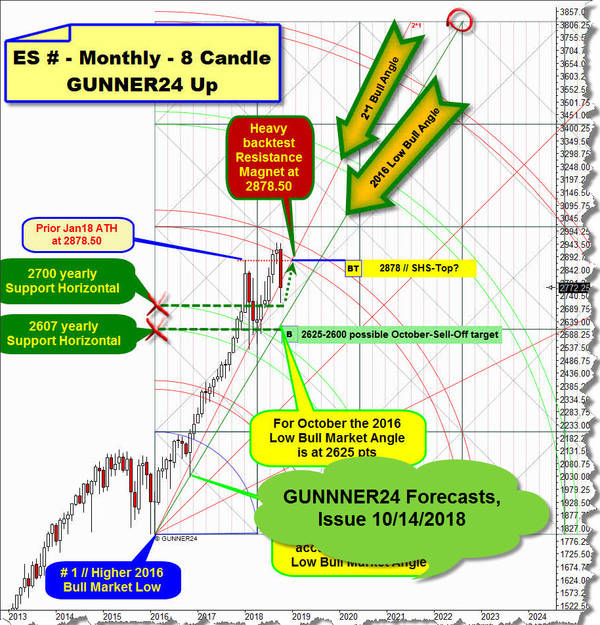
Then we recognized that the market is allowed drop further towards 2625 to 2600 pts yearly support and very attractive downmagnet in further course of October 2018 sell-off cycle cause as expected the work off resp. the first test of prior activated lower line of 3rd double arc bull market uptarget caused some serious trouble for the monthly ES # bull run.
We all have noticed that it went lower into Year 2018 Panic Spike Low.
And now look closely, where the Year 2018 Panic Spike Low came in:
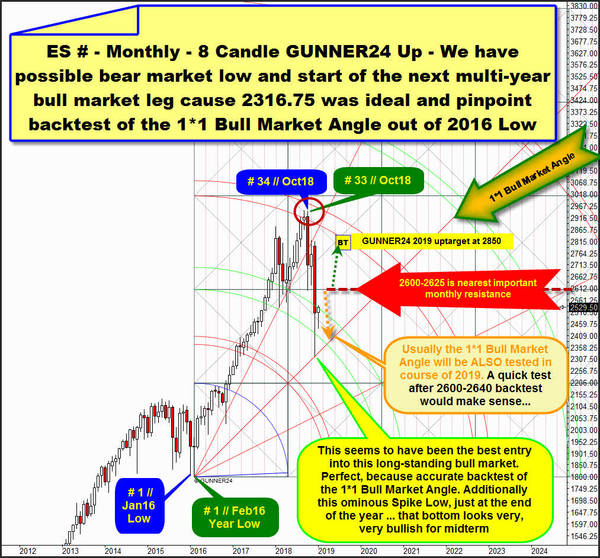
It is the perfect, pinpoint backtest of the strongest bull market support that began at green # 1 // year 2016 low that occured in course of February 2016. Strongest imaginable support within a GUNNER24 Up Setup is always the 1*1 Gann Angle and 2018 Spike Low has "just" tested strongest bull market support and quite normal 50% retracement support of entire 2016-2018 bull market.
Thats why there is now: a 65% chance that entire downtrend has ended ... at 2316.75 ... and the next strong multi-month bull market upwave has begun, which then should be able to print some higher alltime-highs in course of 2019 and 2020...
==> 2316.75 perhaps was the best entry into this long-standing bull market!
And well, if the 1*1 Gann Angle is reached at the retracement we always have to try to find the re-entry towards the main trend...
Setup above signals that the ES # now mostly is attracted by 2600-2625 nearest important monthly resistance which is natural GUNNER24 Horizontal. Thats why this bounce at least should be able to do a 2625 within a 5-week lasting bounce cycle.
The 2625 is a combined weekly and monthly resistance upmagnet, very attractive price for the running bounce. But of course this is also very strong resistance and hard to crack MAJOR resistance on yearly base, thus it is very possible that market likes a relative serious test of the 1*1 Bull Market Angle in course of February to March 2019 (2480-2500). IF! 2600-2625 re-jects the market at first backtest. Orange-dotted arrow option.
Overcoming that 2600-2625 on monthly closing base is most diffcult thing for the perhaps now resumed bull market.
Just a clear monthly close above 2600-2625 - maybe a 2640 pts and higher or so - officially triggers the often necessary backtest of the magnet which triggered prior important turn or top. And this is the 3rd double arc resistance upmagnet or alltime-high resistance double arc where the 2016-2018 bull market leg topped after a to the Fib number 34 oriented monthly cycle.
Hmm, suppose a monthly close above 2640 until end of February or end of March usually triggers the hard backtest of the lower line of 3rd double arc until April to May 2019 at around 2850 pts. Dark-green dotted arrow outcome.
For 2019 GUNNER24 sees at minimum a 2850 pts!
First monthly close above 3rd resistance double arc is next strong bull market continuation signal.
The first monthly close below 1*1 Bull Market Angle will be a next serious sell signal. And would officially end the bull market in Gann terms. And should release a test of the "Big Round" 2000 pts and the test of the 1*2 Angle in further course of 2019.
Be prepared!
Eduard Altmann
Did you find the newsletter article interesting?
You can forward it on to your friends, too! Please click here!
You can subscribe the GUNNER24 Newsletter Forecasts for free:
Order your FREE GUNNER24 Newsletter NOW
More GUNNER24 Services – click on the links below to get more information
Complete GUNNER24 Trading and Forecasting Course – learn to use a forecasting technique that produces 70% winner trades.
GUNNER24 Forecasting Charting Software
GUNNER24 Trading Setup Examples
Membership – 7 day RISK FREE TRIAL
GUNNER24 Detailed Action Sheet
Commissioned Charting Forecast – 20 to 50-year price forecasts
Trading Manuals - Overview
GUNNER24 Products - Overview
GUNNER24 Members – Please Login here
If you have forgotten your membership password, click here, and we will send it to you via e-mail.
To ensure delivery of our forecasts to your inbox, please add gunner24-forecasts@gunner24.com to your e-mail address book or safe senders list.