As well the US stock markets we track as both precious metals – gold and silver – showed some conspicuousness that is very - or let’s say extremely unusual in terms of amassment in such a short period.
What I mean are the puzzling and brutal collapses, sell-offs and Flash Crashes in the corresponding future markets shortly before or after close of trading and during the most thinly traded Asian trading hours. Sometimes some monster short-orders are being positioned that are impossible to be filled (gold/silver) but that lead to quick, low-pitched price drops, or in the context of lowest buy and sell volumes they induce "Flash Crashes" (such as happened on 12/21 in the stock market futures), or they sell off with an intensely high volume where nobody would expect it. That’s what happened on Friday by trading close.
The reasons are being delivered later: China shorted gold and silver. Paulsen sells his gold permanently because he lost in the game. There’s a Flash Crash because the wicked HFT algorithms are active, thin trading volume. Then there’s some tax selling to be seen, some fiscal cliff selling where of course the investors are responsible – though they are hardly supposed to get rid of their longs like madmen on Friday after X-mas and after trading close up to the weekend. It’s now this, now that – now FED, now man – now HFT, now small investor, now the hedge funds.
Crazy world out there! Whereas the long-standing gold and silver traders or the commodity trader respectively are used to such "actions" during the thinly traded future market hours for years, for the US stock markets these actions are still pretty uncommon. As mentioned, even more uncommon is the fact that this time in addition the stock market futures are concerned.
The reason for the attacks is not this or that, China, Paulsen, flash-crash, fiscal cliff, blah, blah, blah. It’s the thin market! In case of little trading, when but a few market participants are joining the game, it is easy for a Big Fish to implement some short-attacks as a tool of exploitation. It’s a business model of the Big Boys to cash up the SL of the little fishes. FED, China, hedge funds, JPM and GS etc., that’s what those boys live off.
Formerly, in the age of telephone it was still the pit traders/pit brokers that first pulled up the markets, initiating quick intraday sell-offs to ensure their bread and butter. All the market makers like panic in the markets. The price moves downwards always result more severe and faster than the uptrends. The elementary fear of all the market participants of too big losses has always facilitated the Big Boys to make money very easily. It’s a business model to wipe out the little ones!
The Big Boys have the smartest heads in their ranks. They don’t only fiddle about service charges, derivatives and certificates, swaps and God knows what else to take the normal folks for a ride! Do you think the Big Boys’ university and computer nerds only sip their coffee letting us make a little money? No Sir, we are the enemy that is still in the game having too many readies in the trading account. That cash has to be re-distributed getting into the right hands!
Our way out to avoid all those gimmicks is not to position a SL in the futures markets. If you want to trade futures, make sure you’ll be able to monitor and oversee your trade permanently, in fact without SL positioning or just with a narrow SL for the individual trade. Only those who have plenty of time to trade futures should do so. Don’t ever keep the contracts overnight, you better scalp. Whenever you detect irregularities in the futures markets with the trend not appearing to be 100% stable, please use the non-levereged ETFs and CFDs for your swing and position trading. You can keep these instruments longer thus waiting out your positions. If you are positive about the medium-term trend go ahead and increase your ETF/CFD position by little steps in case of price peaks or price collapses respectively.
Thin markets dilute the chart analysis substantially. In times like that I don’t trust at all the indicators, EW and Fib signals, nor the conventional pivots, supports and resistances. The reason: In conventional chart analysis the volume plays a very important part. So, if the volume doesn’t back the price analysis or even thwarts it, always an important pillar will be absent in the trend analysis. Missing volume gives the price more scope, as well upwards as downwards. Over- and understatements will have to be accepted as to be given in times like that.
Gann analysis has much to do with time and time analysis. Gann trading techniques permit us to recognize when time is mature for a "sincere" reaction/counter-reaction. It enables us to anticipate where we can get down to serious business to risk a trade without dealing too much with the more or less usual gimmicks of the market and the Big Boys:
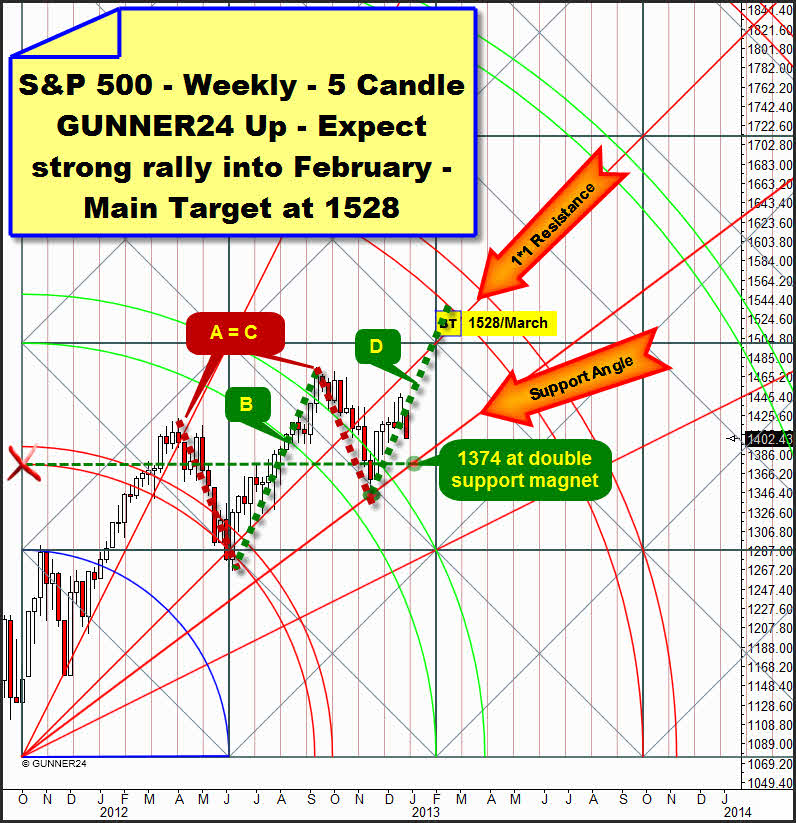
That’s why for me the general trend in the S&P 500 until the 1525 target through spring 2013 is still completely all right, in spite of the severe last week candle. Also in the last big upmove of the B-wave the price was allowed to fall below the finally pre-destined angle. It’s also allowed that the next trading week or the one after next may touch down on the weekly support angle before the final exhaustion move heads for the 3rd double arc. With the beautiful late Friday sell-off even a very riskless long-entry opportunity on Monday or Wednesday respectively is arising now:
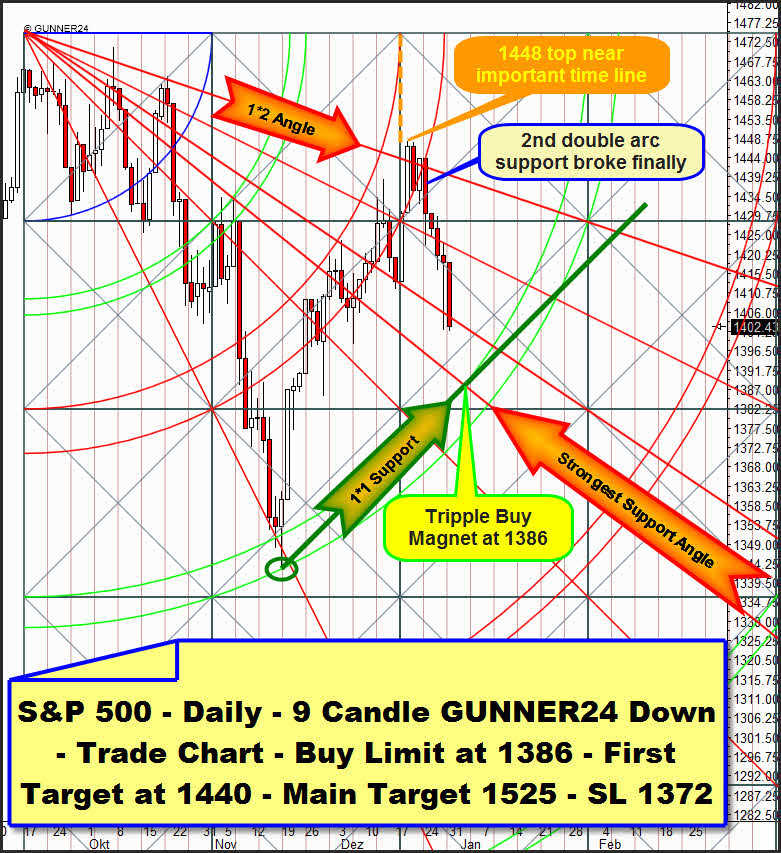
Let’s consider the actually valid daily 9 Candle GUNNER24 Down Setup. In the GUNNER24 Forecasts of 12/16/2012 we announced the target 1442. Even the peak of 1448 index points were reached on 12/18/2012. That was a price exaggeration because of the thin market, I think… Thus we produced 19 points of profit with the long-position we entered on 12/11.
Retrospectively the S&P 500 followed the 2nd double arc upwards. But – as analyzed (GUNNER24 Forecasts of 12/09) – all in all it offered so much resistance that the market became unable to close above. At the important time line the market topped, and subsequently the support function of the 2nd was left downwards. Target for the downswing is newly the 3rd now. Think, it had to be touched before a new upswing may start from there.
The question is now whether the market wants to turn up again from the upper line of the 3rd or from the lower line of the 3rd, as it did at the absolute November low? The strongest magnet is the triple buy magnet at 1386. That is the intersection point of the upper line of the 3rd with the 1*1 Support Angle that started from the November low and the Strongest Support Angle at 1386. The 1386 triple buy magnet coincides with Wednesday…
On Monday the 1*1 Support Angle passes in combination with the upper line of the 3rd at about 1384. On Friday the March ES contract closed at about 1387, means 1391 or so for the S&P 500. That is actually very close to the triple buy magnet that is pretty likely to be reached in the course of Monday/Wednesday.
At 1386 we’ll buy the S&P 500 MIT, market if touched on Monday or Wednesday, respectively. SL is a daily close below 1372. The chance for the continuation of the rally is excellent: The daily 3rd double arc is supposed to give support again. Monday will be day # 8 of the correction since the 1448 top. Fib numbers often ring in the turn… The markets are oversold on daily base. Any fiscal cliff arrangement shall newly lead to an upswing, actually triggering the starting signal for the final exhaustion move.
The risk is very limited because a daily close below 1372 would as well endanger the support of the 3rd double arc in the daily setup above as fall short of the weekly support angle. So the whole uptrend theory – 1525 till March – would get into a great difficulty! First target for the longs are the 1440, main target is 1525.
This is where you may always observe our index trades:
http://www.gunner24.com/trading-performance-us-stock-markets/
|
„As far as I know", the GUNNER24 Forecasting Method is the globally unique and only technical analysis tool that deals intensely with the comportment of the market at support and resistance marks being able to combine that with price predictions. You’ll learn everything on these really "secret" facts in the Complete GUNNER24 Forecasting and Trading Course. Order now!
Be prepared!
Eduard Altmann


