
In the course of a deflationary down-wave which began in course of the summer, the gold and silver incl. precious-metal stocks have newly gathered some bearish pace. Consolidation patterns were left downwards since while some important supports broke.
Today, predominantly I’d like to go into the impacts and consequences of the last dam breaks in the Gold and Silver Miners. We are practicing this with the example of the GDXJ ETF, the Global Gold Juniors. These past important developments help us to adjust or confirm the final year lows of the entire precious-metal stocks sector according to time.
Below you see the monthly GUNNER24 Up Setup which depicts the GDXJ course since its important year 2016 Bear Market Low.
This very, very well confirmed setup offers that the Gold and Silver Miners want to deliver their final annual lows around Christmas time, or possibly only on the very last trading day of 2018:
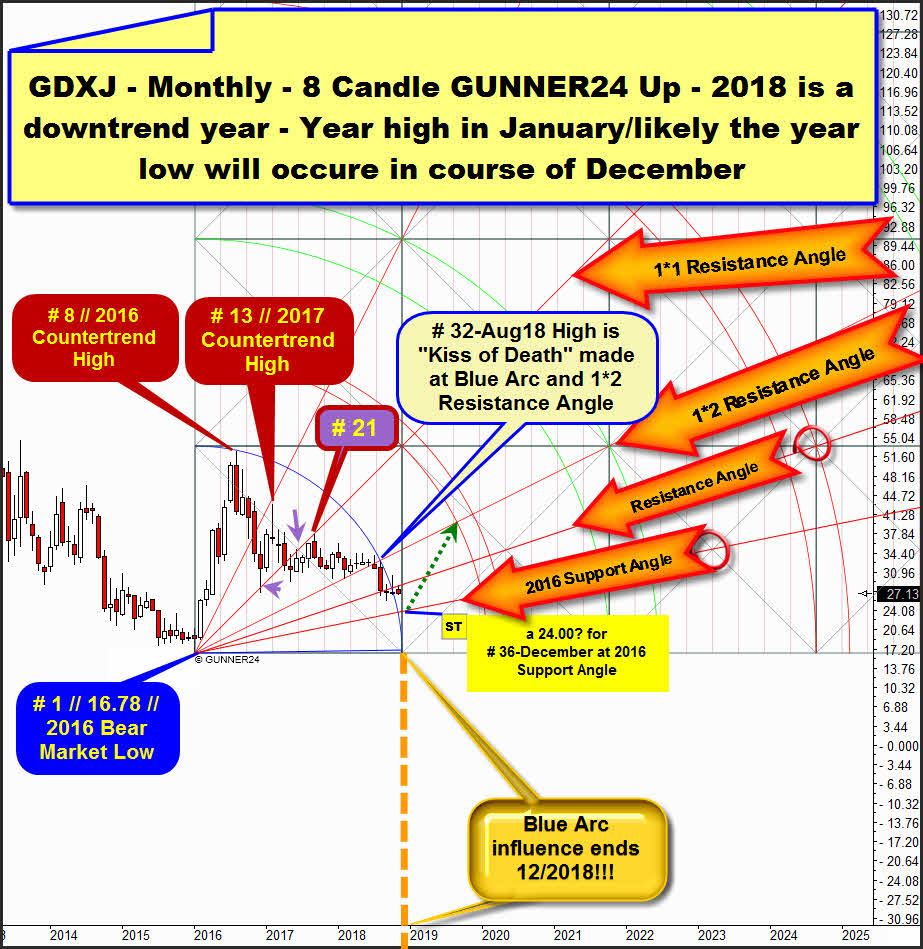
Monthly countertrend count starts - as entire up setup - at # 1 // 2016 Bear Market Low.
Top of countertrend candle No. 8 delivered the highest price of entire countertrend. 8 in this case is MAJOR Fib turn number.
Candle No. 13 of countertrend marks final high of 2017. So, Fib numbers 8 and 13 have delivered final highs on yearly base or major turns and a series of lower important countertrend highs. Fib number # 21-high was another important lower countertrend high and was negative backtest of prior downwards broken 1*1 Resistance Angle. Once again a Fib number signaled a major turn or important lower countertrend high.
Monthly setup above measures from # 1-Bear Market Low to # 8-Countertrend High, current highest countertrend price. Thus, the Blue Arc promises theoretically strongest possible future resistance or main countertrend resistance.
Since the July 2018 highs, the market is now, visibly and obviously, following the resistance of the lower line of the Blue Arc in the dominating monthly 8 candle up again. This Blue Arc resistance on yearly base is now pressing the GDXJ again, more and more downwards.
The scored high of # 31-July 2018 was slowed down due to existing Blue Arc resistance. At top of # 32-August 2018 the Blue Arc was 100% accurately hit from below, followed by next monthly sell candle which was cemented by # 32-Aug18 close, the lowest monthly countertrend close since made # 8// 2016 Countertrend High.
Hmm, watching all the individual candles of 2018 up to day we first see that the 1*2 Angle gave exact month low support at 2 tests after # 31-July 2018 fired first monthly close below 1*2 Angle we can state that 2018 downtrend cycle has begun at # 31-July 2018 highs = likely influenced by Blue Arc Countertrend Main Resistance.
Obviously the reached # 32-Aug18 High was very bearish pinpoint test of 1*2 Resistance Angle and Blue Arc which formed heavy resistance magnet from above. We call this a "Kiss of Death" made at yearly resistance magnet. This triggered long-lasting bearishness, which was STRONGLY confirmed by strong August 2018 downtrend candle close.
Well, past month October 2018 close still was held back by Blue Arc rail and obviously also this November candle is influenced by bearish Blue Arc magnet and a naturally anchorable Resistance Angle which was 100% accurately negatively tested at this month high.
=> because we have strong confirmation that the Blue Arc is a very important resistance for this countertrend cycle the multiple proven negative influence of the Blue Arc should continue into December 2018 at least. Only then the Blue Arc influence does "officially" phase out, because only then it cuts the time axis. So... it may well be that the now running Gold and Silver Miners downtrend might last until the last trading day of the year!
The also within setup naturally anchorable "2016 Support Angle" became activated countertrend Gann Angle downtarget after final support break of the 1*2 Angle and may be the main support (PRICE factor) for the 2018 downtrend cycle to finish and for a next monthly upcycle to start which is expected to test back lower line of 1st double arc/1*2 Resistance Angle upmagnet sometimes in course of autumn 2019. For that 60% possible outcome watch dark-green dashed arrow placement.
"2016 Support Angle" runs at 24.00$ for the possibly very important bearish # 36-December extreme!
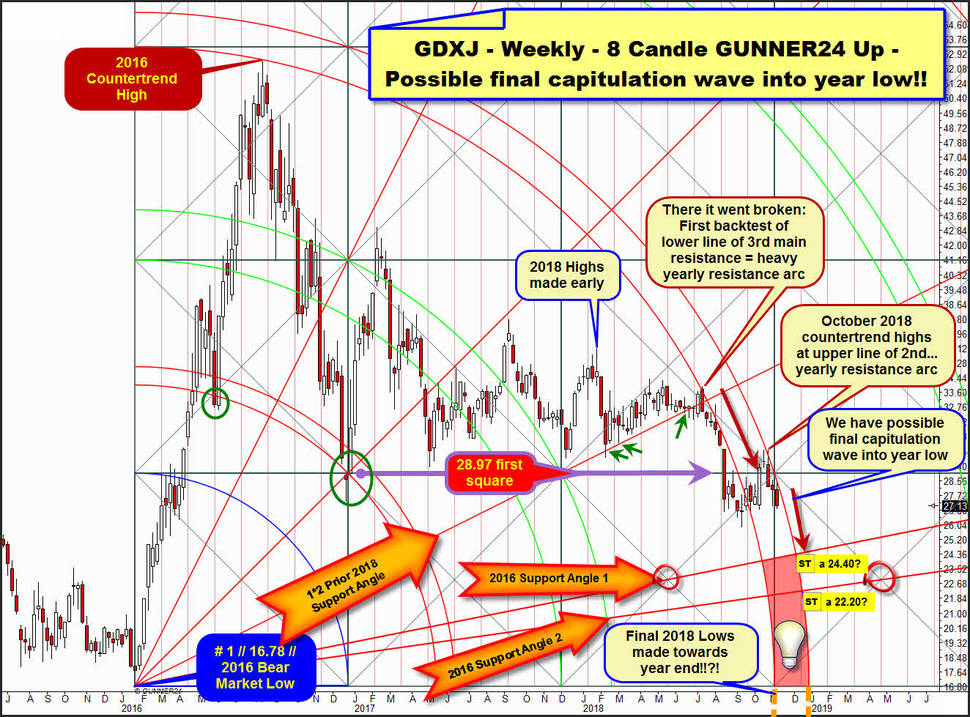
Above is the weekly main setup of the entire countertrend. Another "classic" 8 Fib number Candle up starting at # 1 // 16.87$ // 2016 Bear Market Low.
2016 Countertrend High was textbook to the T work off of lower line of 3rd double arc natural bull uptarget. Thus, the lower line of 3rd became most strongest important future resistance for the GDXJ. And guess what did happen after first test or first - negative - backtest of lower line of falling 3rd double arc main resistance arc...
... it went down the drain. Or in plain words, the 2018 downtrend cycle started at THE VERY FIRST - negative - backtest of lower line of 3rd and after "1*2 Prior 2018 Support Angle" was fallen short on weekly closing base.
==> the falling 3rd double arc became confirmed falling yearly resistance arc, a prior very strong resistance cause it triggered a hard and fast downwave or a sell-off cycle!
The 2018 sell-off cycle finally bottomed 10 weeks ago and a next weekly countertrend began which topped 3 weeks ago at UPPER LINE of 3rd double arc (the reached October 2018 countertrend highs...). October 2018 countertrend high was 95% accurate work off if upper line of 3rd double arc which is of course directly connected to the lower line of 3rd. Thus upper line of 3rd is also a downwards sloping arc resistance on yearly base, indirectly connected to 2016 Countertrend High.
Actually, upper line of 3rd puts strong bearish pressure on the market. Is pushing price lower and lower on weekly closing base and this allows that GDXJ actually is within another sell-off wave which usually should continue far into December, resp. is poised to bottom sometimes in course of December.
Upper line of 3rd is reason for why market could now capitulate into final low of 2018!
==> Please observe that the 3rd double arc resistance influence looks like continuing until the very last trading week of 2018, only then the upper line of 3rd double arc is intersecting the time-axis. Thus, the 3rd "officially" expires at the end of this year. So - theoretically and even practically - the negative 3rd double arc energy can push the market down until the last trading day of the year.
==> The GDXJ is now under confirmed common negative influence of a downwards sloping weekly GUNNER24 Double Arc and a downwards dragging monthly GUNNER24 Blue Arc. So this downtrend can get a lot worse according price factor!
==> Final capitulation low target region for the GDXJ is hard to examine actually, from my point of view.
The possible final capitulation low could arrive at 24$/December 2018 cause there and then is monthly Gann Angle support.
Weekly setup above additionally offers some reliable strong Gann Angle supports below current quotations.
A) there is 2016 Support Angle 1. Existing at about 24.30$ towards end of 2018.
B) Next lower important is 2016 Support Angle 2, which is around 22.20$ for end of the year.
Such deep price aggravation, afterwards starting a possible very important turn wouldn`t really surprise cause market should be in its final capitulation wave of 2018 downcycle, and in those usually break many important dams.
Attention to Bulls and Bears:
Usually the very first weekly close above the weekly upper line of 3rd double arc main resistance within weekly 8 Candle up - even if it was only very marginal - signals that before the final downtrend low has been found, and the market must be in a newly started WEEKLY and MONTHLY upcycle!
==> ANY FUTURE first SIGNIFICANT monthly close above Blue Arc main resistance within presented monthly 8 Candle up setup triggers a usually 3 to 6 months lasting upcycle!
Be prepared!
Eduard Altmann