
Late-August the WTI crude oil started breaking down after 3 months of slowly grinding higher in a tight range. In the first step we quite successfully went short in the XLE Energy Select Sector SPDR Fund (GUNNER24 Forecasts, 09/13/2020, "Shorting the oil sector looks like a no brainer").
Now a stronger daily downtrend has established, making lower highs and lower lows pattern, indirectly confirming that the global economy is broken and a major top is here in the US and European stock markets. With the help of USO (United States Oil Fund is the largest and most liquid oil ETP) we can now work out the perhaps most prominent correction goal of the crude oil in terms of price and time. The next important intermediate cycle low could be printed around October 23-26. We therefore assume that the US election time event (11/3) will also have an important influence on oil.
The most important bearish influence factor on Oil/USO seems to be an Inverted J-Hook. The Hook can be seen in this weekly chart, but also in the afterwards following daily chart work:
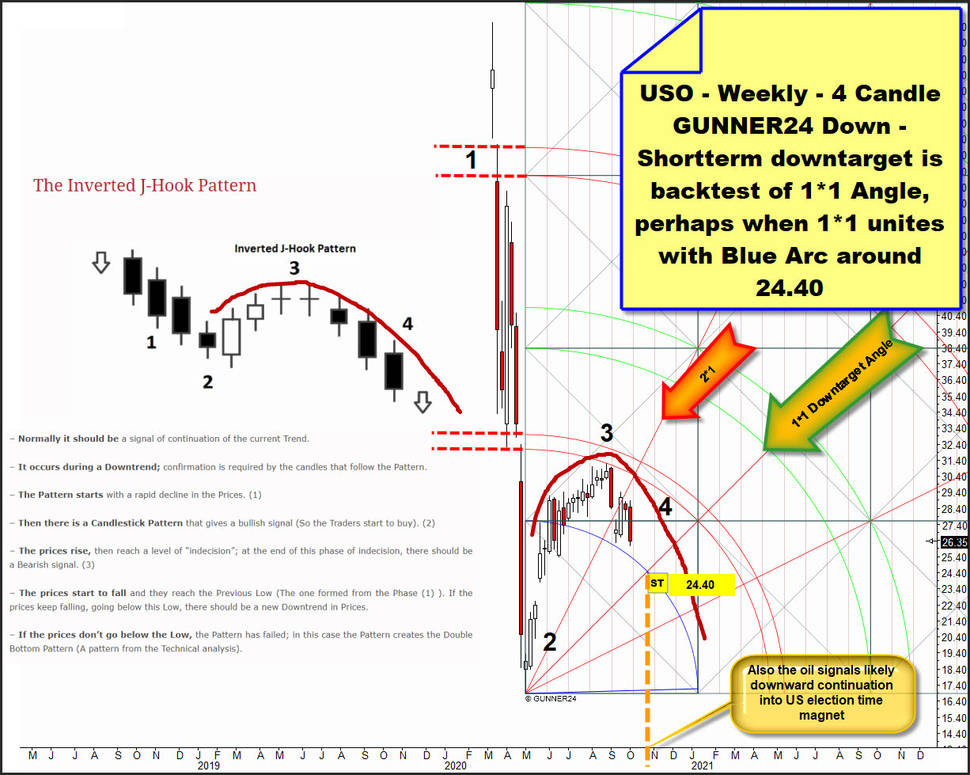
The typical Inverted J-Hook pattern characteristics and effects are highlighted at the left side of the weekly USO chart above. J-Hook`s are a quite rare, but also very, very reliable chart pattern, which in the case of oil shows that it has now reached the stage of a fairly sustainable downtrend.
After a brutal decline (1-USO traded at a 106$ at January 2020 year high), the 2020 Low was printed at a 16.88$, and bought (2). The top of the weekly Inverted J-Hook (3) with a 100% accuracy tested natural lower line of 1st GUNNER24 Uptarget within at 2020 Low overlayed weekly 4 Candle up.
Since weeks USO seems to be in phase (4) of an Inverted J-Hook what is down and usually aims lower lows compared to 2020 Low or a double low pattern on weekly and monthly base or a higher low compared to 2020 Low.
The GUNNER24 Method signals that the most important main support out of 2020 Low could be a logical for the downtrend that began at (3)-lower line of 1st countertrend high. Within the GUNNER24 Up Setups this is always the 1*1 Gann Angle. 1*1 Downtarget Angle was activated as an important necessity for the downtrend after the important 2*1 Support Angle was severely undercut 3 week candles ago and tested back very negatively 2 week candles ago.
Interestingly the 1*1 Downtarget Angle = big natural support out of 2020 Low is intersecting another always major GUNNER24 Backtest Rail, what is the Blue Arc towards the end of October at around 24.40$.
Concerning this very interesting magnet, the possibly next due intermediate cycle extreme, I will tell you more below.
But first we wanna have a look at the Inverted J-Hook in the daily chart and analyze it further:
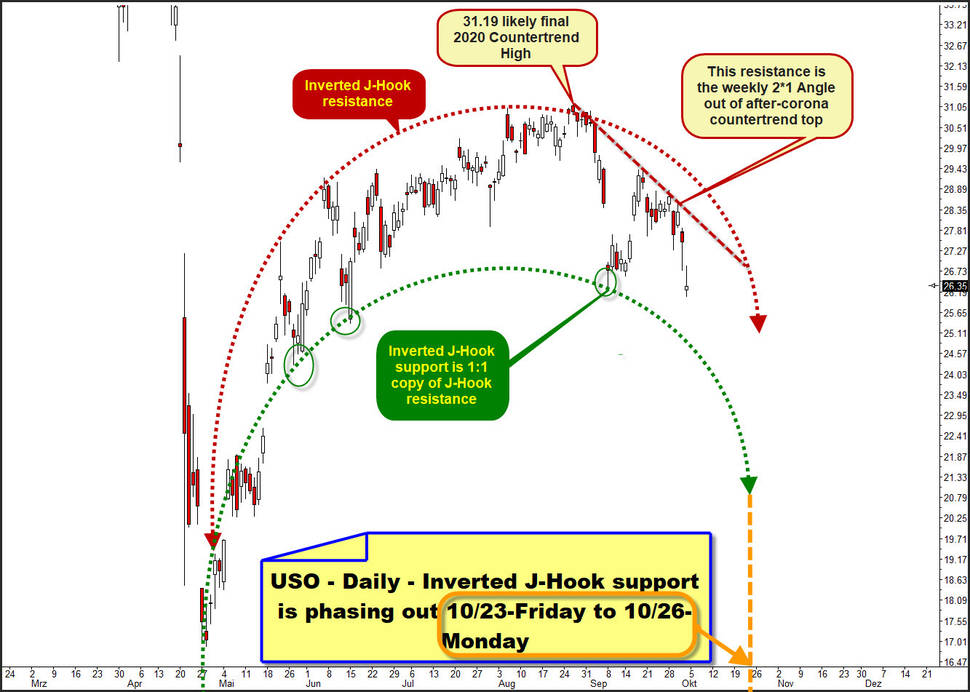
Dark-red dotted arc is the Inverted J-Hook resistance rail. Dark-green dotted is the Inverted J-Hook support, where I first tried to capture the J-Hook resistance in detail.
Then I took the course of the resistance and copied it 1 to 1 and adjusted it to the lower right to nail some of the most important recent day lows. It is important that the both rails of the Hook have their starting point approximately at the year lows (time). Simply because they must be born around this major time window.
So the Inverted J-Hook support is a 1 to 1 copy of the Inverted J-Hook resistance. With this technique we get not only important natural future and obvious future resistance magnets and supports (price), but also get a hint until when the rails of the Hook should be effective.
Namely until they officially expire in terms of time factor. And that is always the case when they cross the time axis as the orange-dotted vertical line above indicates for the Inverted J-Hook support rail.
If we assume that the Hook support above
will continue to radiate main support and never will be broken until it
has officially phased out regarding time, it is logical that a very
last and maybe the most important/decisive test of the Inverted J-Hook
support raily is scheduled around October 23 to 26 to form then the
final resp. a next intermediate cycle low.
And it is precisely around this apparently important future time window that the weekly Blue Arc and the weekly 1*1 Downtarget Angle merge at around 24.40$:
==> Now we have identified a future MAJOR support magnet regarding time and price what is at 24.40$ for October 23-26. Then and around there this downtrend might form an intermediate cycle low!
==> Shortterm and 2020 main downtarget at 24.40$!
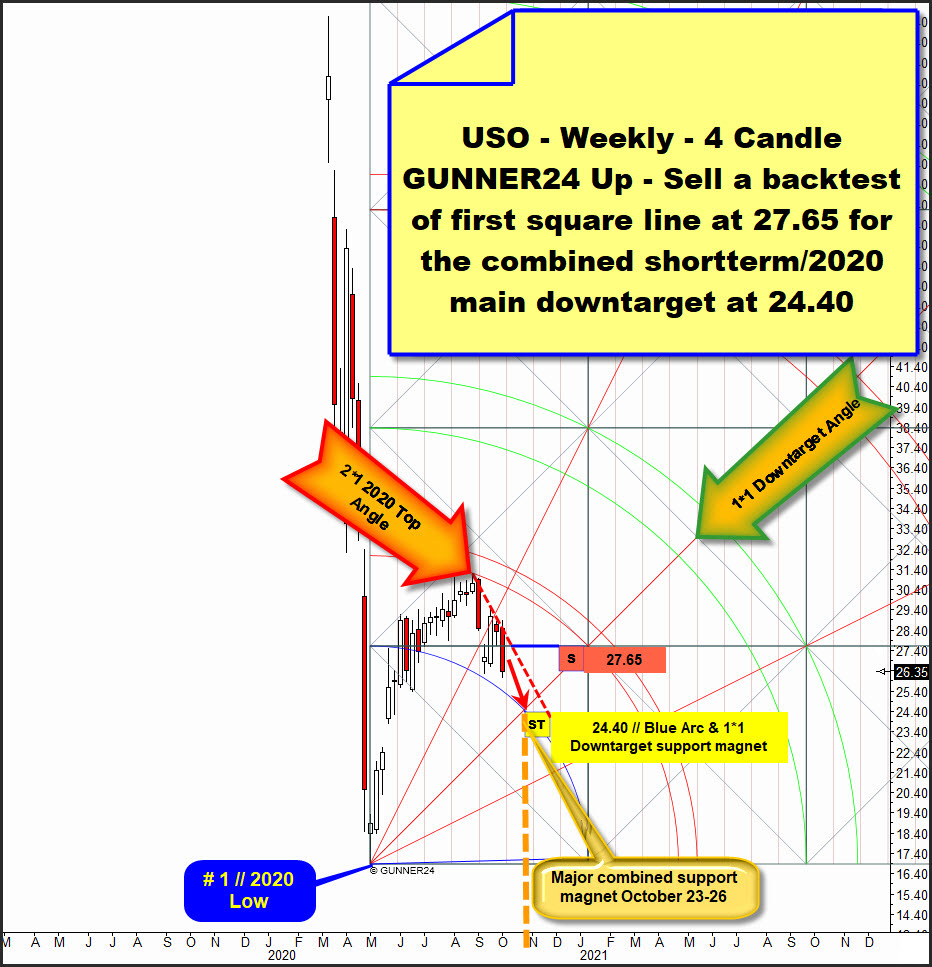
USO finished the week below 27.65$ first square line support closing the week near absolute lows. Therefore a next weekly sell signal and downtrend continuation signal is fired.
As a consequence of this next strong bear signal also the coming week should be again a bearish one. Think, it is a no brainer that we have to sell-short USO at a possible backtest of the first square line, bigger = strong weekly resistance actually... The coming days could test back the first square line & 2*1 Angle out of 2020 Countertrend high at the same time! This „2*1 2020 Top Angle" has morphed to a 4 times at week highs negative tested threshold. Together with first square line rail the 2*1 2020 Top Angle resistance forms big backtest magnet and the Gentlemans sell-short point which runs at 27.65$ for the next trading week!
Be prepared!
Eduard Altmann