
As worked out last at the beginning of June, the markets are correcting in June their exceedingly strong up-leg started in November 2012. On 6/6 in the S&P 500 the swing low of the current correction wave was made at 1598.23. Thus the index has not yet worked off its minimum target of this correction situated at 1595 index points.
This performance permits two conclusions:
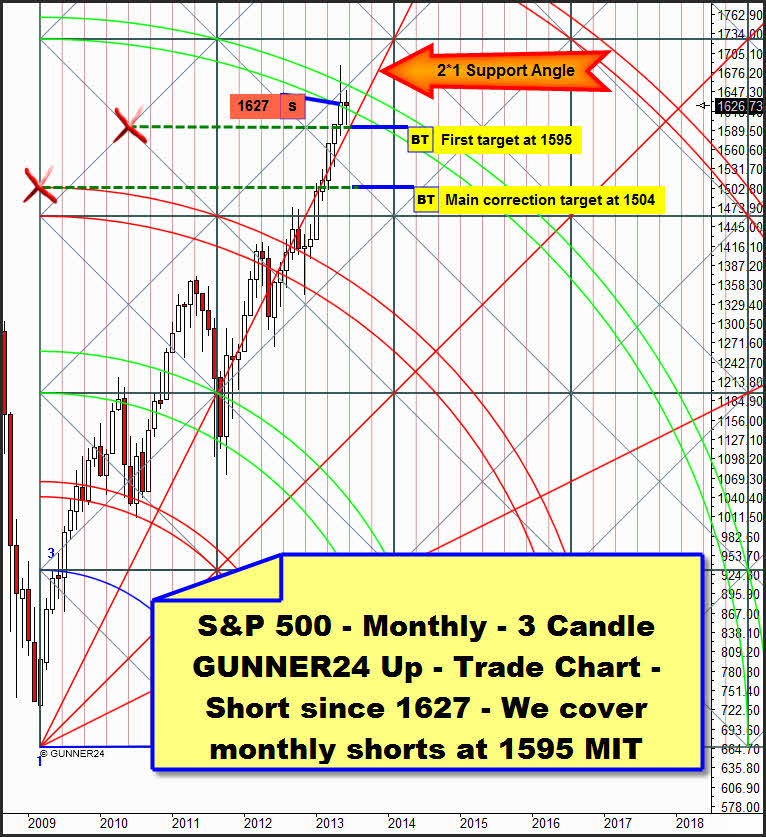
1. Actually the market keeps on showing extremely strong, even during the current correction, correcting the last up-rally in the daily chart in a so-called ABCDE-triangle-formation where the actual swing low of 6/6 is likely to be fallen short but extremely minimally. In that case the ideal target of the E-wave-low expected to happen next week/beginning of the week after next would really be "only" the first target in the monthly 3 Candle GUNNER24 Up – the 1595! The 1595 springs from the center of the just passed square being – beside the lower line of the 4th double arc – the actually strongest monthly support. In my opinion the probability that the market wants to correct in an ABCDE formation on daily base is at about a 40%. That’s why we’ll still cover the monthly short-position at 1595 MIT (market if touched).
2. If however the 1595 does not hold over the coming fortnight – i.e. if the S&P 500 closes below 1595 one of the next two weeks the market will be likely to fall down to 1548 index points in a classical ABC-correction-wave before starting from there its next powerful up-move. I see the probability of an ABC correction to happen at a 60%!
Currently I consider as nearly impossible that the market crashes till the allowed Main Target in the monthly time frame!! That would be the 1504, the horizontal support that arises from the intersection point of the upper line of the 3rd with the beginning of the setup.
In June the lower line of the 4th is at 1623 index points being a clear sign of power that the bulls haven’t yet allowed the S&P 500 to close within the current correction beneath the 1623.
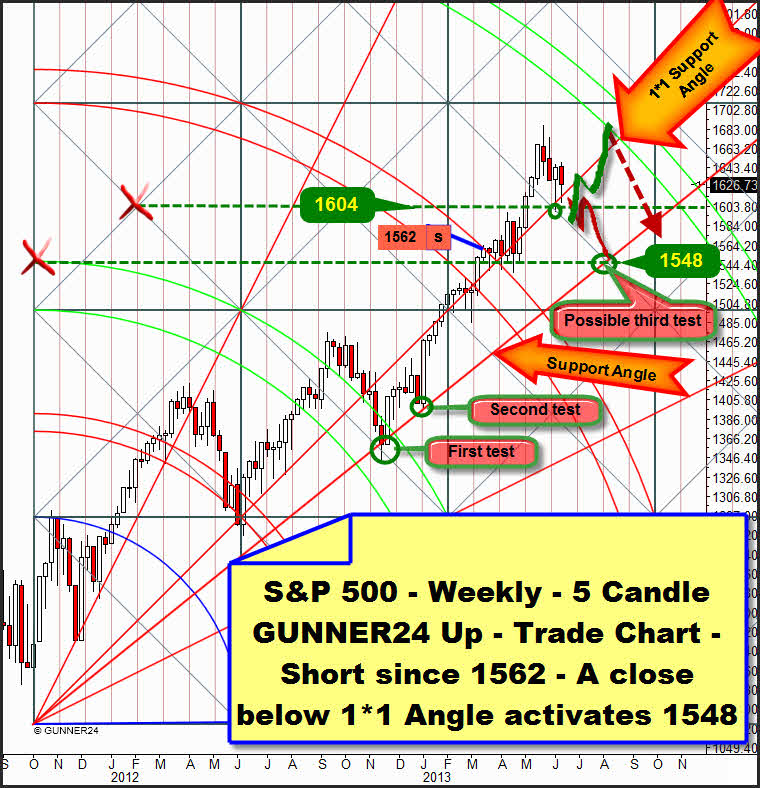
In the weekly setup we clearly see why the bulls have still the upper hand and why the correction has turned out minimally so far. In October 2012 the last rally started. The initial impulse lasted five weeks. We measure it up from the October 2012 low to the high of the 5th candle with the Blue Arc. Thus the future magnets = the future supports and resistances (lines, double arcs) and the relevant Gann Angles are pre-defined.
Let’s have a closer look at the 1*1 Gann Angle now. Most of the time since October 2012 the S&P 500 traded above this angle. When the market trades above the 1*1 in an up setup the market is bullish, when it trades below it is bearish. All in all the market is nearly always orienting itself to the 1*1 in the current uptrend. This one is guiding thus the ascent of the whole up-leg in price and time. If the market moves too far upward the 1*1 will fetch it back down to earth. Only for 12 weeks the market traded durably below the 1*1, but then it was attracted again by it after the first test of the next lower Support Angle was successful.
The last two weekly lows are lying closely beneath the 1*1 Angle. It resists. It keeps the uptrend intact. If the correction wants to come to an end with the ABCDE-formation again the 1*1 will be fallen short just narrowly - with a low at 1595… then the market will take up again its way till the 4th double arc reaching it until the beginning of August 2013 with a double top or – what would be much more likely – with a small higher high in order to correct downwards then mightily. Such a course (a 40% of probability) is sketched green in the weekly chart above.
But I rather suppose that the market will break away downwards ending up in a third test of the "Support Angle"! With a probability of a 60% the Support Angle is expected to reach the strong Gann Magnet at 1548 in the second trading week of July. This is the course sketched red in the weekly chart. From those 1548 the next powerful up-leg is supposed to start that someday in spring 2014 will be expected to top out at about 1900 index points.
We’ll cover all our weekly short-positions when the S&P 500 will have reached the 1548. Market if touched.
We have been short since 3/14 and 1562 in the S&P 500 and since 03/18 und 14500 in the Dow Jones.
Let’s go a little bit into the details. To grasp better the actual correction let’s go into the daily time frame:
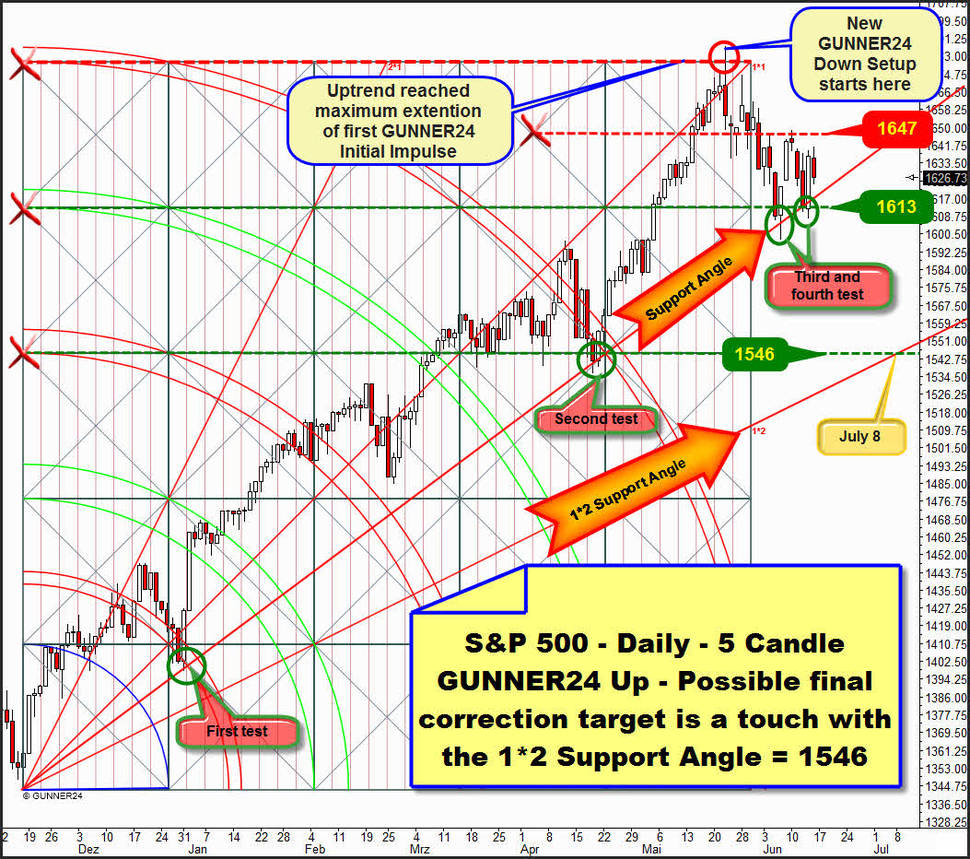
The last strong up-leg finished at the maximum extension put out by the daily 5 Candle GUNNER24 Up. Starting at the low of 11/16/2012 we measure up to the high of the initial impulse on 11/23/2012. The rally turned out not to end before the maximum extension of the market in terms of price. In addition, on the day of the all-time high the 1*1 Gann Angle was clearly broken downwards – a sell signal. Furthermore five days after the all-time high the S&P 500 lost the support provided by this setup in terms of time. Temporally the setup expired on 05/29/2013. Since additionally the S&P 500 in the monthly 3 Candle GUNNER24 quoted at the 4th double arc, a strong resistance ribbon, the market swung into the correction. It turned because the combined monthly and daily resistances forced it down.
According to the GUNNER24 Rules we may apply a daily down setup above at the all-time high. We’ll see more about that in the next chart…
Currently the correction is detained by the clearly identifiable Support Angle. Very nicely we recognize how important this Support Angle on daily base is. Twice – at the first and at the second test it chases the market up again. Within the last 7 trading days it was tested for the third and the fourth times. The next selling wave on daily base is expected to start in case the S&P 500 closes below this angle unambiguously. I.e. concretely: A closing price below the 1613 during the next five trading days would be likely to unleash the next downwave. According to the Gann Angle trading rules the target in the daily time frame is the 1*2 Support Angle that was activated as the medium-term downtarget after the break of the 1*1 Angle.
The only support that may prevent the daily 1*2 Angle to be reached is the GUNNER24 1595 monthly support. See uppermost. Will this one resist or won’t it, that is the big question – as analyzed above!?!
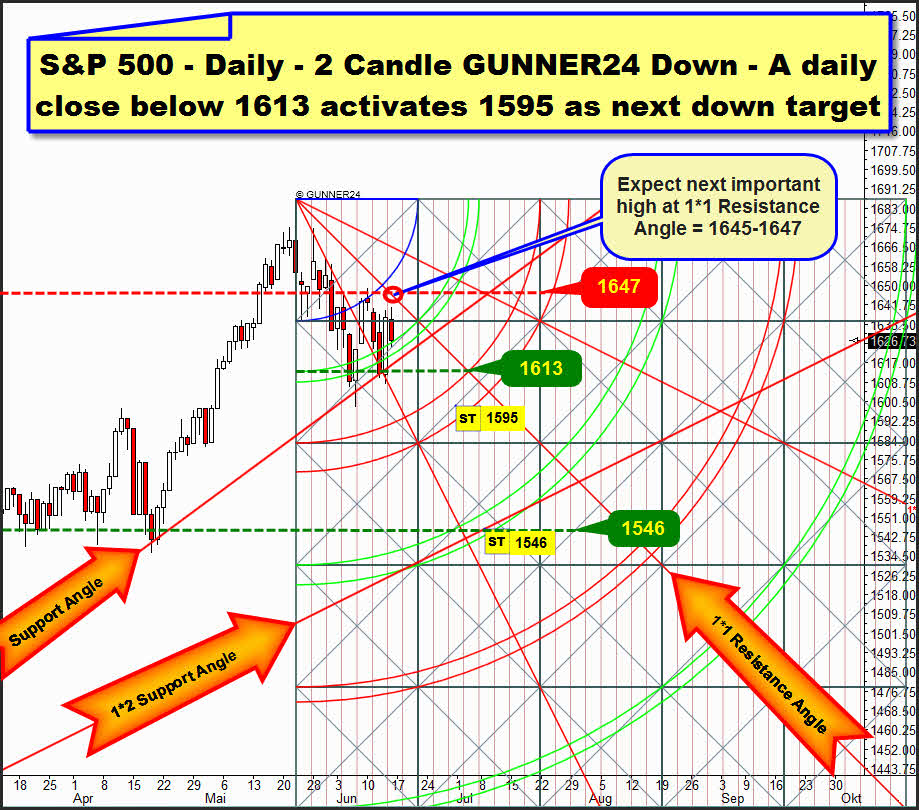
In the final analysis a look to the valid daily 2 Candle GUNNER24 Down Setup confirms all the recognitions of this issue.
The correction on daily base turns out to be very weak. First the initial impulse took only two days resulting measly. Secondly the market achieved to row back up to the Blue Arc after the first double arc had been reached. That really is a strong market. In addition the support of the first double arc holds on somehow currently forcing it up again, certainly pretty weakly but positively.
You may expect the next downleg to start when the 1*1 Resistance Angle will be reached either on Monday or Tuesday. I expect there at the 1645-1647 surroundings a next important lower daily high.
In the daily a general sell signal is present because as many as two daily closings below the first double arc have activated the 2nd double arc as a downtarget.
The next daily close below 1613 would technically have to guarantee the heading up for the 2nd double arc. This one is situated in the surroundings of the 1595 monthly support! So the 1595 are not only a monthly but a combined daily and monthly support. Any time the correction may finish there!
A weekly close below 1595 will activate the 1548 according to the analysis of the weekly chart. This target is to be made out in the daily down above as well, the surroundings of the 3rd double arc. In the daily time frame the 1548 will be activated if a significant closing price beneath the 2nd double arc in the daily 2 Candle GUNNER24 Down Setup is generated.
|

„As far as I know", the GUNNER24 Forecasting Method is the globally unique and only technical analysis tool that deals intensely with the comportment of the market at support and resistance marks being able to combine that with price predictions. You’ll learn everything on these really "secret" facts in the Complete GUNNER24 Forecasting and Trading Course. Order now!

Be prepared!
Eduard Altmann