
In order to trade profitably with the highest consistency, you need to be well equipped to recognize the greatest probability event for the upcoming trend in whatever market you choose to trade. Price/time analysis, when done precisely, will provide you with remarkable trade setups of what a market should do next.
With regard to the most recent price/time events, the XLE Energy Select Sector SPDR Fund runs almost as reliably as clockwork.
We last dealt with an XLE trade idea last year on September 11th. In that TOTD issue I analysed, among other things, this weekly 8 candle GUNNER24 Up Setup that can be created at the final XLE low of 2020. You can click here or on blue and on the chart below to review this latest XLE analysis in detail:
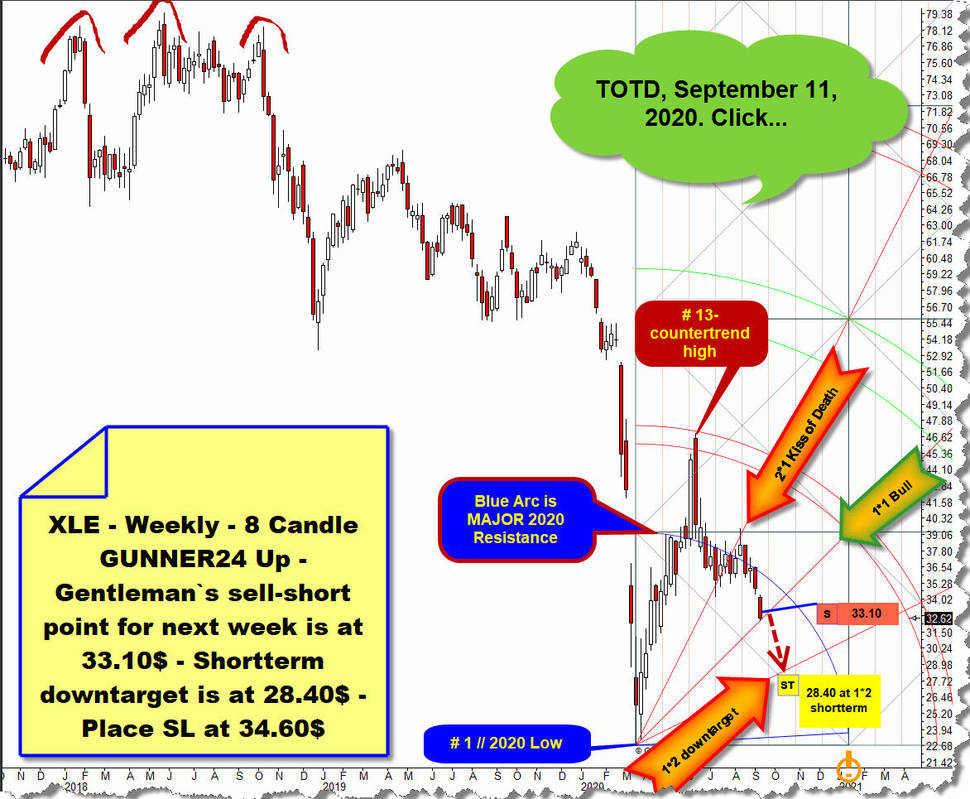
Mainly, we recognized then that the XLE should continue to decline in a more or less straight line from the then 32.62$ to the activated shortterm downtarget of the important 1*2 Downtarget (Gann Angle) within a few weeks, in order to possibly cement a very important higher bull market high there at this natural rising bull market main support. And so it happened.
Next, let's look at the current state of the weekly XLE compared to the still like clockwork running weekly 8 Candle GUNNER24 Up!
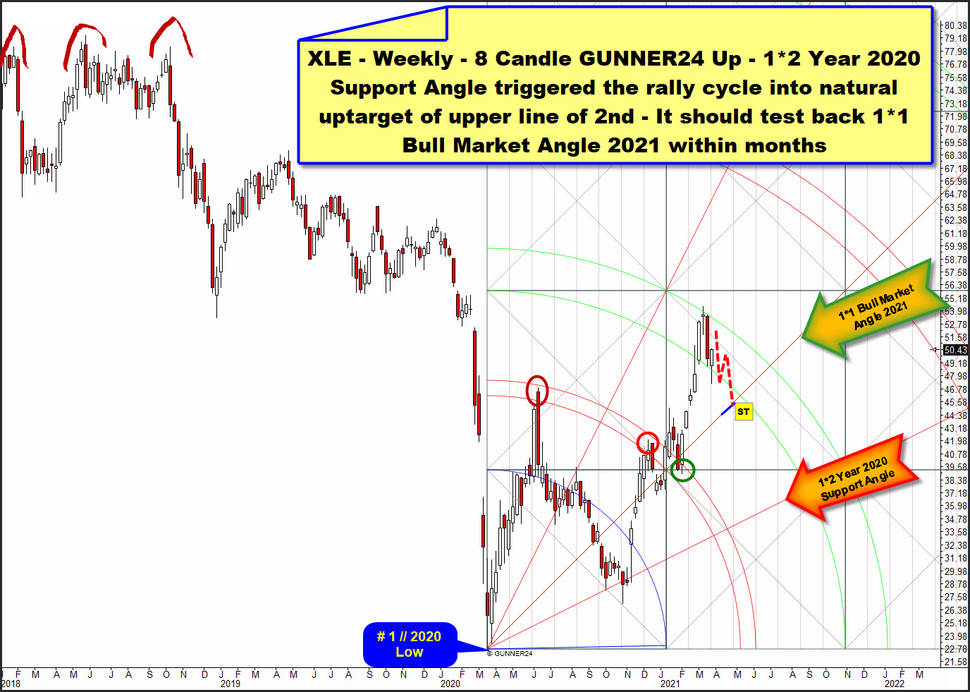
The 1*2 Downtarget Angle was accurately hit and finally worked off at 28.20$ early-October 2020 lows and violated and backtested again at the final October 2020 low what cemented the first important higher low of the at # 1 // 2020 Low started yearslong bull market cycle, what is sustainable countertrend cycle within a secular bear market.
The 1*2 Angle became confirmed rising yearly important Gann Angle support and this yearly support rail triggered the recent bull market cycle that topped so far very accurately at upper line of 2nd double arc what is a natural GUNNER24 Uptarget of the yearslong countertrend. The 1st double arc has been tested (negative as positive) several times in the past. Consequently the now hit 2nd double arc is allowed to act in the same manner.
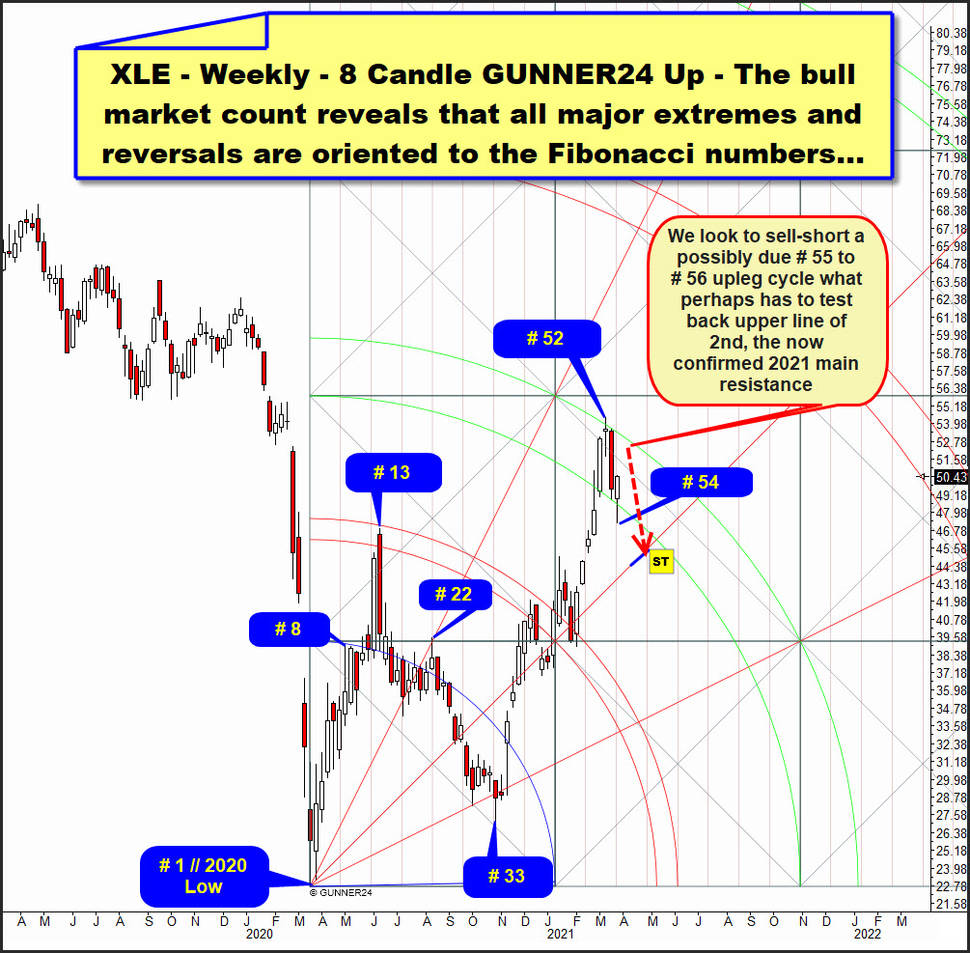
Counting the bull market on a weekly basis reveals that all major extremes and reversals of the yearlong countertrend are oriented to the Fibonacci numbers ...
First we count an 8-week candles initial up impulse. The 13th week of the countertrend cemented a final year high exactly at and influenced by 1st double arc uptarget (then main resistance). 22nd week candle meant an important lower high as it was a textbook „Kiss of Death" at 2*1 Angle/first square line resistance magnet from below. The recent bull cycle started at the low of # 33, what is obviously influenced by the 34 time signal. Now the recent bull run topped at so far 2021 High at high of the # 52-week candle, what of course already shows some distance to the 55 Fib number, but could nevertheless be directly influenced by the potentially important time reversal point of the 55 Fib number!
But in any case, we are able to count that the last major upward cycle starting at the # 33-first important higher bull market low into the current high of the year ran exactly for 20 week candles ...
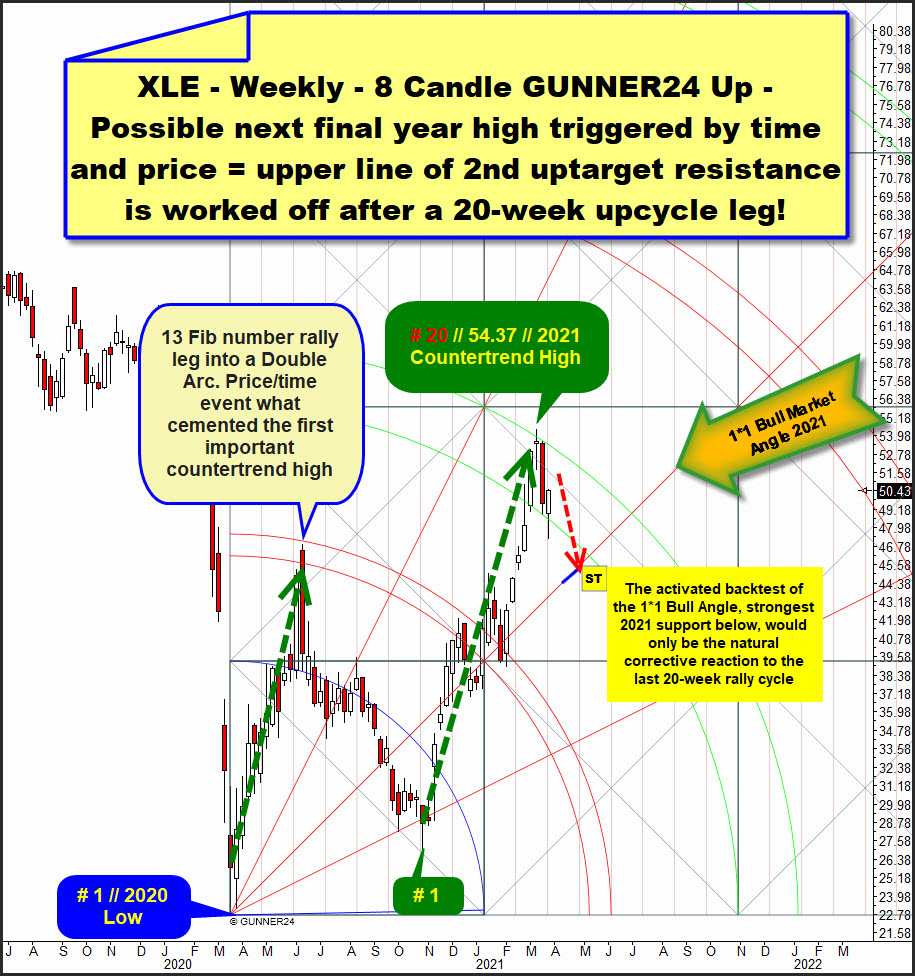
... which probably means that the nice accurate hit of the upper line of 2nd uptarget at 54.37$ after a 20-weeklong uptrend => oriented to the 21 Fib number, maybe has triggered the next important overall countertrend high, as it was the case at # 13-top what cemented the most important countertrend high of 2020 what found natural bear energy starting at 1st natural resistance.
First, the # 13-Fib number/1st double arc uptarget price/time event triggered an important countertrend high, followed by a strong and long downcycle.
And now maybe second the # 21-Fib number/upper line of 2nd price/time event triggered another important countertrend high, usually followed by an at least weaker downcycle which usually should test back the nearest confirmed yearly support and ideal pullback resp. correction cycle downtarget what is the 1*1 Bull Market Angle 2021 out of # 1-final low of 2020.
The upper line of 2nd is now very-confirmed strong future resistance rail because the final high of upcycle week # 21-Fib number with a 100% accuracy found uber-strong bear energy as past week candle is a long bearish candle. Watch also that the lower line of 2nd is now confirmed as past week # 21-low exactly bounced at lower line of 2nd from above and this week close defended the lower line of 2nd double arc support once again.
Both rails of the 2nd double arc are now sharply confirmed! Lower line of 2nd should radiate future support until proven otherwise. Upper line of 2nd now is 2x negative confirmed and therefore a natural future big resistance rail until proven otherwise. And at this future main resistance arc we should place a 1:3-Sell-Short order as it might be tested back quickly in this way:
Watch, that this week candle is No. 54 of bull run what started at # 1 // 2020 Low. Cause the lower line of 2nd radiates bullish energy on weekly closing base this bullish event could trigger the next test of the upper line of 2nd main resistance in course of next week # 55 Fib number to # 56 (56-1=55 Fib number)!
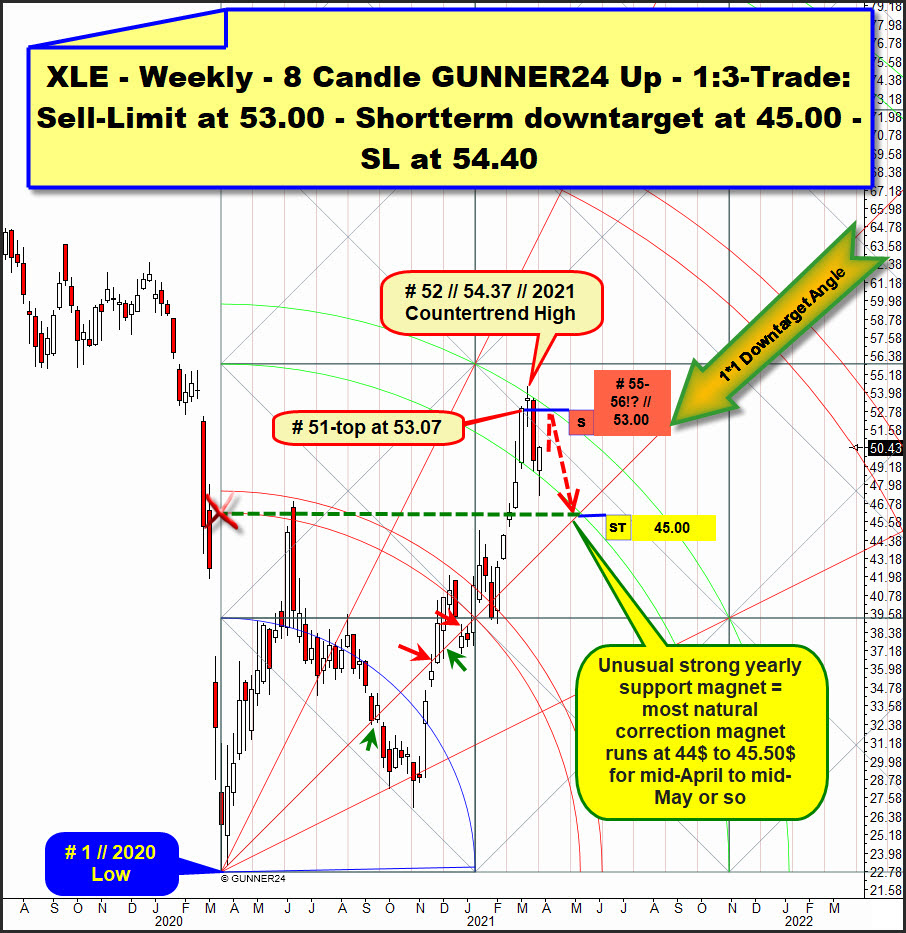
==> OR, the # 55-Fib potential major trend change number could deliver another lower high compared to the # 52-2021 countertrend high at/close to upper line of 2nd surroundings and in such next price/time event case the upper line of 2nd could be the line in the sand what finally ends the topping process on XLE, followed by a straight line drop for the backtest of the unusual strong yearly support magnet = unusual attractive backtest magnet sitting at the 44$ to 45.50$ range for mid-April to mid-May 2021.
We are eager to sell-short the possibly soon due next test of the upper line of 2nd what together with reached # 51-top at 53.07$ forms usually stronger weekly resistance magnet at 53$ for the coming weeks # 55 to # 56 what would mean a next price/time event. And when the price meets the time a change in trend is imminent!
==> GUNNER24 Forecasting Method recommends to place a 1:3-Sell-Limit order at future weekly 53.00$ double resistance magnet! The order should be valid until Friday, April 9th.
==> Shortterm downtarget is the backtest of the weekly 1*1 Bull Market Downtarget Angle. The most strongest support below! The yearly support of the 1*1 Bull Market Downtarget Angle looks to be tested at around 45.00$ within mid-April to mid-May 2021 window!
==> The SL for such XLE-short attempt should be placed at 54.40$!, what is 3 cents above current 2021 High!
GUNNER24 1:3 trade setups are A) adjusted to a longer term, having a spacious stop-loss for the development not to be endangered and B) have to show a risk-reward ratio of more than 1:3.
For this XLE-short attempt the risk is 1.40$. The potential reward is 8.00$. Risk-reward ratio is 1.40/8.00 or 1:5.71!
Brief announcement: because of the long Easter Weekend, the next issue of the free GUNNER24 Forecasts will be mailed again on 04/11/2021.
Be a part of our exclusive sworn GUNNER24 Trader Community – now... I try to make you rich!
- with daily trades – quick, safe and profitable…
- in well-chosen precious metals, commodities, indexes, currencies and in the best trending stocks worldwide...
- in both rising and falling markets…
- with little use of capital…

Click the button below and order the GUNNER24 Trade of the Day - $49.90 US a month.
 |
Be prepared!
Eduard Altmann