
Historically, market panics can be a great chance for low-priced investments. Being a contrarian can be rewarding, but it is often a risky strategy that may take a long period of time to pay off.
Contrarians try to do the opposite of the crowd. They swim against the current and assume the market is usually wrong at both its extreme lows and highs. The more prices swing, the more misguided they believe the rest of the market to be.
And now these contrarians could be on the right path again, according to the rule, "the time to buy is when there's blood in the streets."
The VanEck Vectors Semiconductor ETF (SMH) tracks a market-cap-weighted index of 25 of the largest US-listed Semiconductors Companies and is known as a leading market indicator.
This ever-important metronome of the global economy and the US stock markets may now have bottomed significantly!
I can hardly believe what I recognize on the monthly chart with the help of the most determining GUNNER24 Up Setup!, but first let`s go over the technical charts on weekly and daily base with the support of which we should be able to identify the nearest most attracting upside target of the SMH shares:
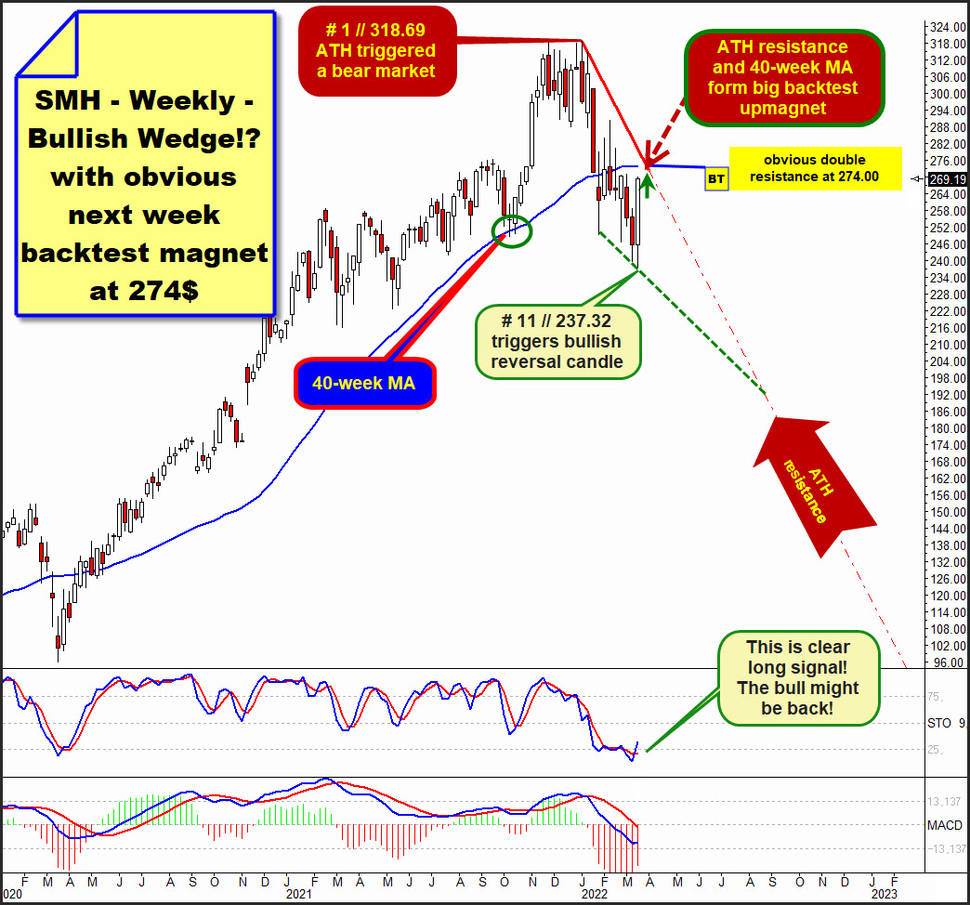
On the weekly chart above we recognize the usually bullish stuff that after the # 1 // 318.69$ alltime-high (ATH) this market LIKELY works on a Falling Wedge, also called a Bullish Wedge.
On Monday at 237.32$ low SMH shares may have established the third confirmation point of a dark-green dotted Bullish Wedge support. There at the low of the week, - = the 11th week of this correction or current bear market cycle (the SMH shares have shown more as a -20% loss since the ATH) -, some fresh bullish energy kicked in.
The week closed near highs and is a bullish reversal candle. Therefore, it seems quite logical that as a result of this, the important backtest magnet of the 40-week MA and the well-confirmed redlined Falling Wedge resistance must be retested quite quickly.
The Falling Wedge resistance of course should radiate ATH resistance = future main resistance energy.
For the coming week candle - which will be the 12th of correction/Bear Market -, the usually very attractive backtest upmagnet of 40-week MA and ATH resistance unite at a 274$ or so.
For coming trading week, this weekly 274.00$ main resistance upmagnet is in near perfect allignment with the two ever-important moving averages on the daily chart:
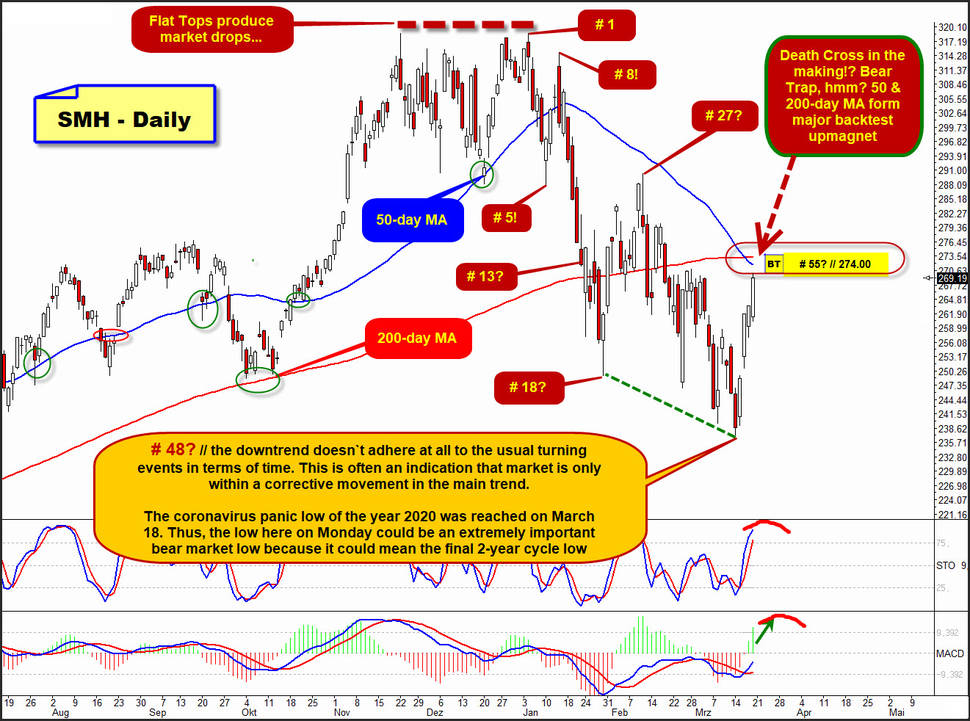
The 50-day MA and the 200-day MA unite also at the 274$ surroundings. It should be concerning for the bulls that the 50-day MA crossed the 200-day MA from above. This is the famous „Death Cross" which the Wall Street is certainly recognizing as well. However, this could have set a bear trap, as you will see below.
Monday, the downtrend/bear market will be at day candle No. 53.
It might be the outcome that SMH shares have to backtest the combined weekly & daily MA upmagnet main resistance around the 55th-Fib number time magnet.
Combined, the bullish MACD and the bullish Slow Stokes point to that next week 274$ main uptarget magnet should be worked off relatively quickly. => And again, an important technical component suggests that the time magnet of 55th-Fib number downtrend day will likely be responsible for ensuring for hitting the 274$ resistance upmagnet.
==> Shortterm uptarget at 274.00$. Next week Wednesday will be the 55th trading day of the downtrend cycle!
Although I have to write that this downtrend cycle/the bear hardly adheres to the usual turning points that time usually dictates. Only for the 1st, 5th, 8th day of the downtrend cycle we recognize important turns, otherwise the downer is not oriented to the Fib numbers of the running sequence at all.
But this can sometimes be an extremely bullish harbinger, as this points to the possible outcome that such downtrends could be irregular ones, so that in the end it could only be a countermovement within the main trend and the main trend is, as we know, a secular bull market.
What could prove insanely bullish, of course, is the fact that Monday`s bearish extreme came pretty much exactly 2 years after the coronavirus-panic low (03/18/2020).
==> Are we witnessing the FINAL 2-year cycle low here made at # 48-low // 237.32$!? Within the range of influence of a possibly underway Falling = Bullish Wedge!?
This can be or might be the final outcome! This also allows this probably very important monthly GUNNER24 Up Setup:
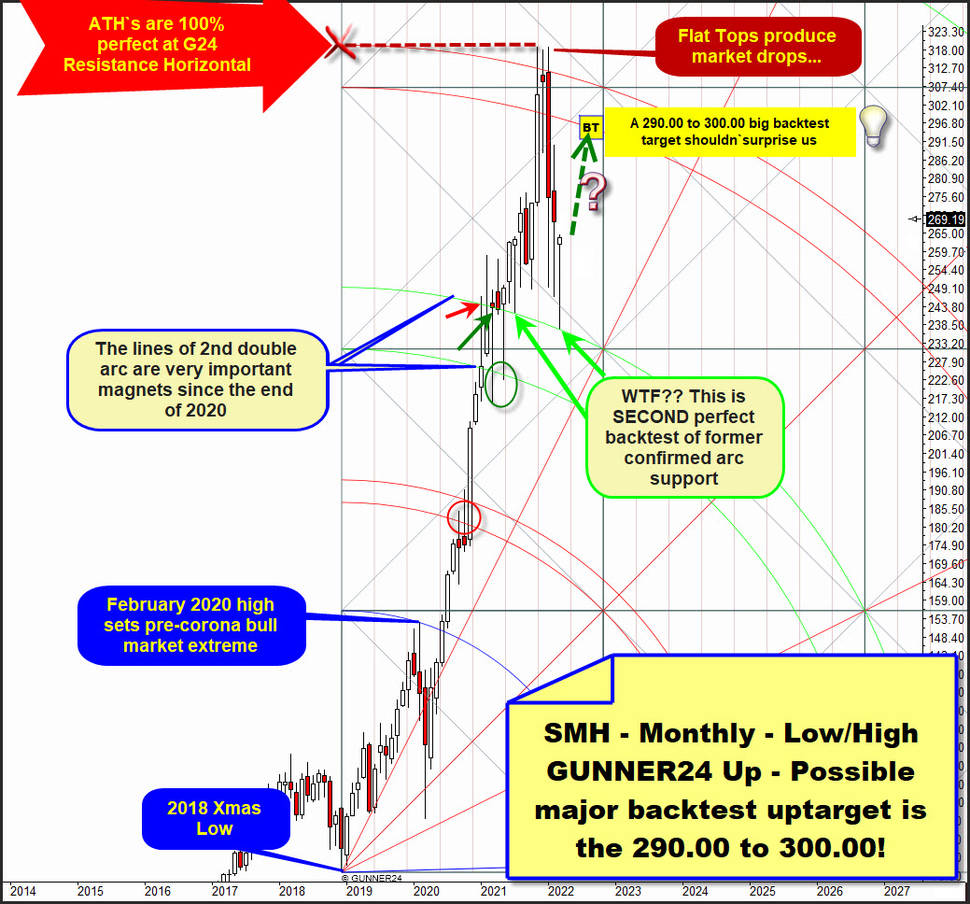
You recognize a so called monthly Low/High up setup. It measures from 2018 Xmas Low to the important high of February 2020 what has set the final pre-corona top (a yearly resistance point). This is the price where the second last >-20% bear market cycle began.
This Blue Arc span has forecasted that 3rd double arc range might become important uptarget for a bull run. The alltime-high (ATH) formed at this natural 3rd double arc bull market uptarget which now represents future main resistance area on life-time base. In the end, the ATH`s arrived with an 100% accuracy at the highest possible price of the upper line of 3rd double arc.
The heavy main resistance of the 3rd double arc triggered the running downer/bear market which on Monday backtested the upper line of 2nd double arc with an 100% accuracy.
Cause this March 2022 candle has a very long tail we know this upper line of 2nd double arc is still able to radiate heavy support power!
The 2 light-green arrows highlight that the recent 100% accurate = textbooklike backtest of the upper line of 2nd from above WAS NOT THE FIRST ONE! This double testing of the upper line of 2nd defines this arc now for the time being as a powerful important future support on monthly low base.
It may radiate even yearly support energy at every next perhaps due test!
I think because of A) this current strong bounce from the now double confirmed upper line of 2nd support, and B) the possibly forming bullish Falling Wedge, and C) the possibly set 2-year-cycle low there is now a nice chance that the Semiconductor`s have ended their corrective cycle.
==> Therefore, SHM shares next might aim the ideal backtest upmagnet resistance of the 3rd double arc showing a possible major backtest uptarget at 290$ up to the round 300$ number magnet maybe!
I would point out in particular the 274$ main resistance backtest magnet; any surviving bears out there do NOT want to see price levels cross above that magnet in further course of March 2022 because then the 290$ to 300$ should normally only be a question of when and not if.
If this natural up target region will be reached, it will then decided whether the Semi`s are strong enough to break this life-time main resistance to the upside or whether the 3rd double arc main resistance area produces an important lower high on yearly base.
Be prepared!
Eduard Altmann