
Do Semi`s smell a positive China tariffs resolution?!
Since emerging from the 2009 Financial Crisis low, the Semiconductors have been one of the market leaders. In doing so, they obviously respected the Parabolic Arc support, light-green shown below in the widely followed monthly PHLX Semiconductor Index lifetime chart:
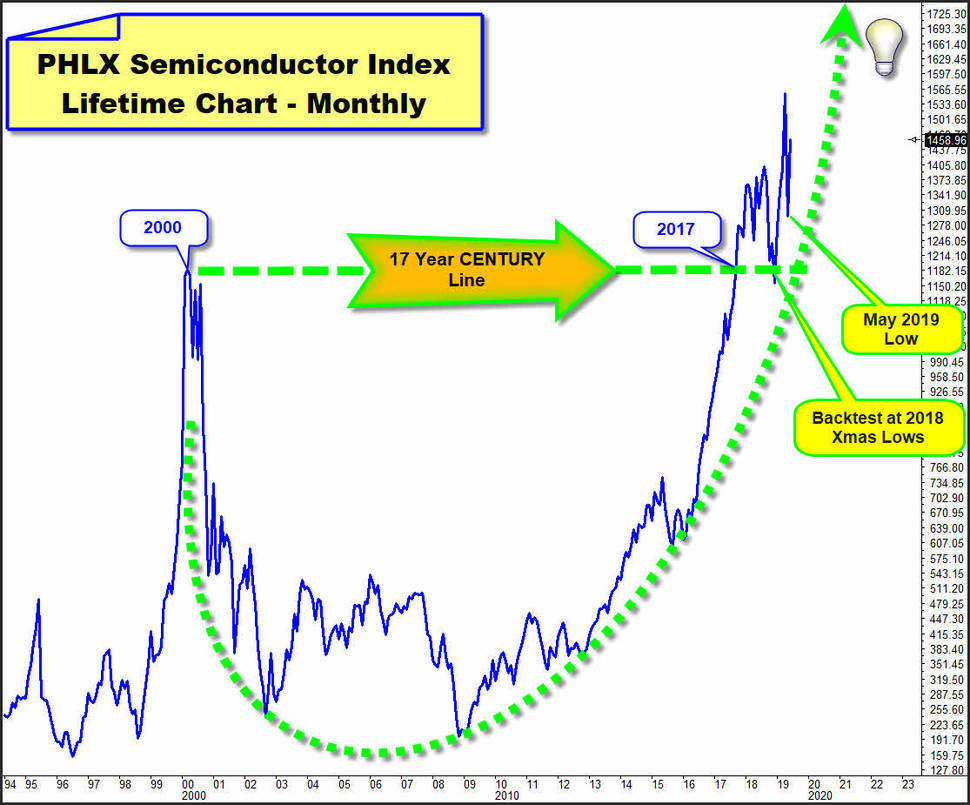
We recognized at how the Semiconductor Stocks broke above their 17 year long CENTURY resistance from the 2000 High until regaining that high in 2017 and after that next major or sustainable buy signal on DECADE base the Semiconductors backtested the 17-year CENTURY rail back in December, 2018.
The initial upward impulse that started at the famous 2018 Xmas cycle lows broke any existing resistance, saw the market making next higher highs on yearly base at April 2019 top, thus confirming a next multi-year long bull market cycle started at very successful backtest of CENTURY support, resp. acquired 2018 Xmas correction lows.
The industry's vulnerability to trade tensions, particularly those involving China, kicked in May when PHLX retraced about -16%, then outperforming the other Tech Indexes losses in a very exaggerated way. Afterwards, the Semi`s have rebounded hard and this is very impressive, bullish action when considering the group usually lags always June, a month where the Semiconductor Stocks typically underperform.
Because this is already a particular conspicuousness, I have looked at the Semi`s regarding possible future developments. And as a result, shipped the following SOXL ETF analysis and trading recommendation to my loyal subscriber base before the stock market open on Friday.
I find the possibilities offered by the Semiconductor Sector on the long side quite exciting, so that I would like to share it with the general public!
SOXL is a 3x leveraged Bull ETF, designed to move three times the price movement of its target index, the PHLX Semiconductor Sector Index!
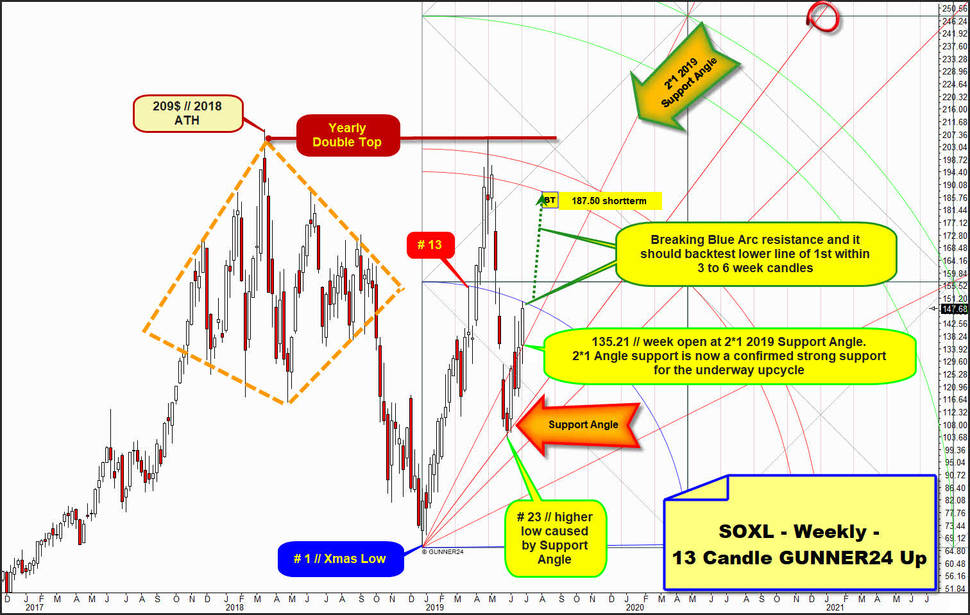
The weekly SOXL candlestick chart shows a Double Top pattern on yearly base with alltime-high (ATH) made at 209$ that arrived 03/13/2018. At 2018 ATH a Diamond pattern formed that resolved downward and as entire market SOXL bottomed finally at # 1 // 2018 Xmas low, afterwards – as other Tech Markets – printing a Double Top on the yearly, monthly and weekly charts.
I have that market now follows at # 1 // Xmas Low anchored weekly 13 Candle up mostly and best. This 13, classic Fib number up impulse, Candle setup is currently most determining according signals, magnets etc.
One proof for this view is that right pillar of yearly Double Top, responsible for current 2019 highs, was obvious successful work off of natural 1st double arc uptarget which presented itself in further course as massive resistance area, which resulted in the deep and fast correction leg, that culminated at mentioned May lows, where at the lows of upcycle weeks # 23 and # 24 the within setup naturally anchorable Support Angle radiated bottoming energy. Support Angle starting at yearly cycle lows forced the market into a first important higher cycle low, from where the current running weekly upward cycle began.
Watch that this week top is 100% accurate test or backtest of Blue Arc from below, whereby Blue Arc represents of course natural and very important circular resistance out of # 13-Fib number top, resp. from the range of the 13 week candles lasting initial up impulse that started at # 1 // Xmas low.
OR: This week high is up-to-day backtest of usually very strong falling resistance which respresents Blue Arc (resistance) actually.
This necessarily implies, for one thing, that if the Blue Arc resistance were overcome on weekly closing base, then another attempt would be activated up to the lower line of 1st double arc magnet - which is always a very important backtest target.
Secondly, it follows that if the Blue Arc resistance leads to a retracement = daily down swing in the next few days, another test of the 2*1 Angle could still be pending.
And we would have to buy such test of 2*1 Angle cause this week candle for sure has re-conquered the 2*1 Angle out of very important Xmas low what is very positive development which clearly suggests that the Blue Arc will probably be overcome in the near future … and thus - usually - a backtest of the lower line of 1st upmagnet in the course of late-July to early-August is pending!
And of course I mean that it should come to a backtest of the lower line of 1st. Otherwise I would not recommend this long-try!
==> Shortterm uptarget is lower line of 1st double backtest resistance upmagnet at 187.50$!
Another weekly GUNNER24 Up Setup which currently has some influence in the development of the new bull market and likely also for the future of the Semi`s is this weekly 5 Candle up that starts measuring at received important # 23-higher 2019 low which in turn is confirmed directly connected to the Xmas Low cause it was exactly at naurally anchorable Support Angle.
Measurement ends at this week high which is allowed technique cause this week high is fully connected to 13 Candle up Blue Arc resistance magnet:
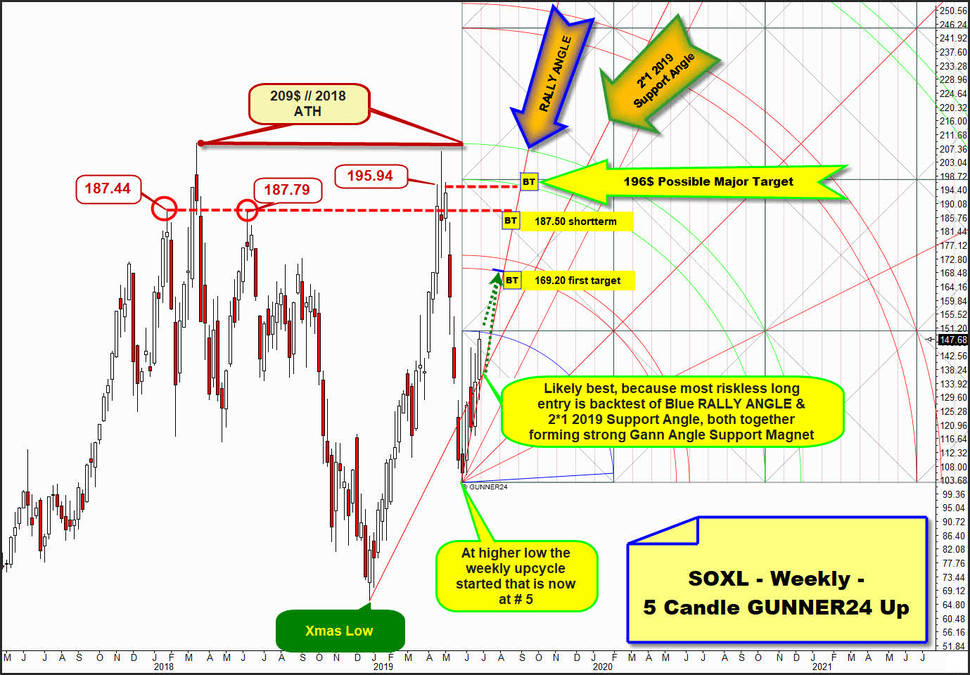
So, when we measure like this, we realize that this imaged 5 week candle up impulse can be directly linked to past important price events.
Of course, the most striking is that the GUNNER24 Horizontal born at intersection point of upper line of 2nd double arc and Xmas Low (time) does exactly match the achieved 209$ all-time high.
Another thing to observe is that the possible major uptarget that is formed by RALLY ANGLE and possible uptarget of lower line of 2nd double arc fits nicely with important former high made at 195.94$.
By the way, plase additionally verify that above carved out 187.50$ shortterm uptarget is in full sync with two very important week highs which have helped to form the 2018 Diamond Top rails. This direct mathematical connection from possibly coming future into seen past is drawn with the lower red-dashed horizontal.
Well, this week high is testing 13 Candle up setup Blue Arc resistance from below. At same time the now running weekly upcycle is at week No. 5. Cause this is a Fibonacci number match, the next week perhaps will be a week that mostly wants to retrace some of June advance and then SOXL could test back 2*1 2019 Support Angle together with now nicely confirmed Blue RALLY ANGLE (support) where this # 5-week opening auction occured.
Perhaps the next week candle likes to test back that very important and usually very strong 2*1 2019 Support Angle/ Blue RALLY ANGLE magnet which runs for next week close to this week opening auction (135.21$) support.
==> COMBINED weekly Support Angle magnet for next week at 135.50$!
IF this week high (150.02$) afterwards would be overcome on weekly closing base lower line of 1st double arc becomes next important uptarget of underway upcycle.
So, very first uptarget for at # 23-low initiated weekly upcycle is 169.20$ cause there and then Blue RALLY ANGLE is intersecting lower line of 1st double arc uptarget magnet!
==> First uptarget at 169.20$! This price upmagnet perhaps is reached at the end of a 8 Fib number candles lasting bounce ===> a 169.20$ test might com true in course of July 15 to 19!
As already mentioned above, the current weekly upcycle might be able to reach a maximum at about 196.00$, there for the month of August the Blue RALLY ANGLE is intersecting the possibly due lower line of 2nd double arc uptarget, thus forming perhaps very attractive future upmagnet which is in nice sync to former received important 2019 high.
==> Big Backtest target at 196.00$! 196.00$ for August 2019 is possible major uptarget of this underway weekly upcycle!
This runner looks like it wants to test back 196$ to 209$ ATH range in a very serious way!!, because of a very unusual volume conspicuousness, I extra highlighted in the last chart of the day:
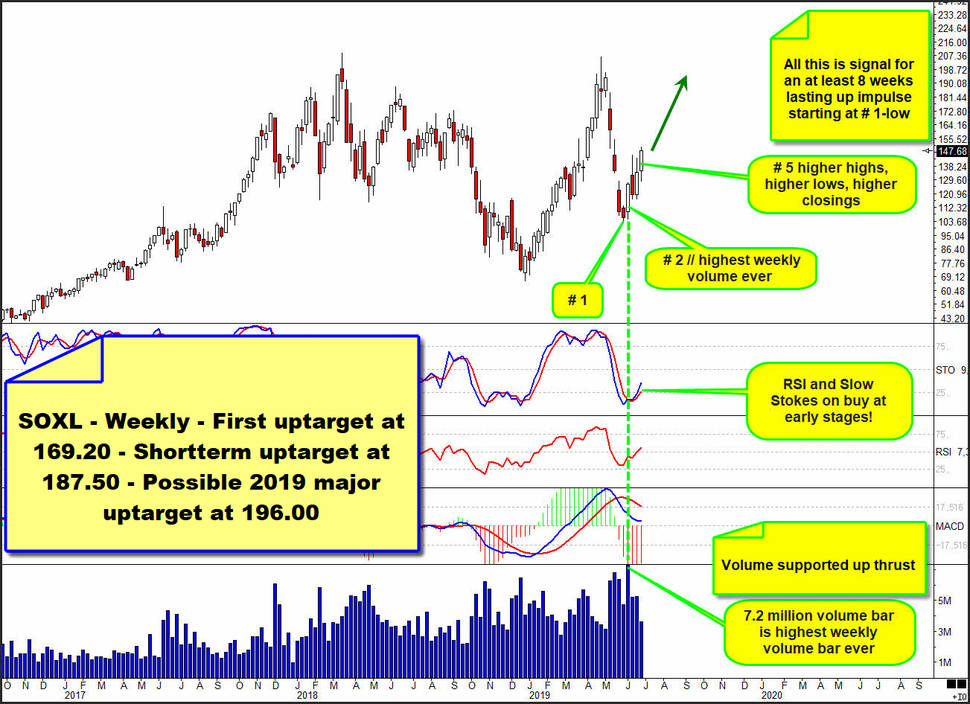
This technical weekly time frame chart shows that the second week (# 2) of at # 1 started weekly upcycle ended with the highest weekly volume bar ever. And that's usually an extraordinary bullish statement. When the Big Boys are buying with both hands at the beginning of a new upcycle cycle...
This is volume supported weekly up thrust in the making, I suppose!, which offers or allows a huuuge and faaast advance according price and time cause the faster weekly momentum oscillators RSI/Slow Stokes just have have triggered buy signals and both together are at early stages of momentum buying.
RSI & Slow Stokes readings do promise that SOXL ETF has at least a 8 week candles lasting upcycle in front!
And all these bullish indicators point to the outcome that the US and China are likely come to a positive trade solution soon!
Market: SOXL ETF
First uptarget at 169.20$.
Shortterm uptarget at 187.50$.
Possible major uptarget at 196.00$.
Be a part of our exclusive sworn GUNNER24 Trader Community – now... I try to make you rich!
- with daily trades – quick, safe and profitable…
- in well-chosen precious metals, commodities, indexes, currencies and in the best stocks worldwide...
- in both rising and falling markets…
- with little use of capital…

Click the button below and order the GUNNER24 Trade of the Day - $49.90 US a month.
 |
Be prepared!
Eduard Altmann