
GUNNER24 Trade of the Day 05/30/2017
The 1:3 Trade: Sell XOP ETF at 35.42
Dear GUNNER24 Traders,
The 1:3 Trade: Sell XOP ETF at 35.42
Our 1:3 trades are A) adjusted to a longer term, having a spacious stop-loss for the development not to be endangered and B) have to show a risk-reward ratio of more than 1:3.
Third try to sell short very weak US Energy Sector
XOP is the SPDR S&P Oil & Gas Exploration & Production ETF and tracks an equal-weighted index of companies in the US oil & gas exploration & production space.
In harmony with XLE ETF (Trade of the Day 05/24) and Chesapeake Energy, CHK (Trade of the Day 05/26) also XOP is in orderly downtrend in daily, weekly and monthly time frames since final 2016 bullish extreme.
XOP finally topped out on 12/12/2016 at 44.97$. The 2016 high was caused by natural GUNNER24 Arc Resistance the "textbook" 8 Fib number up impulse out of 2016 low has forecasted:
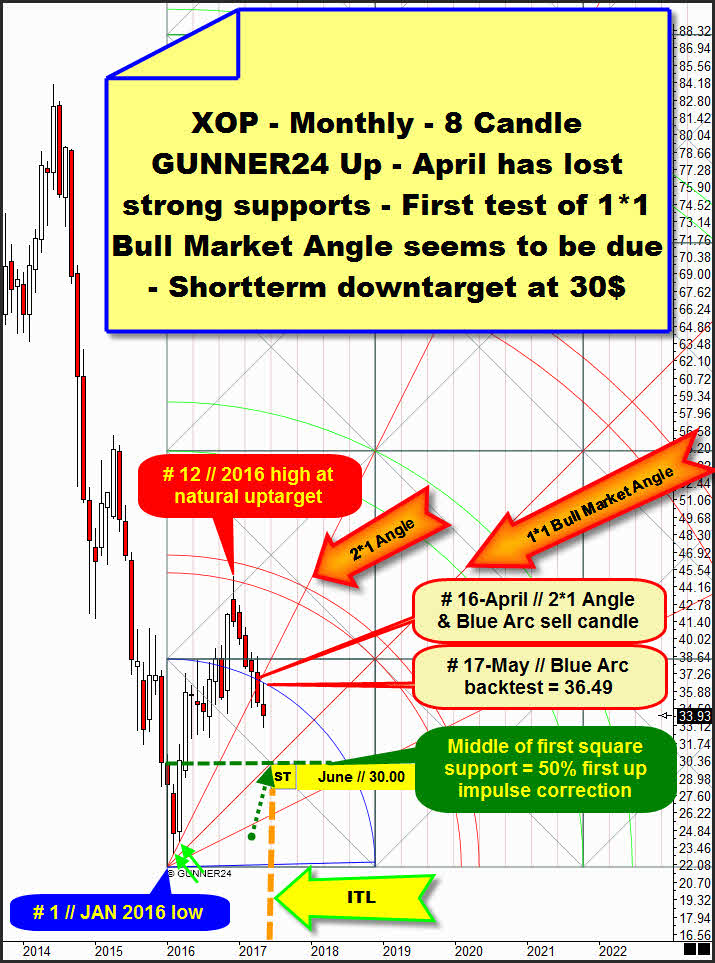
December 2016 was 12th month of uptrend that has started at # 1 // JAN 2016 low. So XOP delivered crystal clear uptrend year 2016, showing low near open and high near close of the year.
The initial up impulse out of # 1 // JAN 2016 low was an 8 Candle up. Top of # 6 and # 8 together form Blue Arc that finally was overcome at November 2016 close. 12th month of uptrend finally topped at lower line of 1st natural monthly uptarget.
January 2017 candle was important reversal candle pointing to lower quotations for the months to come. February 2017 lost first square line support on closing base. First square lines are always most objectives for a bounce that has started at 1st double arcs, and to lose such important natural support at very first attempt was a next harbinger for more downside.
Then the received # 16-April candle close was very strong sell-signal candle. XOP in one go lost 2*1 Angle and Blue Arc support on monthly closing base, activating a test of 1*1 Bull Market Angle in trend direction - trend is down! - within months.
==> # 16-April was a double GUNNER24 Sell Candle in the monthly time frame, fueling the bearish acceleration, activating the very first backtest of 1*1 Bull Market Angle.
==> Cause # 17-May top (36.49$) has tested back Blue Arc to the T from below and XOP was retraced from that now confirmed arc resistance and May candle in the end made next lower downtrend lows, its highly likely that 1*1 Angle test will come true in course of next month or month after next month.
==> We should expect the 1*1 Angle test for June, resp. July 2017, at latest in course of August 2017.
For coming month # 18-June an interesting time/price magnet is existing. Next month candle will trade on important time line (ITL). This ITL - watch fat orange vertical - signals the middle of first square according time. ITL, together with middle of first square price support - watch green dotted horizontal - and 1*1 Angle forms future triple magnet in the monthly scale. A possibly very attracting triple downmagnet stands at 30$ for # 18-June 2017!
==> XOP smells like it will test 1*1 Angle in course of June at/ near "round" 30$ Gann number!
==> Shortterm downtarget for todays 1:3-XOP-sell-short attempt is at 30.00$.
For the elaboration of the XOP-short trigger we switch to weekly scale:
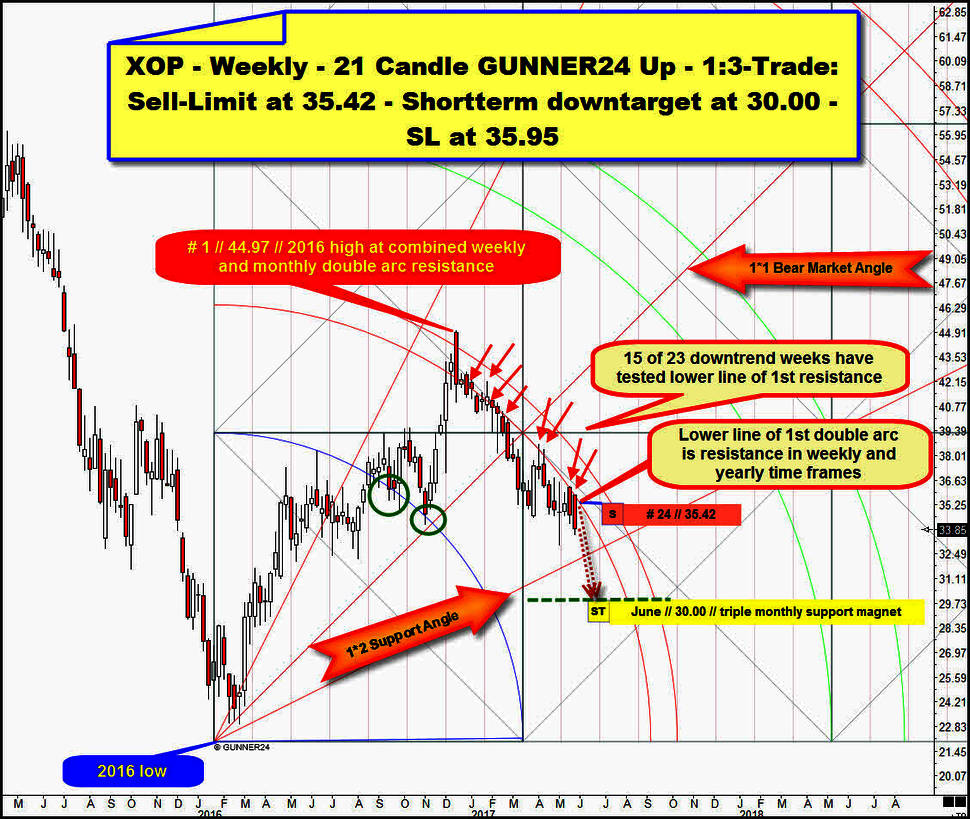
The valid weekly up setup starts at final 2016 low and the "textbook" Fib number 21 initial impulse out of 2016 low has forecasted natural resistance starting at 1st double arc environment. The 2016 high week even has dented the upper line of 1st but this was a bull trap. Since received # 1-2016 top XOP is in downtrend that obviously is oriented to downwards sloping weekly 1st double arc.
The 2016 high at same time found resistance at natural weekly arc up target and at natural monthly arc uptarget. Cause downtrend has started at combined weekly and monthly arc resistance, the 2016 high for sure is very important uptrend high!
Since January 2017, downtrend is fully oriented to the lower line of 1st double arc resistance, which is now sharp defined arc resistance in the weekly and dominating arc resistance in the yearly time frame.
Since start of February, no single week close above lower line of 1st was allowed! Since beginning of February 2017, the lower line of 1st is sharp defined and very strong week high & week closing base resistance. Downtrend - which is at week No. 24 when we take current week into account - has tested overall 1st resistance environment at 15 occasions negatively. Past week # 23 and the previous one # 22 have tested falling lower line of 1st to the T at their respective lower week highs.
==> If current downtrend week # 24 wants to test lower line of 1st, we sell there at 35.42$.
==> 1:3-XOP-Sell-Short limit at 35.42$! Sell-Short limit order is valid till this week Friday, 2nd of June 2017!
According W.D Gann`s angle rules current downtrend should at least continue till 1*2 Support Angle is tested, reached and worked off! This important natural angle support out of 2016 low is activated Gann Angle downtarget after 1*1 Angle was finally broken to the downside in course of February. So additionally weekly time frame signals that downtrend lows are not in!
I expect 1*2 Support Angle not to hold on weekly closing base within underway downtrend cycle cause monthly magnets/targets almost always overrule weekly magnets/targets!
==> Shortterm downtarget is the 30.00$ triple monthly support magnet!
==> Please place the SL for the XOP-short attempt at 35.95$!
Risk = 0.53$. Potential reward = 5.42$. Risk-reward ratio 0.53/5.42 or 1:10.23
GUNNER24 Trade of the Day orders for 05/30/2017:
Market: SPDR S&P Oil & Gas Exploration & Production ETF (XOP)
Orders: Sell-Limit at 35.42. Stop-Loss (SL) at 35.95. Shortterm downtarget is 30.00. Sell-Limit order valid till 06/02/2017.
Eduard
========================================
Markets, Money Management and Trade Size
I will merely analyze the market. There are so many instruments in the world outside our GUNNNER24 Traders use to trade, and hundreds of popular ones among them, often depending on a trader’s time horizons... I don’t consider me able to adjust the market recommendations to all the popular ETFs, different CFD or futures contracts. All I’ll analyze is pure market action - the index, stock or most current contract and forex!
The trade size you should use depends.
A) On your account size:
I usually follow the rule of thumb which says, never bet more than 1% of your account size for each trade. So I avoid overtrading...
Let’s say you have got a 30.000US$ account granting you a nominal buying power of 300.000US$ up to 500.000USUS$ and even more, depending on your broker and instrument. In that case your trade size shouldn’t be more than 3.000US$-5.000US$ taking into account your buying power.
Another - more conservative - method is taking into account the available margin. Usually, 30.000US$ account value equals 30.000US$ available for margin trading. So the trade size is 300US$ taking into account the margin.
Within Trade of the Day I ask you not to bet more than this 1% per any trade.
The other point to consider for determining the trade size is:
B) if your trading style is rather active, supposing you regularly have 30-50 open trades, just as I have - CFD/ETF, here some stocks, there a future contract. So I often trade risky somehow, but I split the money/bets. Even in such a nice trend as the stocks are showing currently, I never ever trade too risky. I never load the boat with 70% let 90% of my account size. 50% is the maximum.
I trade for my living and for my kids and wife as well. A regular income is important. The big-bang bet isn’t! The market would win such a big-bang bet for sure!!
When I have a lot of open trades, maybe up to this 50% of my account size/available margin I avoid trading more. So if you are an active trader having a lot of trades running at rev limiter (50% account size) please avoid trading even though we/I give you some fresh recommendations, because this would rise YOUR risk!... During the test phase that happened frequently. We had 3-5 open trades sometimes and that’s why it’s elementary important that we/you have to use tight SL. Order management is absolutely crucial for Trade of the Day.
You’ll have to place really each and every order accordingly, you know. Forgetting only one time the SL would make this trade getting worse and worse…
========================================
Based on the George Douglas Taylor Trading Technique that I’ve been studied and originally traded for years transferring it onto the modern markets by constant observation a five day pattern of the single days of the week has resulted.
The crux is not so much that the entire week has to work perfectly. Perhaps it does just at a 50% because the day patterns may shift by one or two days. In the strong upwards trends sometimes you see 4 buy days and only 1 sell day. It’s important to recognize that the day proceeds ideally-typically and to trade accordingly.
My personal trading style has always been the contrary to that of the crowds because the crowds always loose. Especially in gold and silver trading I like to buy the corrections Monday to Wednesday and on Friday if the day patterns correspond with some important GUNNER24 Signals.
I use to go short intraday just on Thursday when the week high is sold off AND provided that the corresponding GUNNER24 Setups signal so covering the shorts when the cycle is resumed.
The ideal five day pattern in an upwards trend – precious metals and US stock market – Do use those patterns for your intraday and swing activities!
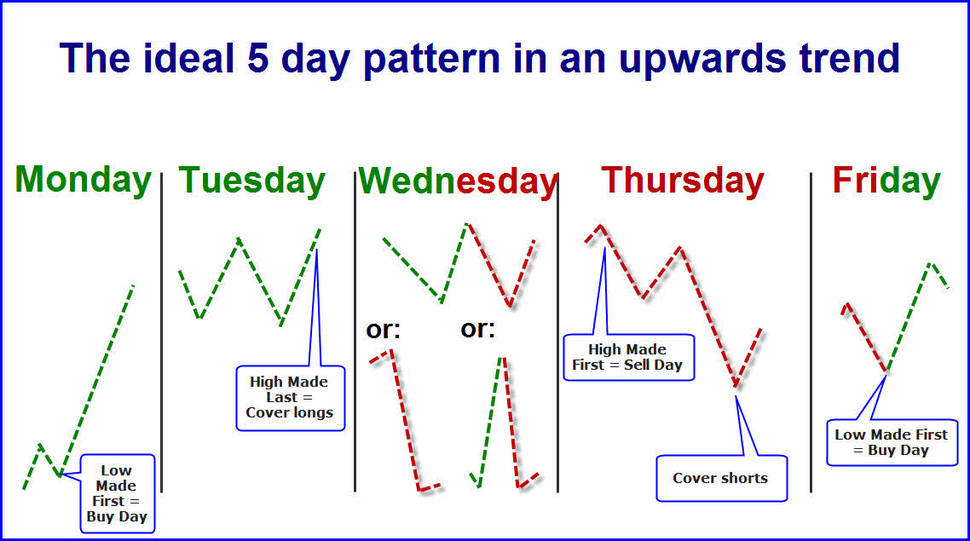
Monday: Buy day. Strong up-day. Low established first. It often ends at the day high. Unthinkingly you may buy all the intraday corrections because the week high comes later in the course of the week.
Tuesday: Buy day. Weaker up-day. A higher high is produced. As early as now the crowds ponder whether the prices mightn’t run too high partially going short already. For me it’s the day when I can cover my Friday and Monday longs. In intraday I try to go long in case of corrections until the Comex opening.
Wednesday: Sell day. Actually the day for covering the longs and for the first short entry. It’s got some different forms. It closes at the same level as it had opened. Frequently at first the high is established because more and more traders short the market. Here the longs fight against the shorts. You recognize that if many teeth, many nicks, many spike candles are to be seen in the chart. On Wednesday I use to do nothing. Only at a 20 to 30% the shorter hearts are pleased because during the whole day there’s only sell-off.
Thursday: The classical sell short day. Because the Wednesdays often close as they had opened the market participants have to cover their shorts because in the beginning the market runs quickly upwards…! And frequently they turn their positions into the high direction being caught on the wrong trail again. Then the market often lays down a beautiful sell-off. In the evening mostly a strong rally follows. That’s where we cover the shorts.
Friday: Classical buy day in the upwards trend. It’s nothing for weak hands. Here’s where you buy the positions near the Thursday lows which you cover again next Tuesday/Wednesday. If you discover that the prices have steadied or even are rising a little bit by closing the five day cycle should continue in the following week.
In the charts we work with the following symbols:
========================================