
A reader asked me that question on Friday, just before the day low. It depends on the angle of view, I thought to myself.
In spite of the fact that Friday was a triple witching day it held out extremely well over the whole week. I can remember some expiration weeks when gold and silver were beaten down over the whole period. That kind of tendencies was to be seen but partially these days; the intraday rebounds from the day lows on Thursday and Friday were pretty convincing.
Considering the drop in prices from the all-time high of 12/07/2010 until the Thursday low the correction by a five percent doesn’t go beyond the scope of the ordinary anyway, but it rather seems to be a normal correction so far. The monthly GUNNER24 Up Setups do not indicate any grave correction. They are completely at buy.
But we’ll have to consider the seasonality as well, and a glance to last year, to 2009, will do to reply our reader’s question saying yes…, maybe…. The last all-time high in 2009 was marked on 12/03, you see. Then a correction through 02/05/2010 followed. Gold fell from 1227 to the February lows (1044). That was about a 15%.
As early as last week I gave to understand that there’s something fishy going on in the current gold correction and you should even up at least your short term longs. Well, the price course of last week has clouded the picture of that correction a little more:
Daily 2 Candle GUNNER24 Up:
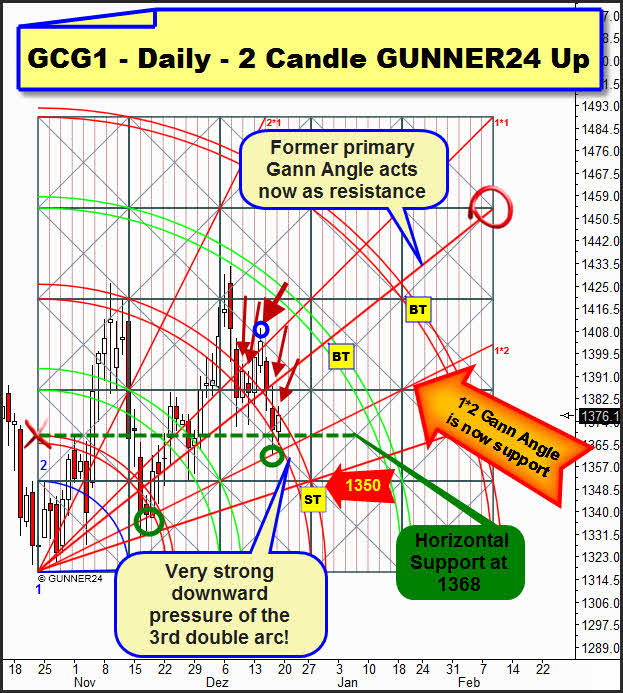
As analyzed last week already the 3rd double arc has got a tremendous influence on the price, it pulls it down, and gold has lost its fight against the setup-anchored Gann Angle after all. After having produced support for several weeks on Thursday it broke unequivocally. Now, at the 1*2 Gann Angle gold got a grip on itself again. And with the Thursday low it MIGHT have marked an important low cause that’s where the price touched the Gann Angle.
The first two days of next week should give us the information whether gold will be able to leave the negative influence of the 3rd double arc. The 1350 will be reached rapidly if on Monday or Tuesday the 1*2 breaks. In that case it would be obvious that the bearish influence of the 3rd double arc will reach until the last trading day in 2010.
It’s furthermore apparent that at best we may rather expect a classical sideways move for the coming weeks without being any new highs to be seen any more. The buy targets thrown up by the setup are 1402 and 1422, less than the 1432.50.
Above at the all-time high we’ll apply a 2 Candle GUNNER24 Down Setup now. We can gain a better feeling for the current correction by that technique thus being able to decide whether on Monday/Tuesday the said 3rd double arc will be broken upwards.
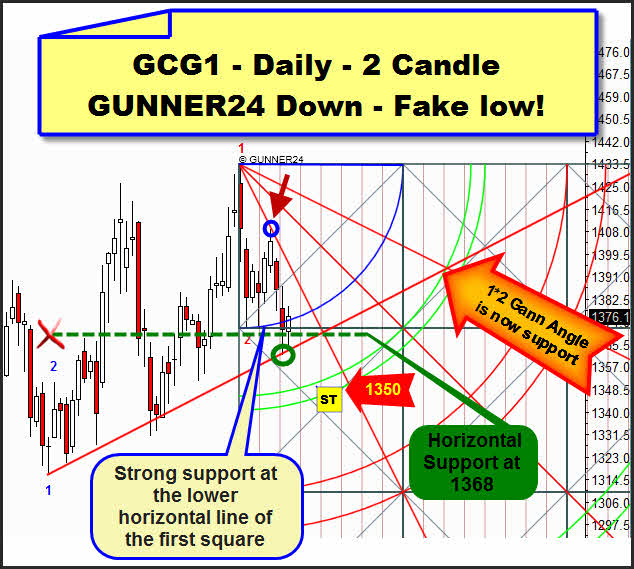
I copied out the important marks of the up setup (support horizontal at 1368 and 1*2 Gann Angle) into this one for you!
The blue circle shows you that this 2 Candle Down Setup is absolutely valid. Exactly at the important 2*1 Gann Angle is where on Tuesday the rebound downwards took place. On Friday gold escaped into the first square re-conquering the blue arc (positive), but marking a fake low. Still the lower limit of the first square is resisting, but the fake low enables gold to test again this lower horizontal of the first square later on or to break through it downwards definitely. If the Thursday low breaks on Monday/Tuesday the first sell target will be the 1350.
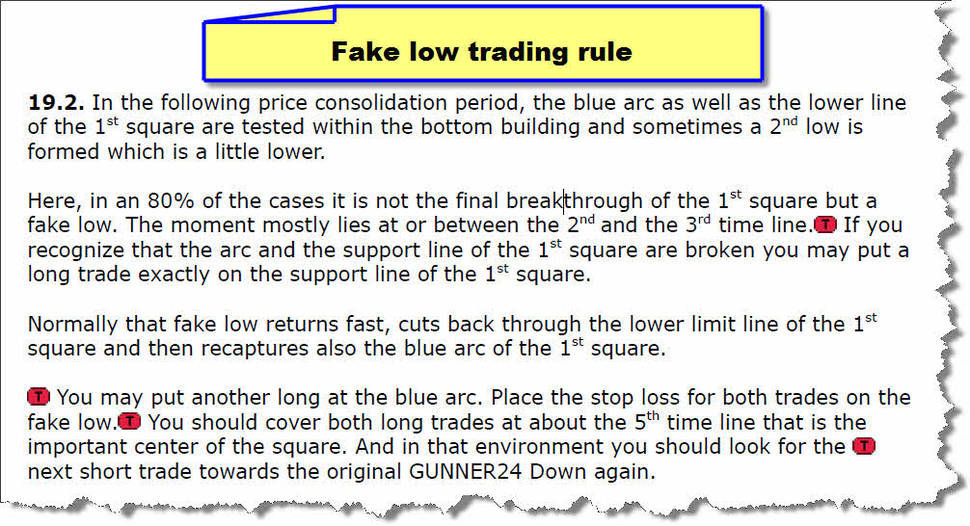
Due to the rule number 19.2 one of the coming days gold should run up on account of the fake low (an 80% of probability). In both setups we can make out the great support at the week low. In the Complete GUNNER24 Trading and Forecasting Course from page 36 onwards you may read up which way to trade the fake low:
Silver is backing gold. No, it’s even extraordinarily strong considering that a longer lasting sideways move might be waiting for gold.
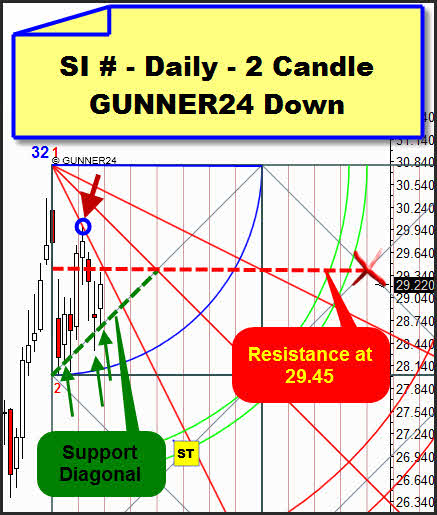
The angle of view to the silver correction is showing that this daily 2 Candle GUNNER24 Down Setup is valid, too (blue circle). As well as the little gold rebound on Tuesday silver rebounded downwards at the 2*1 Gann Angle. But at the green dotted diagonal it defined a perceptible support. Friday was strong – a positive sign.
Monday/Tuesday is going to indicate the direction here, too. 29.45 is the mark to overcome. At opening a test of those 29.45 is to be expected. If they are overcome the 1*1 Gann Angle at 29.90-30 will be the first up target. That’s where silver should turn downwards again to test again the support diagonal.
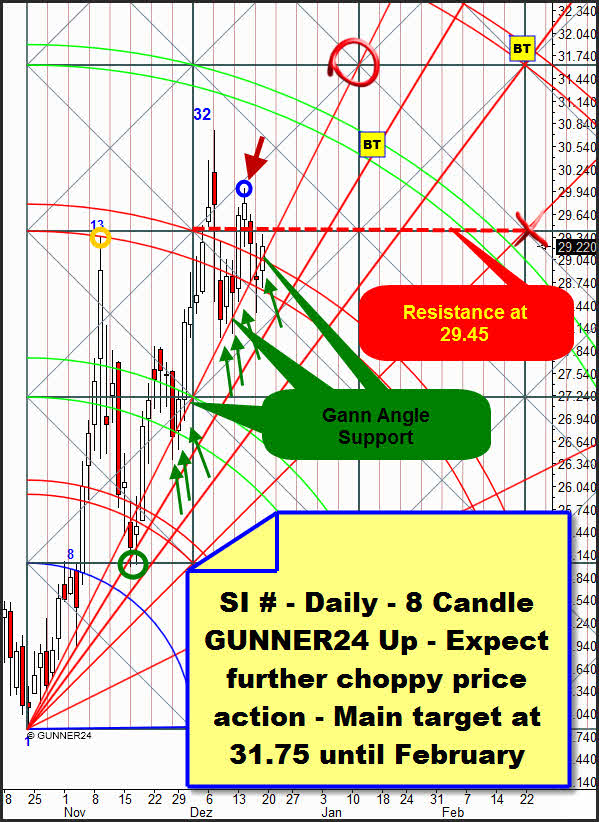
In the actual 8 Candle GUNNER24 Up we can make out that in silver the upwards power is rather dominating. The blue and the green circles show that this setup is valid. Some important setup guidelines are re-enacted by the price. Some important price and time magnets are called at forcing a change in price direction.
Perceptible is the dominance of the primary Gann Angle which seemed to be broken on Thursday but was re-conquered on Friday (all the same it’s not yet broken upwards definitely!) – remarkably happening on an expiration day! Likewise obvious is that the market is moving around the main target, the 3rd double arc. But, considering the price comportment of the last two days that one has rather turned out to be a support. It seems to resist or it was even re-conquered, respectively. In both the 2 Candle GUNNER24 Down and this setup we can work out the 29.45 as to be a resistance. Its importance is emphasized by the fact that the resistance is to be seen in both setups. They might play a part during the whole next week and do us a good turn for intraday trading.
Experience has shown that the region between the 3rd and the 4th double arcs is always good for choppy price action. In the case of silver to reach the monthly target of 31.05 is still pending. About that pay attention to the analysis within the GUNNER24 Forecasts of 12/05/2010. In the 8 Candle GUNNER24 Up that mark is corresponding to the 4th double arc. In the final analysis it’s only one very strong day apart.
Conclusion: You see, next week again it should go to and fro. On the one hand parallel to the Up Setups which have been dominating for a long time now there are some down setups disturbing the upwards trend, on the other hand in their respective setups the precious metals are in the pretty choppy area between the 3rd and the 4th double arcs.
It’s important for your trading to consider gold and silver always parallel, silver being the clock, but new highs in silver don’t mean automatically new highs in gold as well. But a weaker silver performance should result in more weakness in gold. Daily long engagements continue not being advisable, a long term correction on daily basis is too likely.
To the US stock markets:
The gold and silver analysis above was really fun, I enjoyed very much to combine and to work out the trading plan for next week. In the US stock markets it seems to make more sense watching the softly falling snow to detect something interesting…
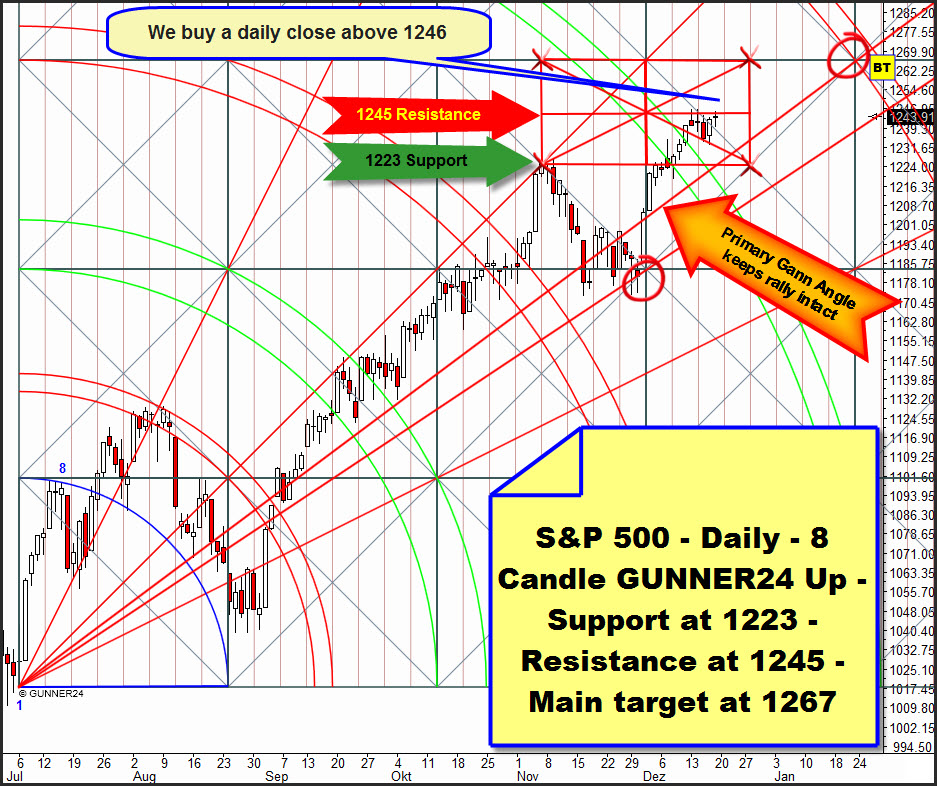
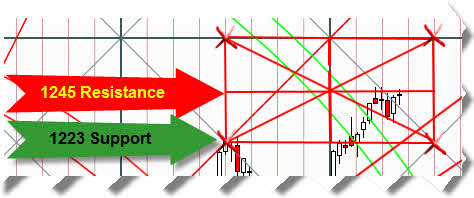
So I sketched in something for you. For with the GUNNER24 Forecasting Software you can sub-divide the individual squares. Here, by the line function I just constructed some other little squares and a bigger rectangle and four little rectangles which make further diagonal and horizontal supports and resistances visible:
We see that the 1245 is producing resistance. We will use a closing price of more than 1245 for a long entry with target 1267. For a deeper S&P 500 analysis please see the last issue.
NASDAQ-100 Daily:
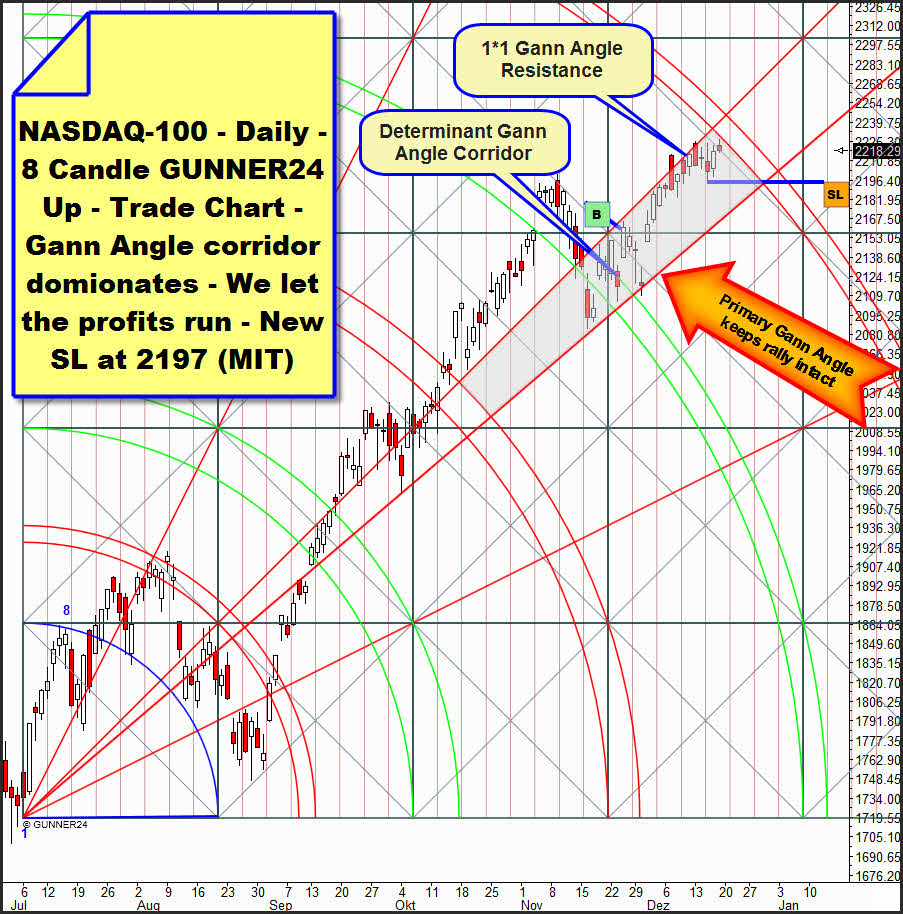
Having a look at the analysis of last week nothing has changed in the NASDAQ-100. The market is going on orienting itself by the Gann Angle corridor but it can’t break it upwards. Nor it’s producing any other correction. We are still sitting on our long positions since the aimed 2234 have not been reached.
Now the market has approached the main target for the entire uptrend on daily basis but it hasn’t touched the 5th double arc. We will go on observing whether there’ll be a little more action in the market at reaching the main target. I suppose we’ll see at least a little correction (two days) but late on Tuesday we may rather expect furthermore higher prices on account of the seasonality. That’s why in contrast to last week analysis we are not going to cover at 2234, we’ll let the profits run.
We’ll lift our SL to 2197 (MIT), and we’ll go long with another position if the 5th double arc is broken definitely. We speculate on the weekly target taking effect at 2257.
Be prepared!
Eduard Altmann