
By its 1772.28 low the S&P 500 and by its 15703.79 low the Dow Jones worked off their respective objectives in price as well as time last Thursday being the 10th day of the correction or the 9th day counting one day after the Thanksgiving high of 11/29 as the correction start. The traditional X-mas rally can go off now from the current levels. Targets are the current 2013 highs. Merely theoretically it can. For the forecast requires a definite confirmation as it uses to do actually evermore.
Gold and silver, too, may start now a several week countertrend on since last week some important supports on monthly and weekly base were maintained, last Friday being some important resistances on weekly base re-conquered that are giving rise now that the worst is overcome – for the time being! Something more on the expected counter-moves incl. time- and price-targets are to be read in the 2nd half of this Sunday’s issue.
Let’s open with the US stock markets. For the beginning let’s consider the daily time frame and then the medium-term weekly time frame.
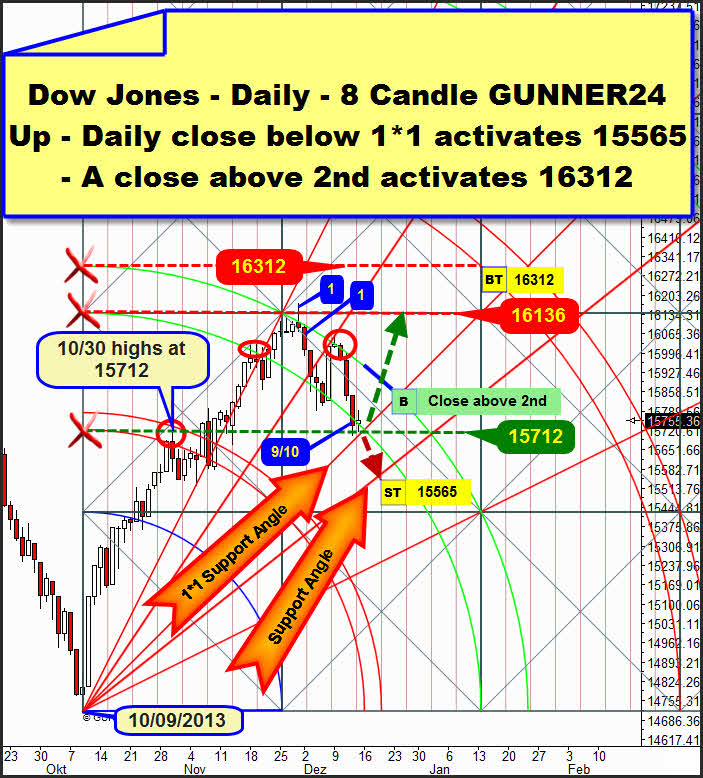
Dow Jones, daily 8 Candle GUNNER24 Up:
So far, only the traders of our member area have been familiar with this setup. Now I decided to place it at the disposal of all the traders. For this setup depicts the clearest way the state and course of the current correction as well as the important buy- and sell-triggers on daily base.
It starts an 8 day initial impulse at the low of 10/09. The first impulse drawn in this setup is a little bit difficult to identify because from the absolute low of 10/09 up to the high of the first up-wave (10/30) hardly any considerable pause is to be made out, but just some days of consolidation.
The first rest day with a lower daily high after the 10/09 low was the 5th day of the initial impulse. The second rest day of the initial impulse followed at the 9th day of the up-move. Before that, the 8th day of the initial impulse, there was (of course!) another initial-impulse high. Since 8 is a higher Fib number than 5, we utilize this higher Fib number to measure the initial impulse. It’s also nice to see, and as it were our encouragement for using the 8 day impulse that the Blue Arc beside the high of the 8th day also measures up the high of the 9th day accurately.
Let’s see the course of the correction now. We recognize that the current correction is a clearly regular one since the correction is following downwards the 2nd double arc within both lines, I mean "extremely regulated". From above, the upper line of the 2nd is stopping the price and from below the lower line of the 2nd supporting the price. At the upper line of the 2nd the Thanksgiving high was brought in on 11/29. The 11/29 closing is exactly at the upper line of the 2nd = resistance.
The days before and the day after the Thanksgiving high each, touch the upper line of the 2nd rebounding from there. The market respects the upper line of the 2nd as to be the ruling resistance. Well, a daily close above the upper line of the 2nd will have overcome the upper line of the 2nd being the next buy signal on daily base! With a probability of more than a 75% the 3rd double arc will be headed for in trend direction then = 16312 till the middle of January 2014!
Let’s have a look at the current correction of last Thursday now. As mentioned initially and depending on the way of counting it’s the 9th or the 10th day of the correction respectively. Just pretty narrowly the Thursday low fell below the horizontal support that started from the upper line of the first being at 15712. Friday produced a higher daily low.
At the low, both days – Thursday and Friday – traded narrowly above the 1*1 Support Angle not having touched it yet (so far?!?). You know, the 1*1 always divides the setup into the bullish and the bearish half. Until now the Dow is completely in the solid uptrend area. So to speak, the correction is testing the 1*1 Angle at the lows. And maybe it would really take a touch with the 1*1 Angle on Monday to release the start of the X-mas rally. It might trigger the required rebound-energy to break finally the upper line of the 2nd resistance upwards!
The short-trade is also pretty simply to identify. If the market closes clearly below the 1*1 on Monday or Tuesday (daily close below 15690) the correction will go further down to the next lower important Support Angle = 15565!
If the market generates this sell signal during the coming two days being reached the 15565, the X-mas rally shouldn’t start before that level. Year-end target in that case would be 15850-15900!
As the Dow Jones reached its long-term 1*1 Angle in the daily, the S&P 500 did in the weekly setup with the correction lows:
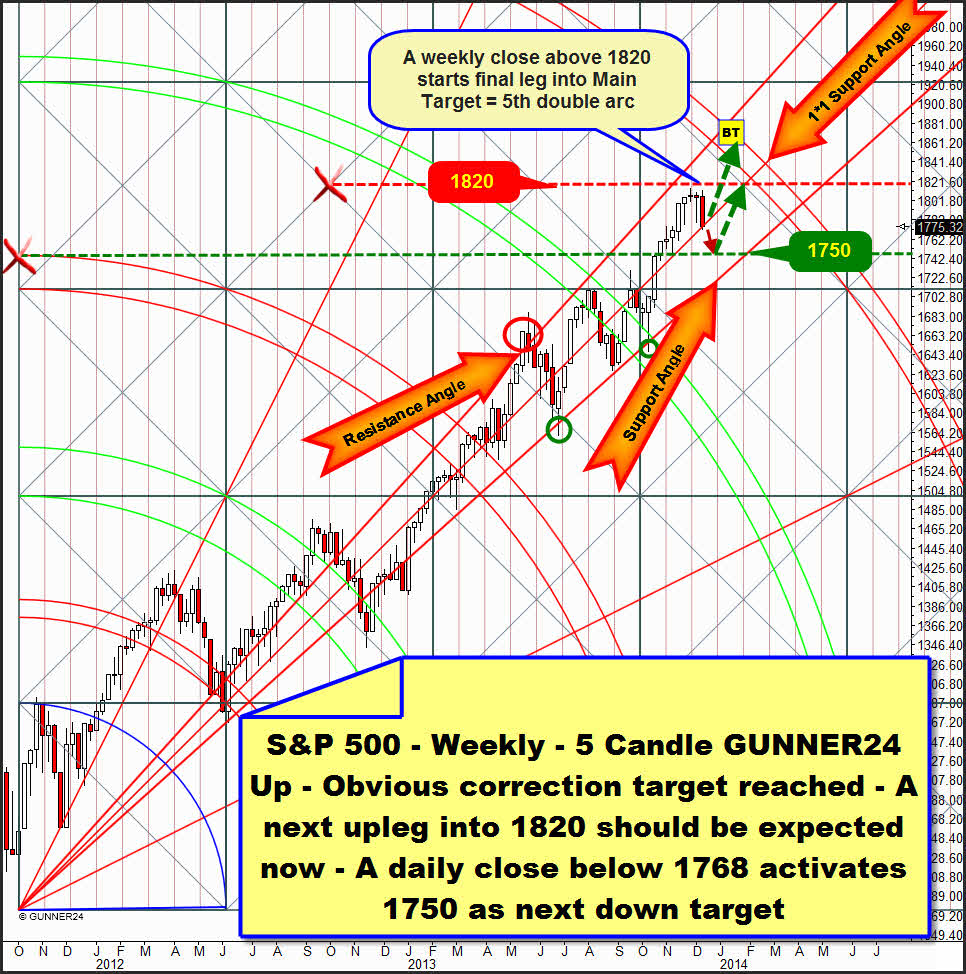
The touch with the 1*1 was an important objective price- and time-target that was identified last Sunday. The 1*1 is at 1773. In mathematical terms the current correction low (1772.28) fell short of it just narrowly. Optically it’s a touchdown. If we watch the seasonality aspects or the traditional X-mas rally at the back of our mind, technically the market would be likely to turn up again now!
On the other hand I can remember some incidents in the course of the last 20 years when I thought that the X-mas rally would be omitted or I was wondering about uncommon deep and not rule-compliant corrections before the start of the X-mas rally. But usually that used to be matter of shaking the weak hands out of the markets! For the period from mid-December to the beginning/middle of January is ALWAYS and also in the post- and inter-election years shaped by extremely strong price rises/rallies.
Concluding I can diagnose that I wouldn’t really be astonished about a dip down to the next lower Gann Angle Support at 1750 during the coming 3-4 days. A daily close below 1768 on Monday or Tuesday will activate this target before from there the rally to one of the January exhaustion-targets will have to start. The January exhaustion-targets keep being at 1854/1864/1880/1888! In this context pay attention to the important analysis on the derivation of these targets of 11/17/2013.
A daily close above 1791 during the next 5 trading days will activate the weekly 1820 resistance that is likely to be reached till year-end in that case.
In gold and silver, some pre-conditions for a lasting countertrend move in the weekly time frame are fulfilled now.
If these counter moves are confirmed by the movements of next week, the countertrends might last at least 3, but rather 5-7 weeks or maybe even 10 weeks. Maximum price targets are the 1450$ and the 26.50$ surroundings, respectively.
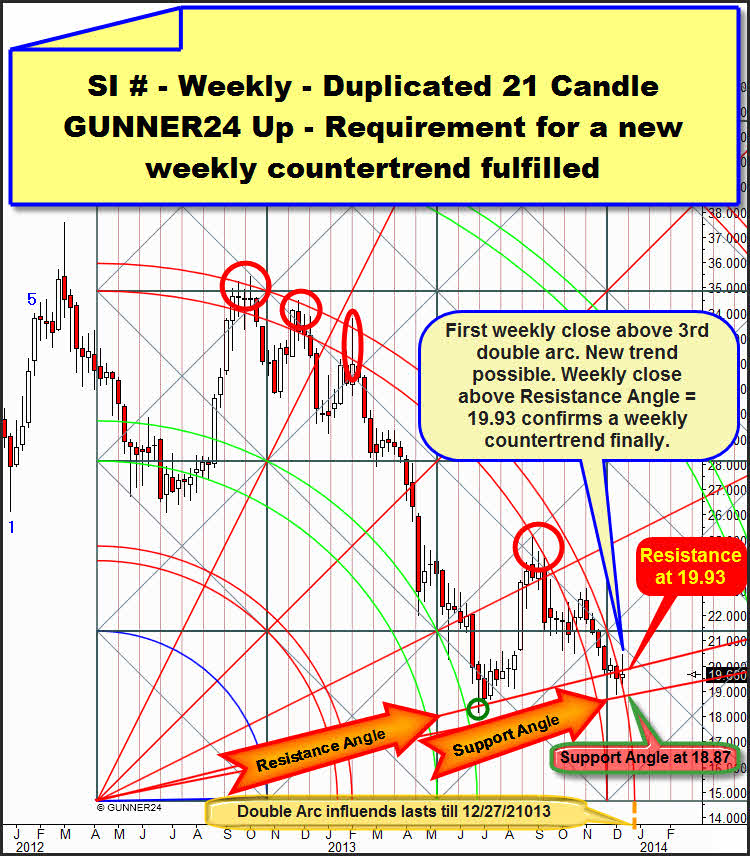
The currently most important GUNNER24 Setup in the precious-metal field is the duplicated 21 candle up in silver in the weekly time frame. Again and again, I consult it as a timing advisor. Its complex derivation can be gathered from this issue. Also last week I analyzed it intensely. As expected somehow last Sunday now it is indicating the end of the decline and the beginning of a new trend. But silver will still have to confirm unambiguously this counter-move in the longterm downtrend next week. It will have to with a weekly close above 19.93:
Before I go into this trigger mark let’s have an intense look again at last week. That’s of service for comprehending the current situation.
The nuts and bolts for timing is the performance of the price at the 3rd double arc and in particular the performance at the upper line of the 3rd. The resistance of this 3rd has been affecting silver since the middle of September of 2012.
A) Within the last 15 months only 3 times silver succeeded in trading above the 3rd for a very short time in the weekly time frame. Yet in the process always important highs were marked that rang in new downlegs.
B) Silver has never closed above the 3rd double arc
C) In the course of the last months, the lower as well as the upper line of the 3rd were the spoilsports = strong resistance function.
So, what was really happening last week? The analysis:
The upper line of the 3rd, the 15 month resistance, passes at 19.28 for last week. On Monday silver opened at 19.555. So immediately the strongest rally since October started. The rally began because silver opened above the 3rd for the very first time = it shook off its chains, as to my interpretation.
Then, silver quickly jumped to the Wednesday highs at 20.48. From there it fell like a stone down to the Friday lows that happens to be exactly at the upper line of the 3rd. The placatory Friday close is at 19.66. That means to me that the back-test of the upper line of the 3rd turned out positive all in all. A visible rebound from the upper line of the 3rd succeeded indicating that this one will/can/may keep on exerting a magnet function = resistance! It would have taken a weekly close above 19.75 to weaken this magnet significantly. In that case, today already we might have said that the last decline move would be all over and done with.
Such will be stated if next week, too, keeps stable, notably closing above the Resistance Angle. Silver will have to close above 20$ next week. In that case we’ll have the definite confirmation that the countertrend will last at least 5-7 weeks not being allowed to reach more than a maximum of 26.50$.
If silver doesn’t succeed in getting loose persistently from the negative influence of the 3rd, the countertrend won’t last more than 3-5 weeks altogether. Another closing price below 20$ next week would be an extremely strong clue for such an outcome.
Silver provided now the very best requirement for a turn: For the first time at all the 3rd is overcome on closing base. Friday was green. As well, the week closed green, even though it wasn’t much. The resistance-function of the 3rd isn’t overcome yet completely. Still it has silver spellbound! A weekly close above 20$ next week is supposed to loosen this spell, so silver will be able to go off downright indeed, quickly and harshly upwards in a classical short-covering rally!
Let’s consider the positive developments in silver comparing them with the newest movements in gold. That’s where the gist of the matter is to be seen at the moment in the monthly 5 candle down:
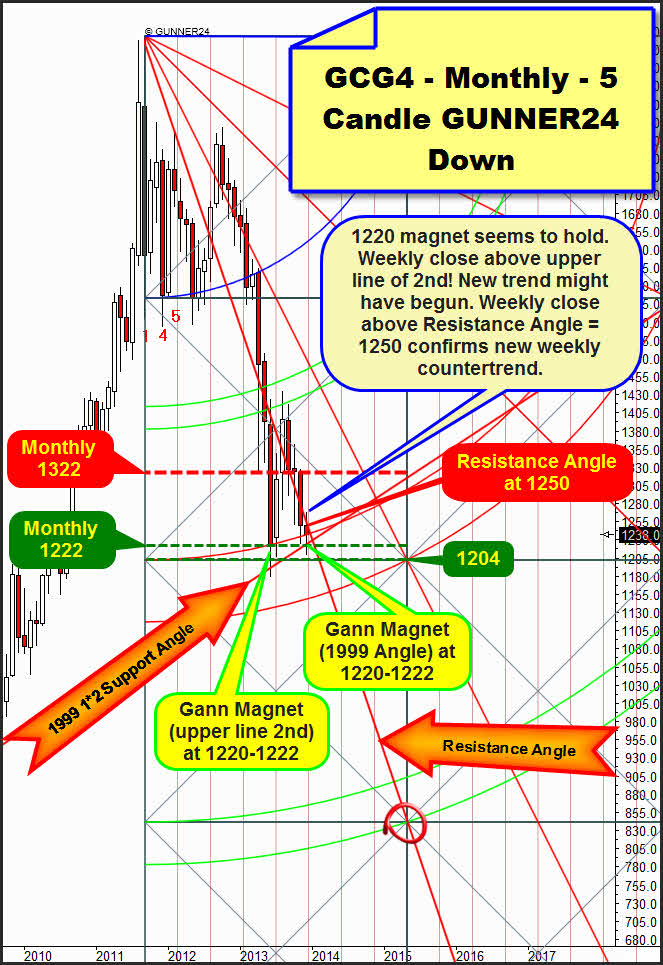
The monthly gold analysis of 11/10/2013 taught us about the existence and the importance of the 1999 1*2 Support Angle. It starts from the bear-market low of the year 1999. Thus it is also an important support and a price/time magnet for the current gold bull.
It was in June 2013 at the current correction low when the 1999 angle supported gold for the first time.
December 2013 fell newly short of the 1999 angle, narrowly it did. For December 2013 the 1999 angle passes at 1220$.
Furthermore, for a long time we have known that gold minds important supports and resistances in 50$ intervals during the whole correction, in the monthly time frame. Here you´ll find the reason why, analyzed in detail…
Thus, besides the 1322 also the 1222 horizontal is important seeming to mutate now to the most important pivot, as well as the 1322. For our notes: 1322 is/was extremely important. 100$ below, the 1222$ is certainly likewise meaningful.
So the 1422 as a possible countertrend target and the 1122 as a possible important low should be kept anchored at the back of our mind!!!
We ascertain that 1222-1220 is a meaningful Gann Magnet since several most different monthly magnets are manifesting themselves in this area. The low of last Friday was at 1219.50, the low of last Thursday at 1222.60. The close of 12/03, the day of the lowest closing since August 2013, was at 1220.80. The opening of 12/04 was at 1223.
From the Friday low – 1219.50 – gold scored up to 1238 in the close. Thus it escaped, getting back above the upper line of the 2nd double arc in the monthly setup above. That’s a weekly buy signal!
The seed is sown like in the case of silver, so the important supports will hold. Inter alia, in gold it isn’t only important to maintain the 1220-1222 on weekly base, but also not to produce a monthly closing price within the lines of the 2nd because this would create another "semi-official" sell signal. The upper line of the 2nd held during the whole correction on closing base. If this support on monthly closing base is fallen below, some new correction lows will be activated. That would mean that the June 2013 lows would be taken!
Let’s have a last look at the next important trigger. In the monthly 5 candle down above, the Resistance Angle is at 1250$ in December 2013. A weekly close above that trigger during the coming week or next will activate/permit the 1322 as the first target in the countertrend on weekly base, then confirmed!
I think that the 1250 will be headed for next week in any case. Another decision is due there. If the 1250 on weekly closing base is exceeded, gold will be able/allowed or perhaps even obliged to fly. Countertrend/short covering rally up to at least 1322 will be possible in that case. The main target of this possible upleg would be 1450, as mentioned initially.
Would you, too, like to profit from this next possible monster-wave in the precious metals on a large scale? Do you require a service that monitors, controls, analyzes and signals for you all the important moves in gold and silver? If so, go ahead and order just right now the GUNNER24 Gold Trader!
That’s where we oversee the optimal entries and exits for you. Especially in the difficult market situations where many factors have to be considered the Gold Trader is backed by the additional GUNNER24 Signals based on the combined 1, 4 and 8 hour setups to catch the optimum entries and exits.
|

The GUNNER24 Gold Trader will provide you with the critical knowledge you need to forecast and analyse the precious metals with the GUNNER24 Forecasting Method. All the GUNNER24 Trading Signals you receive real-time are based on the actual Gold and Silver Future. The NEW GUNNER24 Gold Trader is a must for every actively working investor and trader who wants to trade successfully in everyday trading. The insights you receive from the head trader Eduard Altmann (and discoverer of the GUNNER24 Forecasting Method) are truly amazing sometimes. I promise!
Click the button below and order the GUNNER24 Gold Trader - $39.90 US a month. For 201 members and up - $49.90 US a month.
 |
Be prepared!
Eduard Altmann