
Since the last intense look at the US stock markets, the intermediate tops as well as the afterwards necessary correction move have developed and formed - by and large – as expected/predicted.
In the free GUNNER24 Forecasts of 11/23/2014 I posed in detail why the S&P 500 was supposed to top out shortly after Thanksgiving respectively in the very first December trading days in the 2080 surroundings and likewise the NASDAQ-100 between 4303 and 4320, then swinging into a correction move that was to last 10 days. Well, for the NASDAQ-100 Monday will be the 11th, whereas for the S&P 500 it will be just the 6th correction day.
With the help of two important GUNNER24 Setups of the NASDAQ-100 Index, today I’ll implement the fine adjustment of the further course of the correction according to price and time:
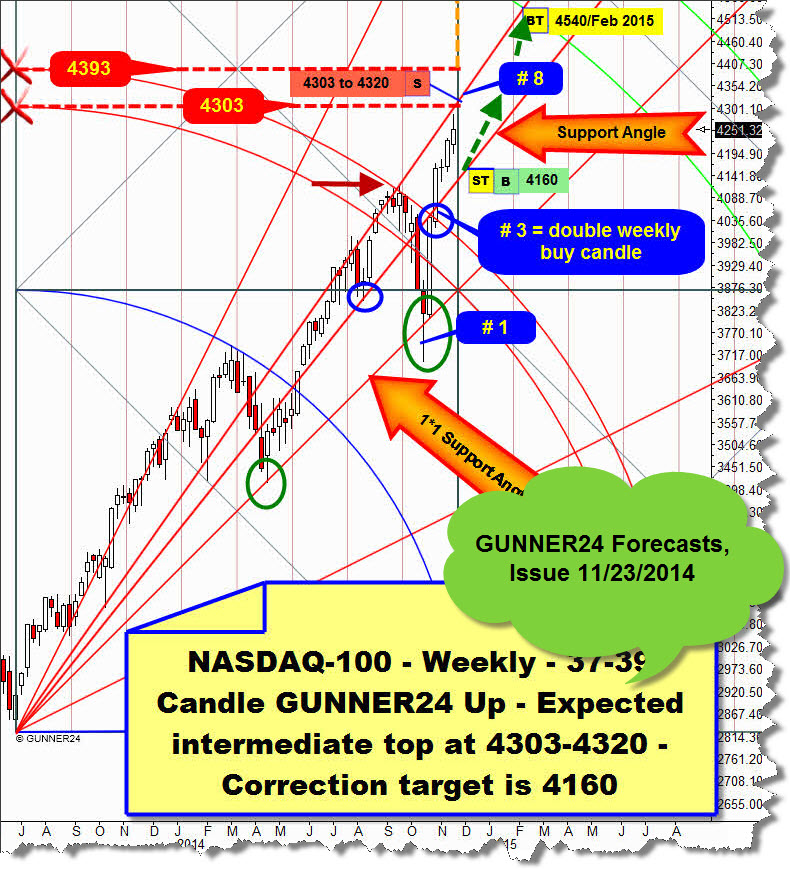
On November 23, everything was pointing to the beginning of the index falling into its most likely correction target at 4160 points within ten days, either in the 7th week of the rally at 4303-4310 or in the 8th week – in that case from a somewhat higher mark, at 4320. In terms of time, the top was shaped in the 7th week of the rally. The price top was brought in at 4347.09.
As the index decided to turn downwards at the earlier turning date and withal from a slightly higher level than calculated as maximum, the correction period prolonged from the expected 10 to now 13 days of correction. The main target of the NASDAQ-100 correction in terms of price remains at 4160 index points.
Thereby, everything is pointing to the absolute correction low at the 4160 surroundings to be made next Wednesday, December 17, the day of the next FOMC report being the 13th day of the correction. That is where the Xmas rally and the last leg of the year-end rally is supposed to start from. The S&P 500 would be at the 8th day of its correction move next Wednesday. As well as the 13, the 8 is predestined for shaping an important correction move. Thus, according to the Fib Count, both important US major indexes are pointing together to an intermediate low of this correction to be due next Wednesday:
See above the current weekly state of the index in the dominating 37-39 Candle GUNNER24 Up Setup.
The setup starts at the important 06/2013 low timing through the tops of the weeks 37 + 38 + 39 of the up impulse. With the final break of the first double arc resistance in week # 3 of the current rally, the lower line of the 2nd double arc was activated at 4540 as the next important uptarget of the index. The 4540 are to be expected for the end of February 2015. As generally well-known, the probability of the target according to price and time to be attained is at more than a 75%.
In week # 7, the current rally decided to top out at the important time line for the moment. In hindsight, the important time line signaled the turning point ideally.
Next Monday, the index will be at the 11th day of its correction. The next important Fibonacci Number will be 13. Thereby, next Wednesday will suggest itself as day of the correction low in a nearly perfect way. The quasi sell-off move of last Friday = 10th day of the correction led to a weekly close at the absolute week low. Thus, the present weakness respectively the strong down momentum will still have to show at the beginning of next week as well.
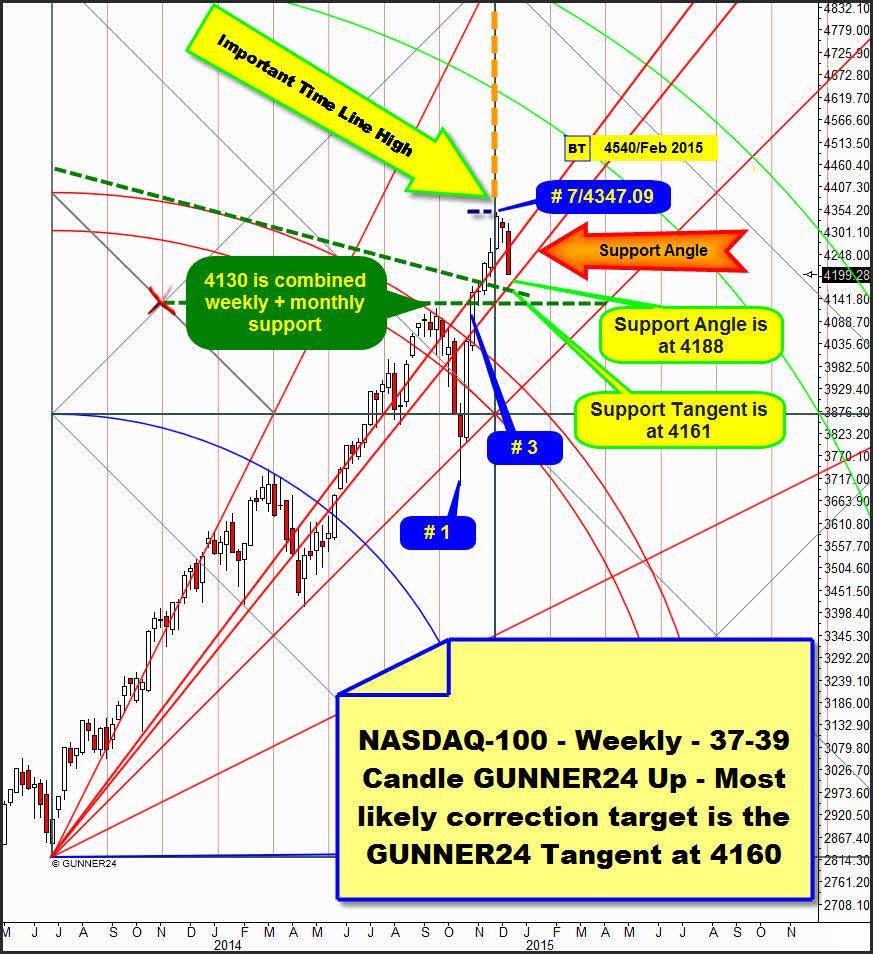
On November 23, I committed myself to the next touch with the important Support Angle to be the most likely price target of the correction = 4160. However, since the rally topped out a little higher and in terms of time earlier than calculated being supposed to continue the currently existing down momentum at least 3 more days in aspect of time, the Support Angle is most likely to be fallen below – temporally!! – during next week!
The Support Angle takes its course at 4188 for next week. At the 4188 surroundings on Monday, the weekly Support Angle may thoroughly mark an important intraday low that will perhaps lead to an 8-15 hour bounce and a test of the 4200-4215. Maximally from there, the index is supposed to fall into the expected FOMC-Wednesday low.
Since the important lows are mostly designated by an exhaustion low, ergo the 4188 should have to fall at the latest till next Tuesday, then being headed for the next lower important weekly support.
Not before this next lower important weekly support the correction will be able/allowed to exhaust finally respectively will possibly come to an end there.
This next lower weekly support is at a GUNNER24 Tangent that can be set up at the upper line of the first double arc = 4161. You see, even though the index topped out a little earlier and higher than expected, the likely correction target in terms of price, calculated on 11/23, keeps on persisting + intact! If the correction really came to an end with a significant low next week we could tell off the rally with respect to its course as follows:
7 weeks of rally to the first important top, followed by 3 candles of correction into the first important low of this rally, followed by 11 more weeks with general up-tendency until the index should work off respectively reach its next important upwards target at 4540 points by the end of February 2015, after about 21 (7 up + 3 down + 11 up = 21) weeks of rally.
If the index slips under the 4160 within correction – it is allowed, nothing is carved in stone, even less avoidable important supports when the markets want to be in a short-term panic move – the next stopping point and the probable correction low will be close to the 4130. The 4130 is visible horizontal resistance in weekly time frame – please watch chart above – plus its obvious double arc support in monthly time frame, so its a combined weekly and monthly support for the index:
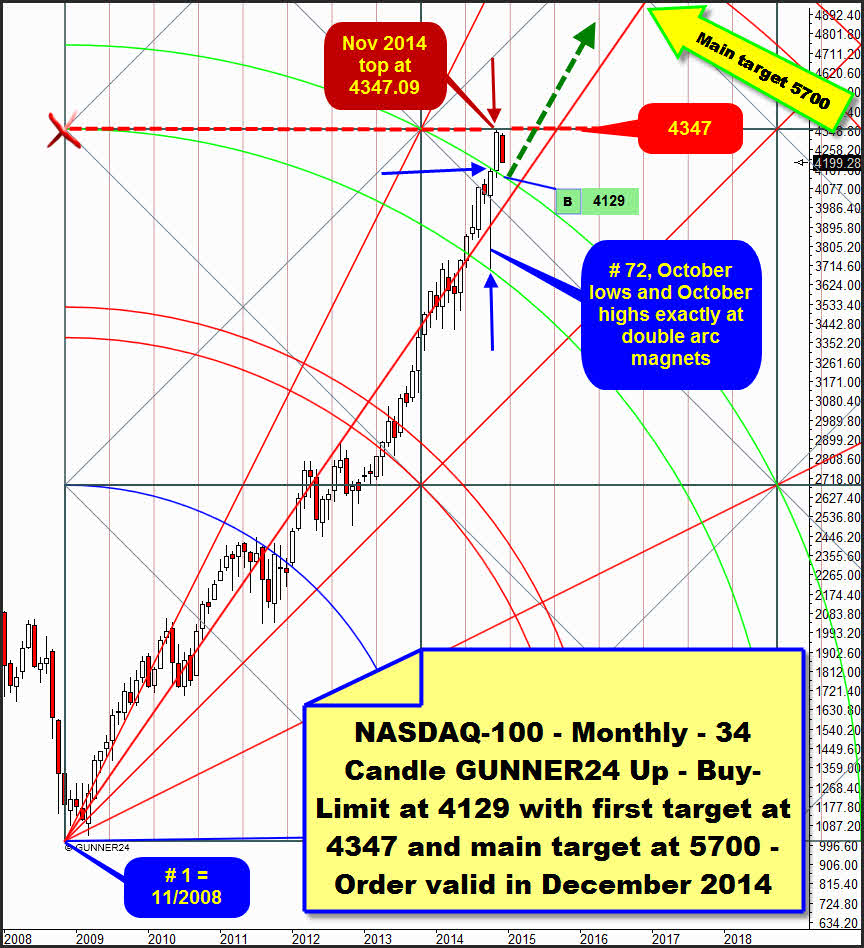
If the 4160 fall next week, the index will be very likely to be handed down to 4129, then turning upwards from there. This important down magnet for December 2014 is put out by the domineering monthly 34 Candle GUNNER24 Up.
The first time I presented and analyzed this setup was on 11/02/2014. In terms of price, the uptarget signaled by the setup is at about 5700 index points. The target attainment is to be expected for around March 2016.
The index keeps on respecting perfectly the magnets put out by the setup. The ongoing rally topped out in November, exactly at the GUNNER24 Horizontal Resistance taking its course at 4347 being the December candle possibly underway now for testing back the upper line of the 2nd double arc again. That wouldn’t be surprising after the upper line of the 2nd as well as the lower line of the 2nd double arc were textbook-tested at Octobr 2014 highs and lows (month #72 of current bull run), likewise lying the November opening exactly at the upper line of the 2nd and last confirming the latter as the most important monthly support.
==> The upper line of the 2nd is simply a multiply confirmed important magnet for the market, so a new test of this magnet in December 2014 must barely not be ruled out!
From my point of view, the 4129 in December, perhaps as early as in the course of next week, would be a veritable antedated profitable Xmas gift for all the bulls. Every bull will have to scarf up on that. However, the NASDAQ-100 is much more likely to reach "only 4160" in the course of this correction before newly resuming its sustainable uptrend.
If the index indeed wants to test back once more the upper line of the 2nd at 4129 in December, we’ll go long there with first target current bull-market high = 4347 and main target 5700! No SL, monthly position!
|

„As far as I know", the GUNNER24 Forecasting Method is the globally unique and only technical analysis tool that deals intensely with the comportment of the market at support and resistance marks being able to combine that with price predictions. You’ll learn everything on these really "secret" facts in the Complete GUNNER24 Forecasting and Trading Course. Order now!

Be prepared!
Eduard Altmann