
As price targets for the expected 1-year-cyle high (1YCH) were calculated including:
A) For the S&P 500 index between 2230 und 2235. Please consider on this the free GUNNER24 Forecasts of 11/13/2016.
B) And for the NASDAQ-100 index it is between 5055 and 5065. Consult again the free GUNNER24 Forecasts of 11/27/2016 for the extreme.
It’s about the end of January resp. early in February 2017 by when the final 1-year-cycle highs in the US stock markets will be expected.
After the early 2017 highs, I reckon with a 3-6 month of correction to ensue in the bull market.
As is well known, the US stock markets have been booming since the presidential vote. They’re accelerating more and more now into the 1-year-cycle highs. With the beginning of last week – after the "NO" vote in Italy – additionally the EU stock markets shifted up as many as two gears now being in line with the US indexes in the tough rally mode. The latter makes the important Western equity indexes conjure a flawless & strong uptrend year onto the trading floor, with lows at the beginning and the highs at the end of the trading year.
These high closings of the markets in 2016 lead inevitably to the bullish continuation until the year 2017. With newly higher highs for the beginning of 2017. The current exaggeration phase is supposed to endure at least till the end of January 2017!! Please go all in long: S&P 500, NASDAQ-100, Dow Jones, US small and mid caps, DAX und EUROSTOXX 50.
In the case of the NASDAQ-100 (Friday close is at 4895.90 pts), I keep assessing that the 1YCH should have to come in at the 5055-5065 main target.
==> Since in the S&P 500, the 2230-2235 main target was mercilessly overshot in the course of last week – Friday close is at 2259.53 – technically only the 2350-2388 magnet range comes into question as the next higher target area for the awaited 1YCH:
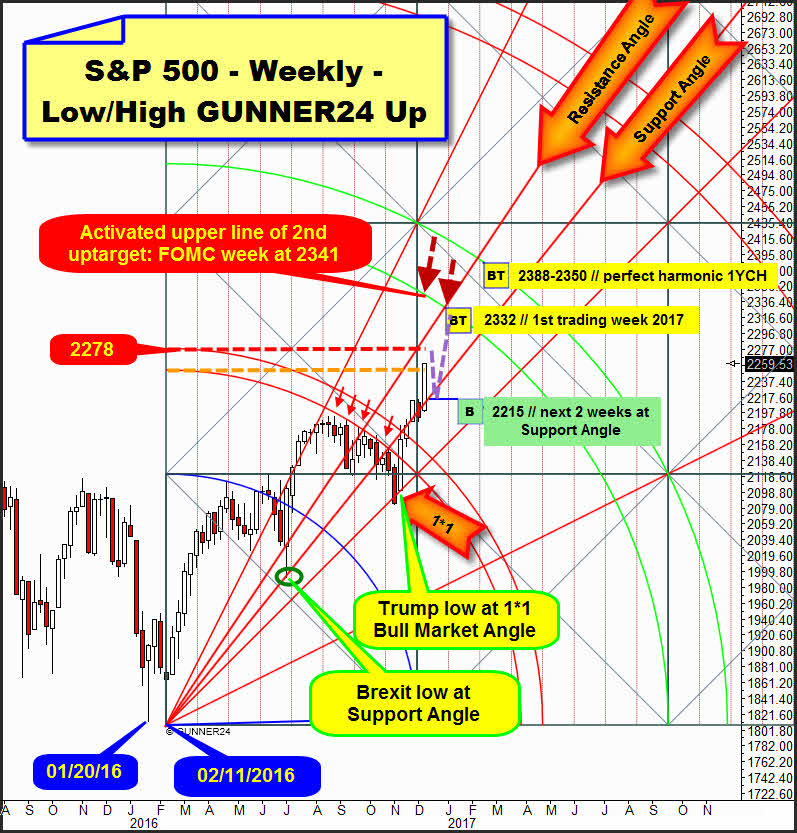
Above, I display for you the extremely market-influencing Low/High up setup in the weekly time frame that I analyzed several times in 2016 (last on 08/07/2016). It is applied at the absolute year low of the S&P 500 (02/11/2016) measuring the initial up impulse into through the first important year high at 2111.05 pts in April 2016.
The current rally leg into the presumed 1YCH – 1 year-cycle, beginning on 02/11/2016, supposedly topping out by the end of January/early February 2017 – starts at the very first test of the 1*1 Bull Market Angle and the attained Trump low.
The first very successful test of the 1*1 Bull Market Angle was the trigger for the current bull thrust in whose course – precisely with the third last candle – the 1st double arc yearly main resistance was finally overcome.
==> The 1st double arc double arc was enduring for months (red arrows), thereby dominating resistance for 2016. By being overcame this resistance, a second bullish thrust was released.
==> Likewise, the "round" 2200 Gann number being overcome triggered a new upwards thrust in the course of December.
==> Since in the course of last week the actually strong 2230-2235 resistance area was finally run down, once more an energy thrust was released ==> Weekly close near 2260.
==> Furthermore, the last week candle was able to break away very far from the Support Angle = further upwards thrust...
The importance of the Support Angle for the market as a clearly defined support magnet is proven, because at the green oval, this one was responsible for the arrival of the extremely significant Brexit low. The Brexit low was a higher 2016 low followed by the next important higher 2016 low, the Trump low.
==> The 1st double arc main 2016 resistance area being overcome activated – as to the GUNNER24 Systematics - the lower line of 2nd double arc as next important uptarget for the developing trend/rally leg!
This lower line of the 2nd double arc will be reached and thereby worked off in the current wave, with more than an 80% of probability.
Let’s go now to the possible price course for the next 2 trading weeks, the dotted-purple-line scenario placed in the chart above:
On Wednesday, the next FOMC meeting will finish after all. At its end, the next rate hike steps will be announced. I can imagine now that the S&P 500 – by virtue of the currently existing bullish mega power – will go up to the 2278-2280 GUNNER24 Resistance Horizontal till Wednesday in order to turn in then a sharp but short-lived pullback into the Support Angle after the interest decision.
==> Please buy the S&P 500 in such a case at 2215-Support Angle until 12/23/2016 with target lower line of the 2nd = 2332 pts. till the first trading week of 2017.
Since – as sketched above – the market is now in an exaggerated swing, nor the 2278 horizontal = center of the passed square might provide noteworthy resistance.
Thus, the S&P 500 may go on running simply and unchecked into the lower line of the 2nd double arc uptarget. The FOMC rate hike step – depending on its size and the market reaction – might trigger another rally thrust leading to the lower line of the 2nd double arc to be worked off swiftly!
For the coming FOMC week, the lower line of the 2nd is at 2341, a week later at 2339 pts.
==> A very good long-signal/confirmation signal for the direct attempt up to the lower line of the 2nd is the VERY FIRST FUTURE weekly close above 2281!!
.... I think since the lower line of the 1st double arc provided visible important arc resistance at the red arrows – that thereby also the lower line of the 2nd should radiate important resistance, hence it wouldn’t be easily to be overcome! Technically, the presumed natural resistance power of the lower line of the 2nd – no matter when it will be worked off – should lead at least to a pause/consolidation in the uptrend, perhaps with a duration of 2 to 3 week candles.
With 60% odds the lower line of 2nd main resistance is able to trigger a pretty sharp pullback with a decline of 60-80 index points.
Afterwards, the 2016 bull market should have to go on till the end of January/early February 2017 then topping out somewhere between 2388 and 2350, after rather exactly one year of duration.
I rummaged once more in the records of the existing and valid GUNNER24 Up Setups in the monthly time frame, and I came upon this 5 Candle up, last analyzed within the free GUNNER24 Forecasts on 07/17/2016:
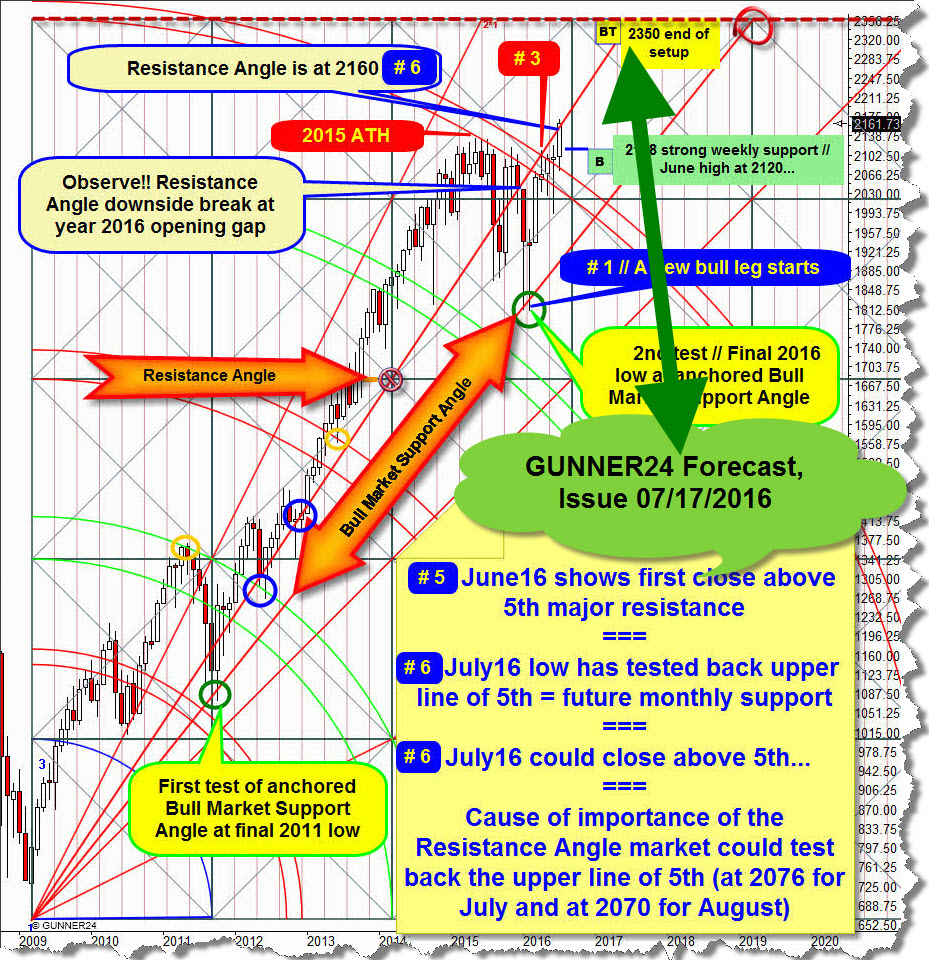
It starts at the final 2009 bear low signaling a main target at 2350 pts for this bull market after the 5th double arc main resistance having been overcome incl. tested back in June 2016! The 2350 main target to be worked off was notified for the beginning of 2017!
In succession, I don’t want to go into the inner structure incl. past signaling of the setup once more. I did so in great detail in July already, so please read it up there, if desired.
Let’s rather go into the current state of the S&P 500 setup regarding the target attainment of a 2350 resp. even a 2388 at the presumed 1YCH… Update of the 5 Candle up:
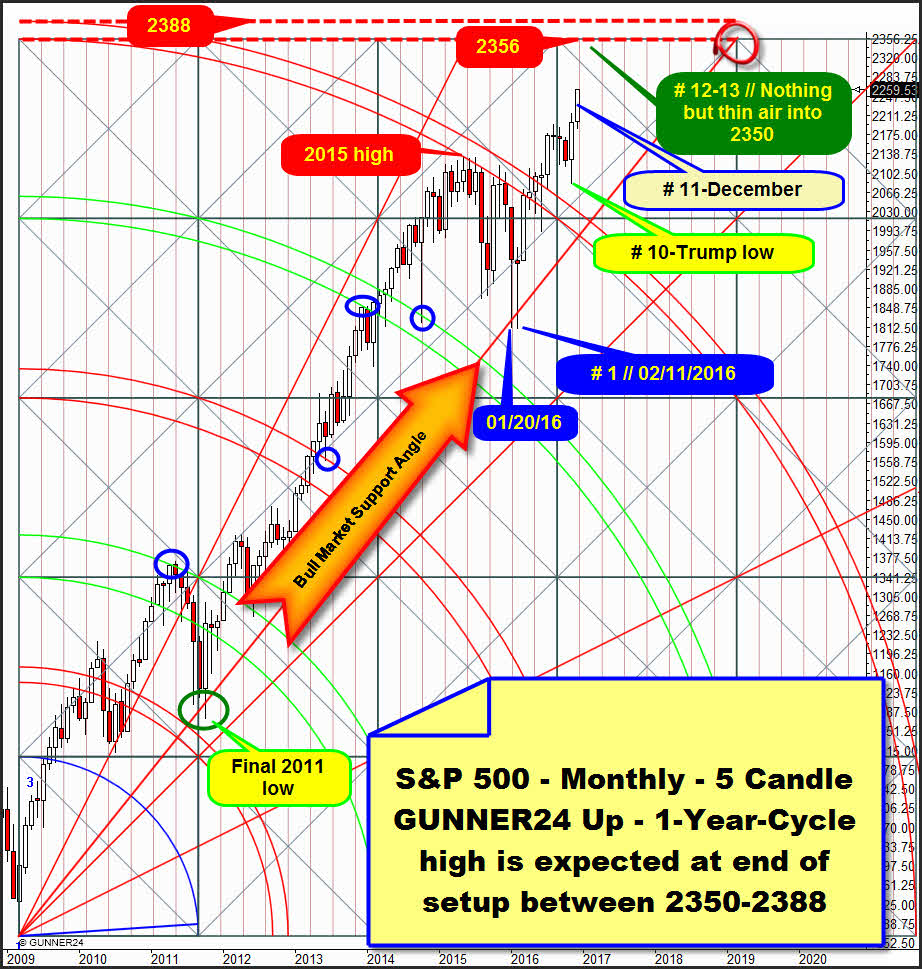
The 2016 bull market began at the last test of the Bull Market Support Angle, anchored at the upper end of the setup, after all. So it was certainly at the absolute year low, reached on 02/11 (# 1).
Exactly one year of bull market upcycle would mean that at the beginning of February = month # 13 the important 1YCH is due.
If the one on 02/11 was a false lower low having begun the 1 year upcycle at the January 20, 2016 low, the bull would have to finish at the end of January 2017 – if the upcycle wants to top out in an 100% harmonic way according to time.
The present December 2016 is the 11th month of the 2016 bull. At the # 10-November low, the Trump low, the current exaggeration phase began. So, with the so far reached December prices it’s apparent that the S&P 500 is aiming at the end of the setup according to the price.
==> Now, the market is irresistibly attracted by the end of the setup, according price! In fact, faster and faster. Main target ahead!
==> Between the current index state of 2259.53 and the end of the setup according price – the 2356 – no GUNNER24 Resistance is existent any more. Zippo, nada is there to brake in the monthly time frame. Simply till the end of the setup according price will have been worked off. Say no more!
==> Thereby, the index will really have to reach resp. work off the 2356 main resistance horizontal till January 2017 = # 12 of bull and/or February 2017 = # 13 at the latest. Since 13 is an important high Fib number, we should suppose that the final 1YCH will rather be due in the course of February 2017!
Onward now to the 2388. This horizontal is likewise natural main target for this bull run. It is directly deduced from the upper line of the 5th double arc. The 2356 derives straight from the lower line of the 5th double arc, after all…
It’s possible that the 2388 wants to be worked off at the 1YCH. For in the markets that are underway into the likely 1 year extreme we will always have to work on the assumption that the emotions spin over completely at the end of a cycle and that there will be overreactions in the present case…
The 2388 resp. the 2356, but already the 2350 as well are important upmagnets in the likewise valid 8 Candle up that we may apply at the final low of the year 2016:
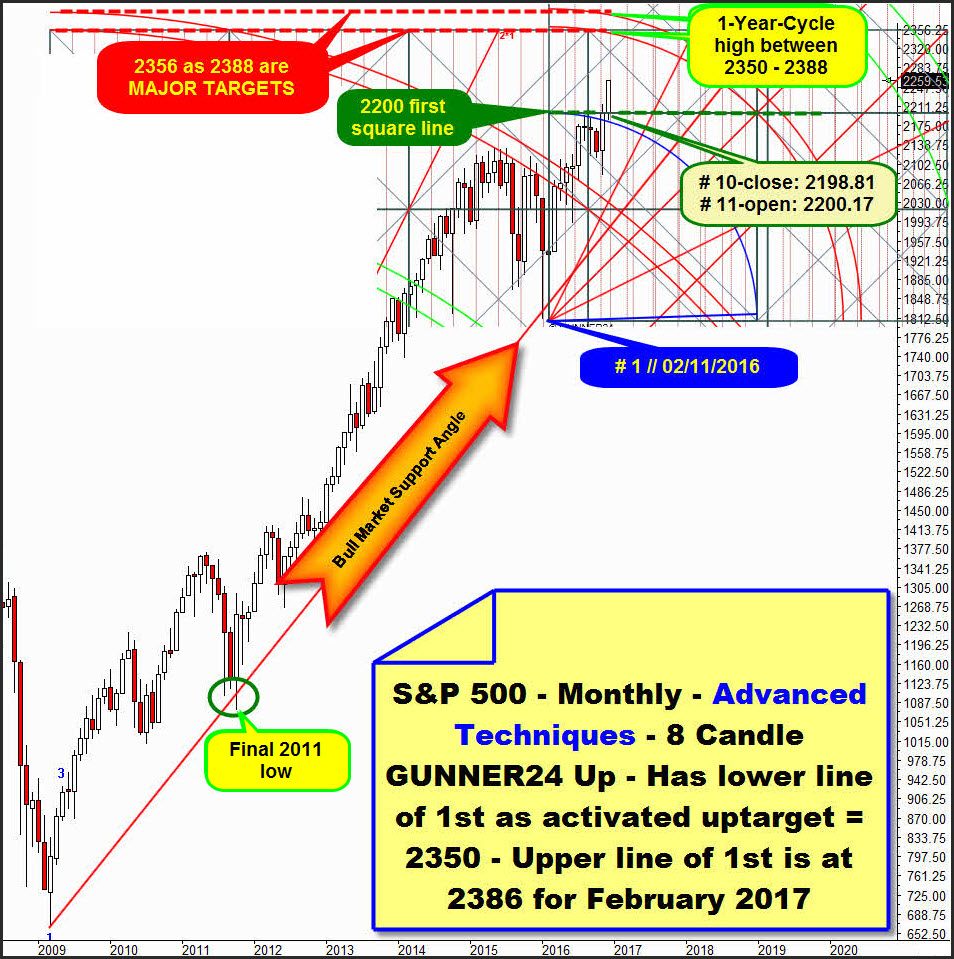
I inserted this 8 Candle up into the part of the 5 Candle up that is relevant for the forecast.
I’d like to begin with the development since the Trump low, the final # 10-November 2016 low. At the Trump low, the current rally started after all.
The # 10-November closed at 2198.81 pts, thereby narrowly below the 2200 first square line that the 8 Candle up puts out. This # 10-close was a rather good GUNNER24 Long-Signal since the Blue Arc could be overcome on monthly closing base for the first time.
==> 2200 was/is important for the index. Round W.D. Gann number, but also natural horizontal resistance in the monthly time frame. The current month of December opened very scarcely ABOVE the 2200, at exactly 2200.17. I think, this first monthly open above the 2200 was another signal for the rally continuation. It triggered another exaggeration thrust that will certainly lead up to the lower line of the 1st double arc in the 8 Candle up!
Fresh activated uptarget: the lower line of the 1st is at exactly 2350 pts for the # 12-January 2017 candle!
Besides, just look how precisely both MAIN TARGET HORIZONTALS, the 2356 and the 2388 from the monthly 5 Candle up touch/intersect the lower line of the 1st double arc as well as the upper line of the 1st double arc in the monthly 8 Candle up for the soon-to-be-due candles.
Thus, the both main targets from the monthly 5 Candle up unite with existent natural future uptargets that have developed from the 2016 bull run.
==> The 2350-2388 range is well defined and combined monthly and yearly resistance environment. Thereby, it’s predestined for the final 1-year-cycle high at the S&P 500!
Be prepared!
Eduard Altmann