
All the evidence continues pointing to rising stock markets in the medium term. The seasonality - fits. The central banks cut the interests opening the money floodgates – that fits. S&P 500 and Dow Jones consolidated their ascents of the week before last near the highs – the chart technique fits. Blunting symptoms concerning the Euro retching – the sentiment fits. The first GUNNER24 Buy Signal on daily basis in the Dow Jones – fits:
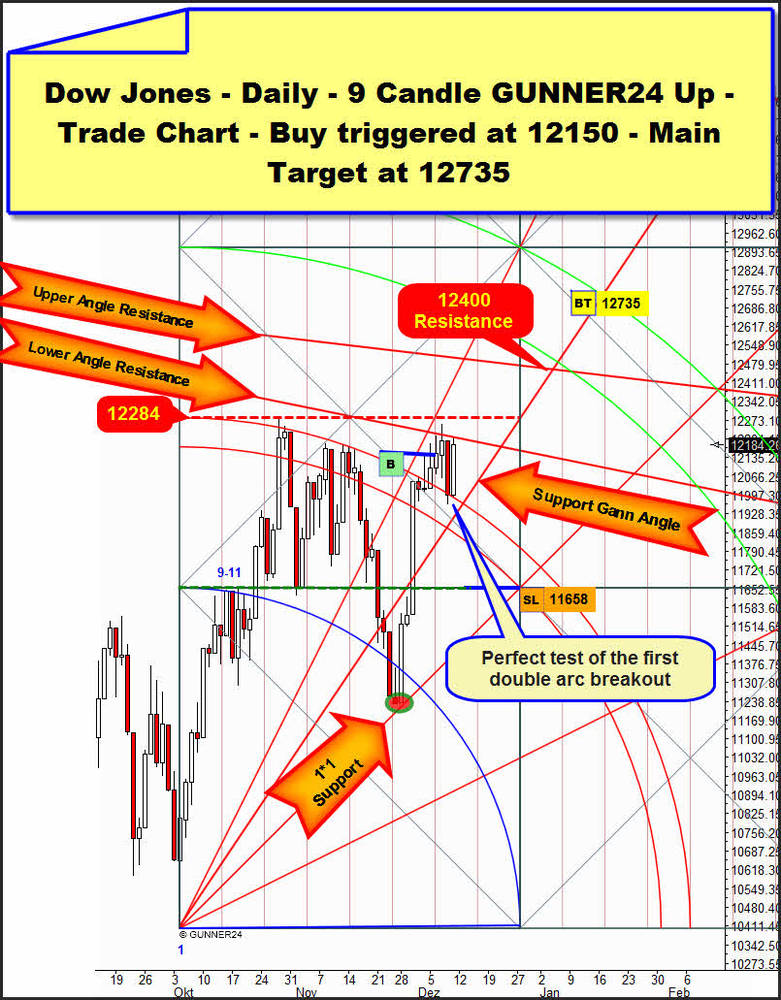
On Tuesday, for the first time the Dow closed significantly above the very strong natural resistance of the first double arc. The buy signal we’d notified last week was triggered. In the course of the week the market tested back the first double arc perfectly in order to hedge the breakout before the Friday high reached the Gann Angle called the "Lower Angle Resistance" in the setup. This angle resistance started at the 12876 year high of May 2. In case of a day closing price above this first important resistance Gann Angle the traders may accumulate some further long positions. Another one follows in case of a dayly close above 12284.
But all in all the market should target the mark of 12400 that is called "Upper Angle Resistance" in the setup most rapidly - that means in the course of next week. That’s where the last important and the strongest Gann Angle resistance is passing that started from the year high as well. After a couple of days of struggle for the 12400 – after reaching the 12400 we may reckon with a test of the 12200 – the market is expected to break the 12400 upwards diving into the 2nd double arc, then producing several closing prices near 12500-12600 within the 2nd double arc and finally reaching the buy target at 12735 with a 1-2 day move. We should reckon with an exhaustion top on daily basis. The top is expected between January 2 and 6.
In the S&P 500 neither of both long entry marks we published in the last Sunday issue was effective. But since a very fast and strong upmove is expected here you get the best possible – i.e. safest – entry with the lowest risk:
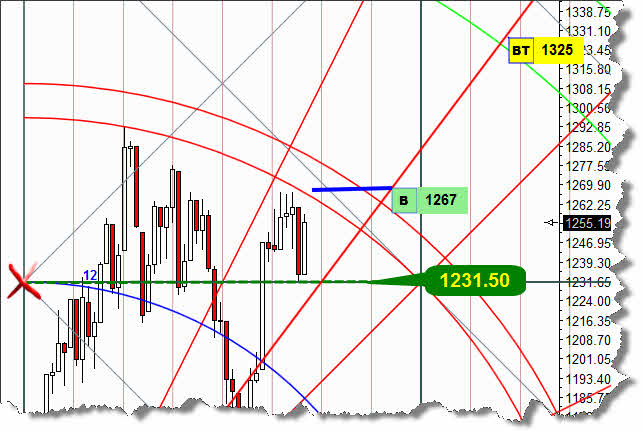
Here’s a chart detail of the actual daily 12 Candle GUNNER24 Up Setup of the S&P 500. The complete setup composition and the whole train of thought on it can also be taken from the GUNNER24 Forecast of December 04…
With its dayly low, on Thursday the S&P 500 reached the 1231.50. With this test it confirmed the upper limit of the first square. Therewith, enough rebound energy seems to have accumulated that for the first time achieves a close within the first double arc as early as Monday or Tuesday. We’ll use this first close within the first double arc as the entry signal for the 1325 target that is supposed to be headed for within the next three trading weeks, as well.
In the weekly setup of the NASDAQ-100 the 4th double arc is still demonstrating its market-dominating resistance power:
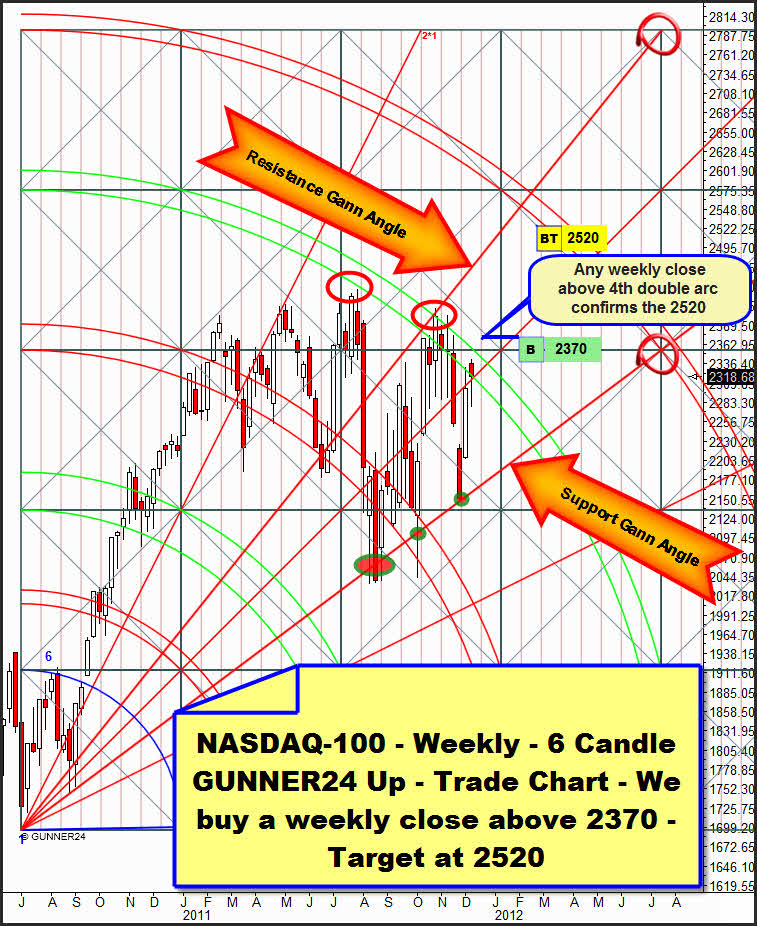
Again a closing price just within the 4th. But you can easily imagine how fast its dammed-up braking force will discharge if a clear weekly close is marked above it. Overall 4 weekly closings within (or at least very narrowly within) the 4th double arc can be counted now. The closings within a double arc are always indications (with a 70% of probability) that the double arc will finally be broken in the trend direction. As analyzed last week already we’ll buy a weekly close of above 2370 with target 2520.
All in all the US stock markets are standing in front of their definitive rally for which the starting sign was triggered by reaching the October lows. Three weeks of rising are still expected. Whereas the Dow and the S&P 500 are supposed to increase by a 5%, the NASDAQ-100 shall perform a little better. We expect a 7-8% rally.
Gold is clearly showing weakness:
By virtue of the last analysis, on Monday we bought gold at 1724 with target 1790 expecting that the Gann Angle support - present in the actual weekly 8 candle up setup - would force the metal up again. That did happen until on Thursday gold was driven below our stake by a sell-off that was a little too sharp. In contrast to the stock markets which clearly bounced up again closing near the weekly highs gold did not. That’s a sign of weakness. Thus it remains within the weekly support area that passes between 1725-1693. Currently the daily chart condition is responsible for this weakness.
In the upper daily 2 candle up we see that the 2nd double arc is visibly slowing down the gold. At most one day gold closes within the 2nd double arc then falling sharply out of the 2nd again, closing in it and falling down again. As long as since the beginning of November gold has been showing this conduct. On Thursday it strongly fell down out of the 2nd trying to get up again on Friday before the lower line of the 2nd averted the rise.
From below the clearly present daily support Gann Angle is backing the precious metal, but from above the 2nd is pressing onto the price. From my sight it looks as if on Monday the support Gann Angle will have to be tested sharply again, at any rate. Intraday the 1700 may be reached during this test. But I can’t say at the moment whether or not the support Gann Angle will fall definitely in this case – that only happens in case of a daily close of below 1700.
It’s possible that a violent struggle for the 1700 on Monday/Tuesday will happen, that a potential break of the 1700 will lead to a waterfall decline until the 1682 (next important daily support) before this horizontal support will provoke a mighty rebound, or…
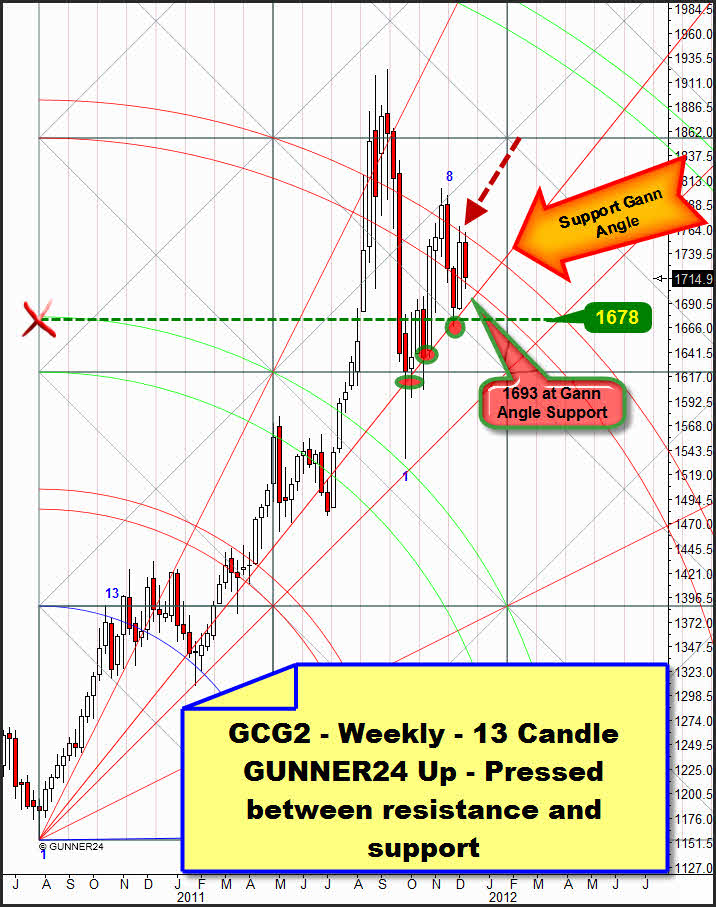
…that a possible fake-break through the 1700 will be ended already at the extremely strong weekly Gann Angle support at 1693 before a mighty rebound upwards shall follow.
This weekly support Gann Angle is the line in the sand. Since the October lows it’s been maintaining the upwards trend intact. As many as three times (red/green oval and circles) it stopped the respective corrections in the upwards trends on closing price basis forcing the market up and giving the gradient angle of the upwards trend.
Considering the last week candle we see that it closes conspicuously within the 3rd double arc – being limited from above by the upper line of the 3rd. The weekly low was made at the lower line of the 3rd. All in all it is rather a consolidation candle that has to digest the ascent of the week before last. Now of course the lower line of the 3rd for next week is posed a little lower than it was last week. That’s why on daily basis the 1700 will be a good support for next week, and on daily basis it is supposed to be hard for the market to break this weekly support definitely.
Therefore only a dip below the 1700 is rather the worst that might happen, a fake that is supposed to be retraced most violently at 1693 or at 1682-1678!
It would take a weekly close below 1688 to activate the next maximally possible down target of this correction at 1608. That’s where we’ll have to go completely long on monthly basis. On this matter, please pay attention to the free analysis of 11/27, 2011.
You best register with our GUNNER24 Gold Trader now. That’s where we oversee the optimal entries and exits for you. Especially in the difficult market situations where many factors have to be considered the Gold Trader is backed by the additional GUNNER24 Signals based on the combined 1, 4 and 8 hour setups to catch the optimum entries and exits.
|

The GUNNER24 Gold Trader will provide you with the critical knowledge you need to forecast and analyse the precious metals with the GUNNER24 Forecasting Method. All the GUNNER24 Trading Signals you receive real-time are based on the acual Gold and Silver Future. The NEW GUNNER24 Gold Trader is a must for every actively working investor and trader who wants to trade successfully in everyday trading. The insights you receive from the head trader Eduard Altmann (and discoverer of the GUNNER24 Forecasting Method) are truly amazing sometimes. I promise!
Click the button below and order the GUNNER24 Gold Trader - $39.90 US a month. For 201 members and up - $49.90 US a month.
 |
Be prepared!
Eduard Altmann