
…It goes as far as the feet carry on. Endless and agonizing seems the downtrend in silver and gold, meanwhile. All attempts of recuperation are nipped in the bud. This is the first important finding of the last trading week. Though last Sunday I expressed my hope for the soon termination of the current tendency that has been on since the end of October, nothing has changed about the unambiguously present downtrend. Gold and silver keep on lying down to the floor one new lower daily high after another, combined with lower daily lows. This is the way a downtrend is defined.
Best we are shown by the upper line of the 3rd double arc why such a situation is dominating at the moment, why silver (and thus gold with it) had to fall unalterably and when this downtrend may finally come to an end. This upper line of the 3rd in the weekly time frame of the 21 candle duplicated GUNNER24 Up – last presented and analyzed here – is our ideal optical signaler for the moment the bull’s suffering will finish and the next lasting upmove = change in trend will have taken place:
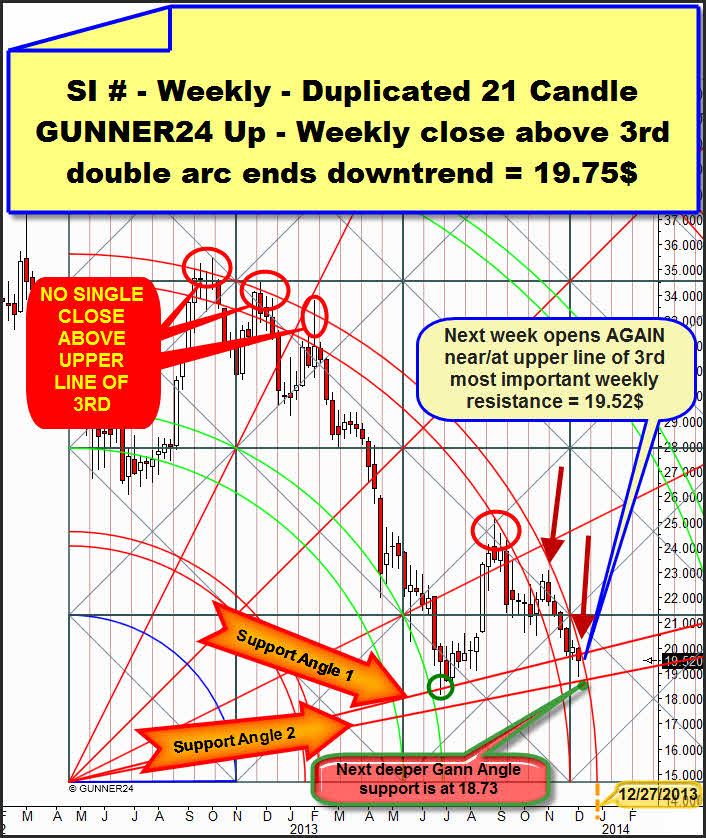
The lower line of the 3rd is going down pressing and pushing and beating silver down. Optically nice to see is that silver is not even able to achieve a quotation above the upper line of the 3rd at the moment. The past trading week opened at 19.99 on Monday, i.e. at the upper line of the 3rd. At the first minute of last week its high reached 20.01, and that’s where the upper line of the 3rd is situated. The fact that silver started to dive from the first minute of the week, demonstrates us the enormous resistance power of this upper line.
This observation is giving us some extremely important findings. Silver is minding the 3rd respecting it tremendously, is even scared of it. The down pressure the upper line has been exerting so far, its energy is influencing silver very negatively keeping the metal in a clear downtrend being able to maintain this condition till the resistance of the upper line of the 3rd comes to an end.
There are two options for ending this state (=down-energy is stronger than any up-energy).
A) Silver achieves to overcome this resistance in terms of price. From any low there is rising enough up-energy to bring the strong resistance-energy to its knees. In plain text: The buys have to outnumber the sales. Only in that case the resistances can be taken.
B) The sellers predominate until the time indicates us when the down pressure comes to an end. It’s the moment when the sellers will get out of puff and all of a sudden the buys will outnumber the sales, the downtrend thus being exhausted. Then a new trend will start, a bounce, or a countertrend… it depends…
Theoretically the down-energy optically depicted for us by the upper line of the 3rd will last until the upper line of the 3rd intersects the time axis. This is the case for the week from 12/23 to 27. So far the upper line of the 3rd will be able to press silver down. And, well, frequently the heftiest moves don’t take place before the near end of the time influence of a double arc.
Yeah, often the move don’t exhaust before the very end. And, well, silver is a wild animal. Final exhaustion moves in silver are often brutal. I just think about the 2011 all-time high, when silver swayed around 6$. Applied to the today’s situation that means: Silver may thoroughly reach 14.xx$ an ounce when the upper line of the 3rd finishes its temporal influence. I mean it just theoretically!
But let’s quickly get back to the practice. Please have another look at the upper line of the 3rd. Zoom the chart to the upper line of the 3rd. Next week – tomorrow – is going to open again exactly on the upper line of the 3rd. 19.50-19.52 should be the opening price technically if we aren’t caught by surprise. Like in the past week opening there’s the thread again that silver might dive immediately, if the upper line of the 3rd continues as strong as so far. Technically we have to work on that assumption, above all considering that last week, in spite of its conciliatory end, produced another weekly sell signal.
The Support Gann Angle 1 was clearly fallen short on weekly base. The Support Gann Angle 2 is now the next downtarget in the weekly time frame. The angle 2 passes at 18.73 for next week. Technically silver should reach this angle 2 in the course of next week. And that’s the only place where there’s the chance of a significant low because only after working off an important magnet finally, enough up-energy may develop to break upwards through the resistance of the upper line of the 3rd consecutively.
But the other side of the medal is the following one: It’s a fact that silver finds it infinitely hard to produce prices above the upper line of the 3rd! Let alone just only one weekly close above the 3rd double arc.
Ergo, prices above the upper line of the 3rd next week will be a clear indication that the upper line of the 3rd is losing power. If the 19.60 or higher is to be seen as early as on Monday, something may be cooking. Perhaps the bulls will be at the helm in that case. Perhaps the trend will have changed already. A close above the upper line of the 3rd would be likely to have overcome the resistance of the 3rd.
I would say that a weekly close above 19.75 will be an unequivocal sign that the trend on daily base will have changed. A several week up-move would be the inevitable consequence. But the 3rd will exert influence till 12/27, in any case. Until that point it will always have a magnet function. So, possibly silver won’t be really able to detach upwards before 12/27. I.e. not even significant closing price above the 3rd will necessarily lead to an abrupt up-move. Such is expected to happen rather creeping and haltingly. The 3rd is an important magnet…
About gold and its situation I could truly write much more than about silver. It’s really a tragedy, not only in terms of chart-technique. But I’m here in order to expound the essence of a market. And what mainly matters me in this respect is that we all make a little money trading successfully. And with last week in my occiput I can only advise you to trade very carefully. Not often before I had seen such a savage week as the last one, as far as gold is concerned.
Altogether there were 3 mighty countertrends that shoot up lightning. Once the legs of the countertrends were about 40$, then about 15$ and about 35$ again. The intraday countertrends were retraced then very low or even completely. Bulls and bears make the fur fly fighting for the market. Strong signals are generated seducing the bulls to enter long. In the bargain the bears’ stop-losses are fished. But by and large the bears still dominate the trend because some fresh lower lows and lower highs on daily bays keep on being produced. But it always happens just closely lower… The bulls don’t succeed to ring in consolidations at the corresponding countertrend highs. The connection buys after the countertrend highs at the common retracement marks are missing. (50%, 61.80% etc.).
At the moment in any case there are more stable markets to make money than trading with gold and silver. Well, and for positioning trading one needs a thicker wallet.
Don’t let you buffalo by the daily fluctuations. Wait for safe signals as follows: The trend will have changed if next week a daily close above 1250 succeeds. That will be a sign that a several week counter move is coming targeting the 1320. The braves will try to buy the low.
The GUNNER24 Construction Kit is throwing out 3 monthly setups altogether that are pointing to a significant low between 1207 and 1204. It would take the reaching of this vastly powerful Gann Support area to bring the change. 1207-1204 is a Gann Magnet, even a triple one in the monthly time frame. It’s a mighty point of attraction that after reaching and working off should technically be able to develop enough up-energy to turn the trend definitely. I think the 1207-1204 is equivalent to the 18.73 down target in silver!!
I’m only showing you today one of these monthly setups including the extremely important 1222 monthly-support mark:
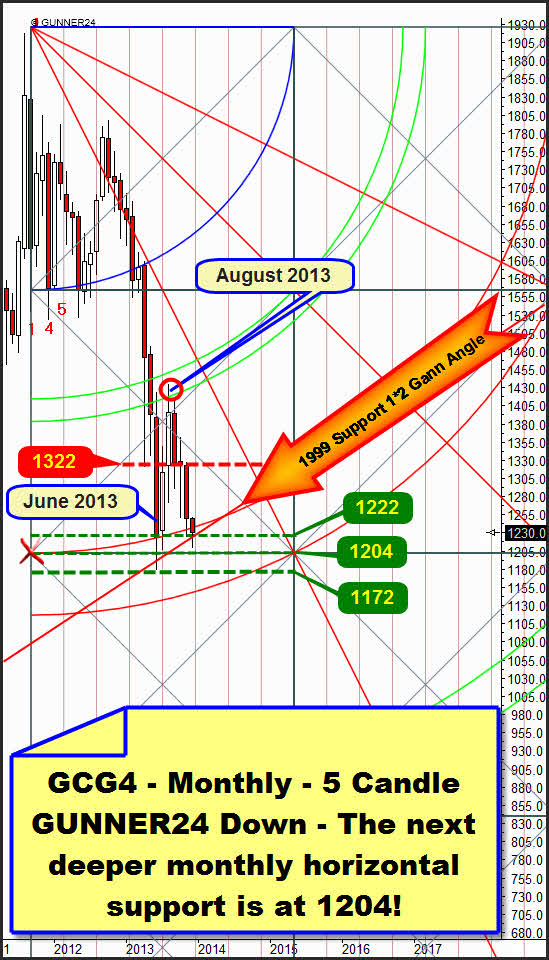
In the monthly 5 candle down gold has really a very critical standing. After the first double arc was finally broken in May 2013 the 2nd was activated as the next down target. It resisted excellently. June, July and November dipped into the space between the upper and the lower line of the 2nd. So to speak it tested the 2nd intensive. But the price was always retraced, and the last months always closed above the 2nd. Absolutely pointing the way was the June close very narrowly above the upper line of the 2nd. With that we recognize that gold accepts the upper line and thus the entire 2nd as a support.
From the June 2013 low on the developing up-energy was strong enough to make succeed a test of the first double arc. August 2013 even dipped into the lines of the first. But this resistance energy of the first appears to be predominating, and in December gold is driven again between the lines of the 2nd. If gold doesn’t succeed in December 2013 to close above the 2nd again, the monthly downtrend will be likely to be continued far into the year 2014.
In the whole correction gold is showing important supports and resistances with 50$ of distance each, on monthly base. Here you’ll find analysis in detail why it is like this…
Actually the 1322 horizontal took an important function over the entire last half year. Gold fluctuated permanently around this important mark. And now it seems that the 1222 is a likewise important trigger mark or may become one. All the last 5 trading days, gold dipped intraday below also closing below even though it was extremely narrow. But the weekly close at 1230 is confirming this important monthly horizontal support. For the time being it does.
It’s also extremely interesting that for December 2013 at about 1220 there is the 1999 1*2 Support Gann Angle. The derivation/deduction of this eminently important bull-market support can be read up here.
The course of this angle together with the 1222 horizontal support converts the 1220-1222 area into an extremely important support zone and a mighty Gann Magnet that will produce another powerful sell signal if it breaks on monthly close. So gold better starts rising pretty soon now.
From where it may?! The important daily lows of last week are 1217.10, 1214.60, 1210.80 and the 1210.60 low of Friday. They are lower lows, one after another. Another dip down to the 1204 onto the next important horizontal support it goes. The lower line of the just passed square seems to be an irresistible magnet. The 1204 may be fallen short. We all know about the important round numbers. Maybe the market wants and has to dip again narrowly beneath the 1200!
My assessment and conclusion: The 1204 or the 18.73 respectively are the currently strongest magnets below the markets. They are likely to be reached within the coming two weeks. Technically the market is likely to rebound there significantly to lay down a lasting several week recuperation consecutively. Uptargets would be the 22 or the 1320, respectively. If now no rebound at 1204 and 18.73 succeed, we will say good night.
Here’s a brief assessment with a mini-update on the US stock markets.
In fact the S&P 500 fell down to the strong 1780 daily support till Wednesday, the 4th day of the correction. The 5th day of the correction – Thursday – showed a higher daily low. So it might have finished the correction, according to the Fib count. The result would be now reaching the 1820. The important working-off of the next important Gann Magnet above the current year-high (produced on 11/29 at 1813.55):
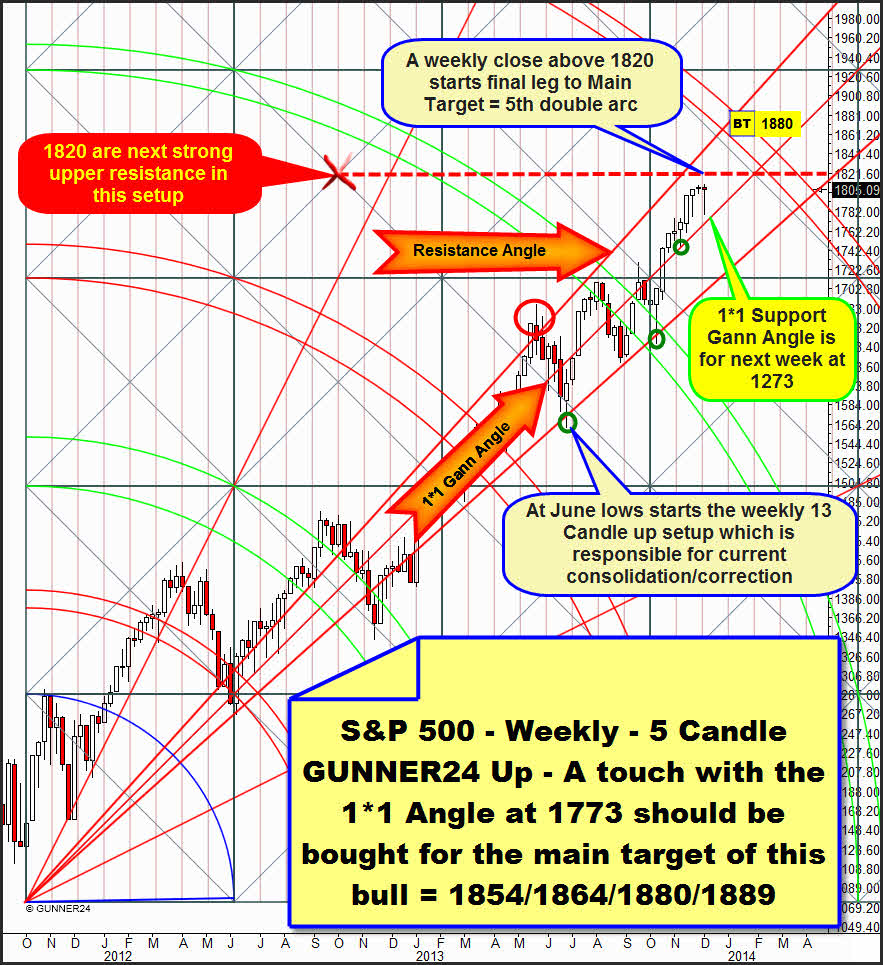
In the ruling weekly 5 candle up we see that the mini-correction wasn’t even able to reach the dominating 1*1 Gann Angle. By this one the uptrend has been orienting since the middle of 2012. The 1*1 is giving the gradient of this bull. The market has been oscillating extremely disciplined around the 1*1 for 18 months. The fact that the 1*1 wasn’t reached in the correction perhaps coming to an end the correction at the earliest possible moment - the 5th day – keeps on showing the brutal power of this bull.
Anyway I’m not positive whether the market won’t have to touch this 1*1 Angle till Tuesday – the possible 8th day of the correction - all the same, to head for the Main Target of this bull afterwards in its last mighty wave. 1854/1864/1880/1889 are the 4 possible GUNNER24 Exhaustion Targets of this bull before a several month correction comes.
If the market wants to go back again it should happen till Tuesday or Wednesday at the latest down to the 1*1 Angle at 1773. That would be allowed and healthy (another weak-hand shaking).
For in a sub-setup of the setup above I made out an obtrusiveness that allows reaching the 1773 as well. Starting from June 2013 a very rule-conform weekly sub-setup has developed. We can measure a 13 week initial impulse that depicts the future resistances and supports pretty precisely:
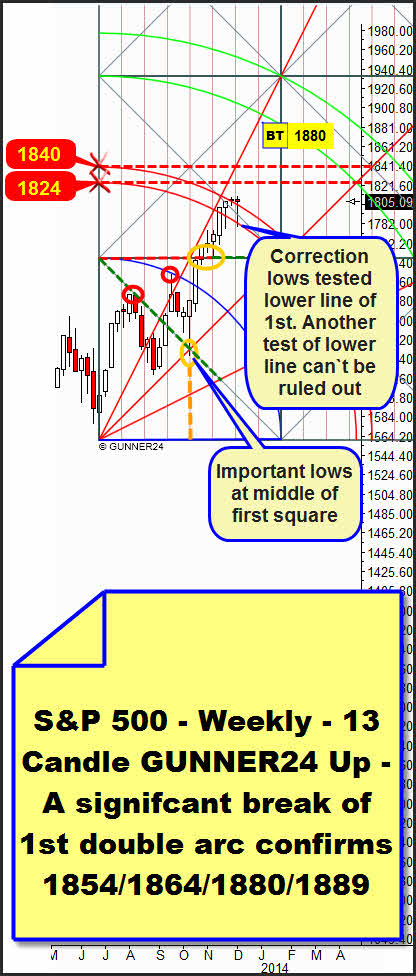
This 13 candle weekly up shows us that the last two weekly candles really just repined with the overcoming of the natural resistance of the first double arc. Last week, at the low, the lower line of the first tested back.
==> The possibility cannot be excluded that the market next week wants to test again the lower line of the first. Sometimes it takes 2 tests to confirm a support. So, this setup, too, allows the end of the correction at the 8th day and at 1773!
Unfortunately the reached weekly close above the first is not significant. The S&P 500 is still situated in the sphere of influence of the first double arc. But next week may produce the next buy signal on weekly base – in case of a weekly close above 1805 already. This close would make the first according time break, being finally activated the 2nd double arc as the next uptarget of this bulls. Thus it will be reached in trend direction with more than a 75% of probability!
A weekly close above 1820 next week or the week after next would activate the 1854 as the next uptarget and thus as the first exhaustion target of this bull!
The NASDAQ-100 keeps on being brutally strong. It is generating a new weekly buy signal thus confirming the reaching of the 3550 again:
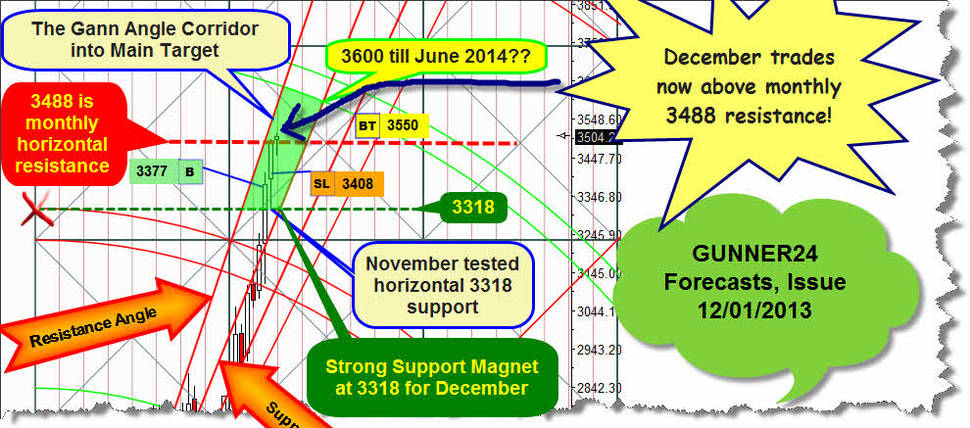
Last Sunday I still thought that the NASDAQ-100 would have to correct rather 10 than 8 days before the X-mas rally should start. Well, the correction lasted but 3 days. On Friday succeeded new year-highs.
With the actual weekly close above the monthly 3488 resistance – you’ll find the monthly chart above, analyzed in detail in the issue of 12/01/2013 – succeeded a new weekly buy signal, a strong one – with closing price 3504.26. The market is likely to go up to its main target at 3550, pretty untroubled.
There, at 3550 MIT (market if touched), we’ll cover our longs we went in on 10/31/2013 at 3377. This order will be valid till the end of the month.
Be prepared!
Eduard Altmann