
Before upcoming important highs – likewise before upcoming bottoms, of course – the markets use to play cat and mouse with the traders. Those surprisingly wild, mostly short-living up-and-down changes rattle the traders and investors driving them completely mad.
Chart-technical amiss signals enhance before important lasting changes. The reason for the to-and-fro tugging of the bulls and the bears are the more and more augmenting emotions and convictions. Some – the bulls in current case – are increasingly positive about the trend direction keeping on, so they raise their stake in case of significant weakness, others – the bears – smell the emerging extrema, so they likewise raise their bets in overbought market conditions.
If the different parties are caught flat-footed, hence because of the peu à peu ascending stakes they have to cover position faster than in the normal market environment = the volatility rises! It’s also cause the market participants are rasher ready now to change over to the opposite camp – from the bulls to the bears and vice versa… depending on the last signal, feeling, news… whatsoever.
I think, last week – especially the developments on Thursday and Friday in the US stock markets, EURO, US$, precious metals – was so to speak the starting signal for the next topping process in the US stock markets.
The emotional drifts grew significantly last week being supposed to keep on boiling up onwards till running into the extrema. From now on things are going to become wild until this equity bull market will top out – likely in January – correcting afterwards deeply, for at least 3, but rather 5 months.
With the aid of the NASDAQ-100 index, I can time/spike now pretty well the next pending important bull market high incl. upcoming swings in terms of time as well as price. The other major US indexes are still concealed behind a dense smoke screen concerning their individual tops (about when/how high), technically having to orient themselves quite accurately by the tech leader – from experience…
With the help of the GUNNER24 Method, for the daily time frame today we’ll start to work out the coming swings into the top in terms of price as well as time. Then, we’ll briefly switch into the monthly time frame to evaluate the most important and strongest December support from which the market is supposed to exhaust into the top by an extremely quick and hard rally move. The GUNNER24 View in the weekly time frame assembles the realizations from the daily and monthly time frames, confirmed with its magnets, targets and signals… rounding, as it were.
Current ruling daily GUNNER24 Up Setup starting at the important August 2015 sell-off low:
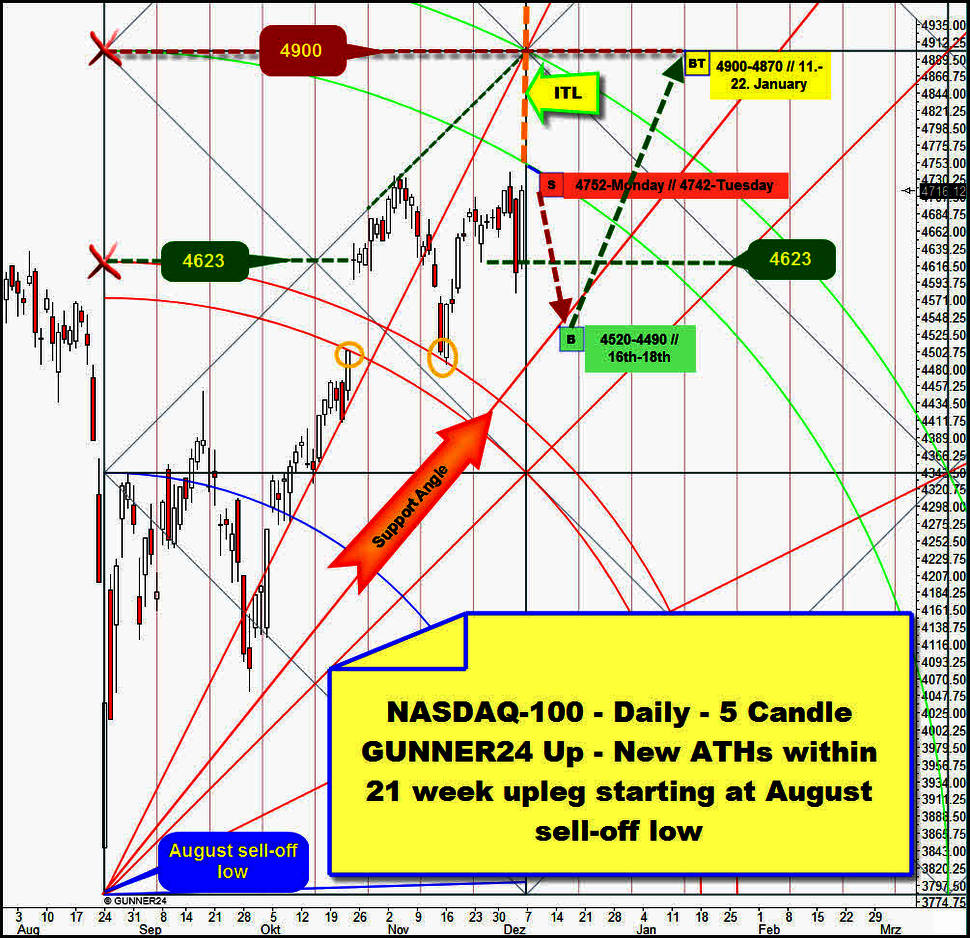
Let’s begin the analysis at both orange ovals. These tests of the lower and upper lines of the 1st double arc confirms the existence and importance of this 1st double arc and thereby of the entire GUNNER24 Setup.
The lower line of the 1st double arc resistance at the left orange oval was reached during the rally and overcome with a huge gap the following trading day. At the right orange oval, the previously skipped upper line of 1st double arc resistance was tested back successfully.
Important: Since the 1st double arc is finally overcome, in addition being tested back successfully the upper line of the 1st, the index will have to head for/touch the lower line of the 2nd double arc.
Thursday had already been scarcely in front of the lower line of the 2nd target, but it turned downwards followed by a Friday that packed a punch. Technically, Friday should have had to go on selling off. It wasn’t able to however. Because… just the lower line of the 2nd has to be reached! Not before that, the market will certainly be allowed to turn downwards sustainably!
About last Thursday: This is what I meant talking of the increased emotions and the false signals, above. Thursday closed below the important 4623 support horizontal, technically a sell signal. Yet Friday opened exactly at the 4623 support, and up again it went. Friday delivered an extremely bullish reversal candle with close near highs signaling that the lower line of the 2nd double arc will likely be reached in this swing.
A) On Monday, the lower line of the 2nd may be reached at 4752, but I think that it will rather be on Tuesday that this important resistance at 4742 pts will be worked off.
B) Monday as well as Tuesday are still close by the next important time line (ITL). At ITLs (transitions from one GUNNER24 Square to another on the time axis), frequently important changes are marked, because to the market participants they signal/notify emotional highlights!
C) I think that the tech leader will be rejected by the lower line of 2nd double arc resistance (the emotions in the daily time frame are high… the bulls + bears think that this is the final bull-market high already), then in succession – till the next FOMC meeting on December 15-16 2015 – declining rather steadily and surprisingly low. In fact, down to 4525-4490. This decline might often show panic-like features, just like last Thursday. I expect the 4525-4490 target zone to be worked off in the lapse of December 16-18.
D) From there and then, the likely last sharp and hefty rally move into the new all-time high will begin.
E) This one should have to be marked between 4900 and 4870, in the stretch January 11-22, 2016. 4900 is an important GUNNER24 Horizontal Resistance in the daily time frame. From then and from there, it will be going heftily downwards for 3 – 5 months…
Between 4525-4490, there is decade support for the market in December 2015. When reached, the next – likely last – rally move will be supposed to start, as happened with the August 2015 and October 2015 lows! As proof of this thesis, let’s switch now into the monthly time frame:
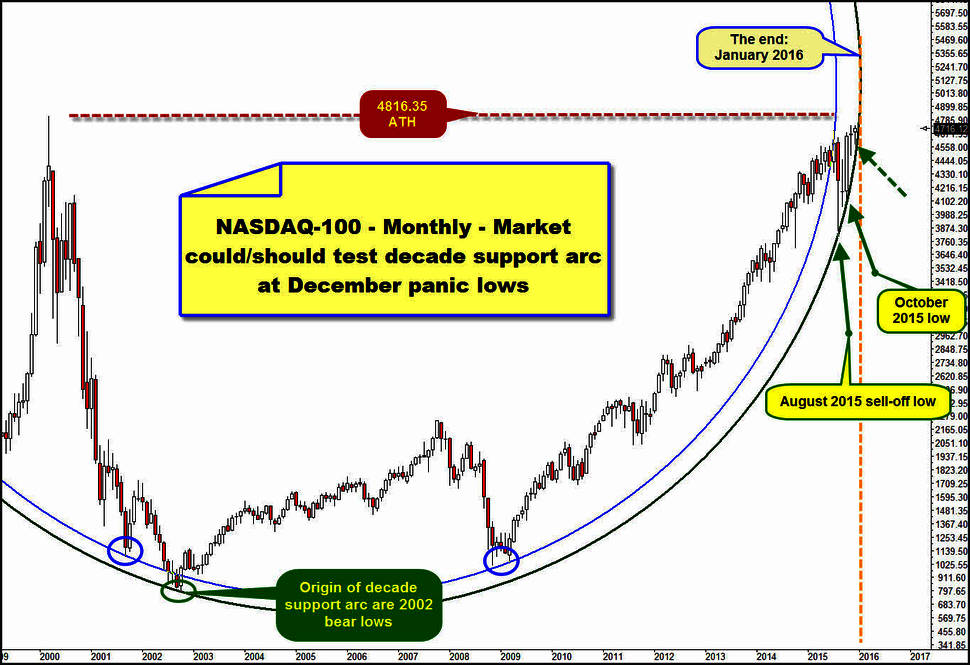
Our focus is on the lower green arc. It was first defined at the 2002 bear lows where two successive lower monthly lows defined the most important support for the year 2015.
Since the green arc was defined 13 years ago, it is matter of a decade support. To say the least, supports like that are not quite unimportant, if reached. Since the decade support springs from FINAL BEAR MARKET LOWs, we’ll simply have to keep in mind that it should be strong, that it is important and furthermore first of all:
==> In case the decade support arc is tested once more in December 2015, it will provide the most optimal entry a bull can wish.
Before we zoom into the important August and October 2015 lows that were marked at the decade support arc, still a brief look at the most extreme extension of this arc in terms respecting the time factor …
… the support arc reaches its most extreme extension in January 2016. This is depicted by the dotted orange vertical. That’s why we have to expect the emotions to be at the extreme point in January 2016 when the support will reach its most extreme extension and that in the present case – bull market running for years – at this deadline then another, the next important high of this bull, will be on the agenda.
Now to the August 2015 and October 2015 lows. We just zoom into the decade support:
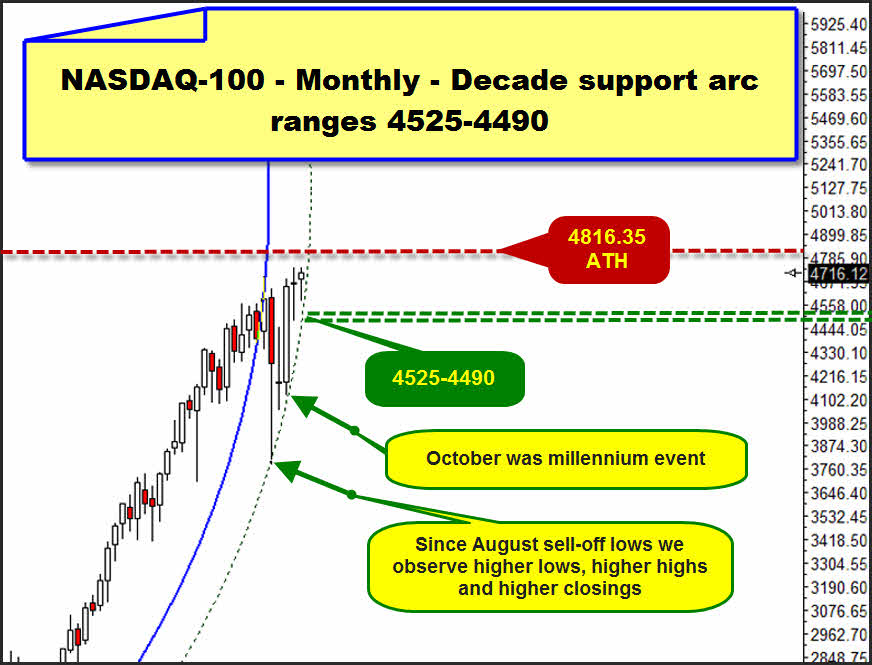
In the zoom chart, now I depicted the decade support green, thin dotted. The following becomes obvious: The very first test of the decade support arc at the August 2015 sell-off low released an enormous upwards thrust. This monthly spike low was the most extreme spike low in the history of this market.
Likewise historical was the upwards thrust that began at the second test of the decade support arc with the October 2015 low. October 2015 succeeded in producing the longest positive candle body since the year 2000 (then shortly before the all-time high). Historic things happen when the market touches the decade support arc!!
Besides, every bull will have to go for it of course, when the decade support arc is touched at the next, the third test. For December 2015, the decade support arc takes its course between 4425 and 4490. Since the August 2015 low, we’ve seen higher monthly lows, higher monthly highs, higher monthly closings. The market is going steeply! It will be going into the top in January 2016. At this rate, technically the market cannot top out before a new ATH will have been reached!!
If the decade support arc is not touched in December 2015, by all means, the next test would have to occur during the first 3-4 trading days in January 2016 – in that case, it won’t be between 4525 and 4490, but a little bit higher. The next touch with the decade support arc will support the market, newly making the market accelerate and thus chasing into the new ATH!
In the weekly GUNNER24 Up Setup complies what belongs together:
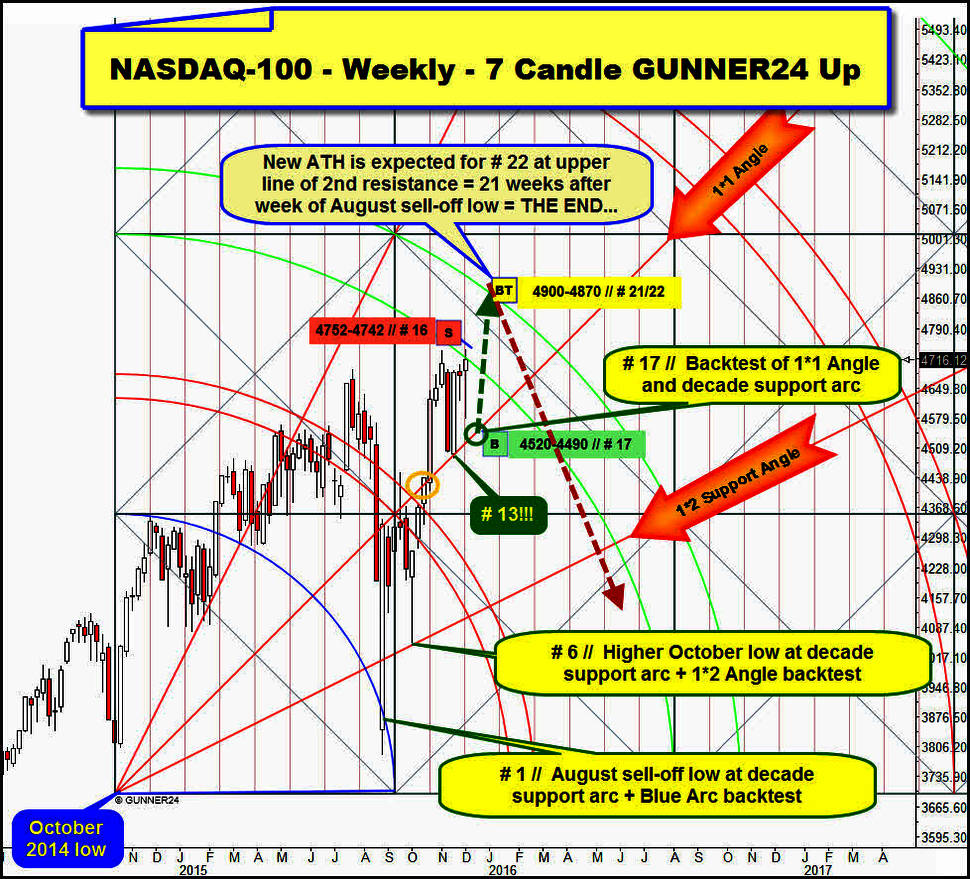
In the retrospect, the low of October 2014 was really very important for the stock markets. I’m going to explain why.
What starts out from this low is not only this weekly up setup with all its arcs, horizontals, diagonals that indeed are pre-defined by the first up impulse after the low.
The most recent performance of the market at the important Gann Angles can shed a lot of light on what the market wants to do now before the presumed top will have its turn.
Let’s start at the backtest of the Blue Arc, at the August 2015 sell-off low. This is where we begin counting the current rally move, therefore # 1. The August sell-off low tested pinpoint the decade support arc after all. # 1 did not close below the 1*2 Support Angle that is indeed derived directly from the October 2014 low, just as the 1*1 Angle
The second test of the decade support arc took place at the October 2015 low. Well, to a T at this low – in the weekly time frame above at the low of the rally week # 6 – also the 1*2 Support Angle was tested back. So, at the low of # 6, the market found a combined decade, yearly, monthly and weekly support magnet!! The NASDAQ-100 simply had to keep on booming after such a mighty support magnet being worked off!
Now to the 1*1 Angle. The last rally succeeded in re-conquering this important angle…
… and since the market tested back the 1*1 Gann Angle to a T, exactly at the low of the rally week # 13!! producing the 1*1 Gann Angle clearly strong bouncing energy that lead to new rally highs in the course of last week (= # 15), we may, even we HAVE TO work on the assumption that the market will make its next important bull market high in/around the 21st resp. 22nd rally week!
==> I think that exactly 21 weeks after the August 2015 sell-off low the next important bull high will come.
==> I expect the next intermediate bull high to be made near the upper line of the 2nd double arc resistance between 4900 and 4870!
==> Now to the present signal for the next week and the week of the FOMC meeting:
For polishing up: The analysis of the daily GUNNER24 Up Setup – at the very beginning – gives the market rise to start falling into the FOMC meeting rather sharply. The weekly setup states the same resp. allows this possibility likewise.
Next candle/week is rally week # 16. Last week (# 15) reached normally strong weekly arc resistance. The last candle dipped briefly above the lower line of the 2nd double arc that indeed was important uptarget in the weekly time frame. So, last week worked off a weekly uptarget!
Besides, last week closed exactly below the lower line of the 2nd double arc resistance not being able to overcome it on closing base! The market might fall now!?… where to?
==> Probably to the 1*1 Support Angle. The 1*1 Angle might newly be pinpoint tested back. The 1*1 intersects most exactly the 4525-4490 decade support for the week after next = # 17. The 1*1 Angle is exactly at 4515 for week # 17. Thereby, at 4520 can be begun to buy the next and likely last rally-leg into the expected intermediate bull high.
Be a part of our exclusive sworn GUNNER24 Trader Community – now... I try to protect your wealth!
- with daily trades – quick, safe and profitable…
- in well-chosen precious metals, commodities, indexes, currencies and in the best stocks worldwide...
- in both rising and falling markets…
- with little use of capital…

Click the button below and order the GUNNER24 Trade of the Day - $49.90 US a month.
 |
Be prepared!
Eduard Altmann