
As early as at the beginning of October crystallized that something was going completely wrong with gold whose "round" 1200$ Gann number magnet was to be reached till year-end for a mortal certainty. Then (free GUNNER24 Forecasts, 10/09/2016) the most different and attractive bounce targets, splendid sell-short areas could be identified for the 1200 attempt:
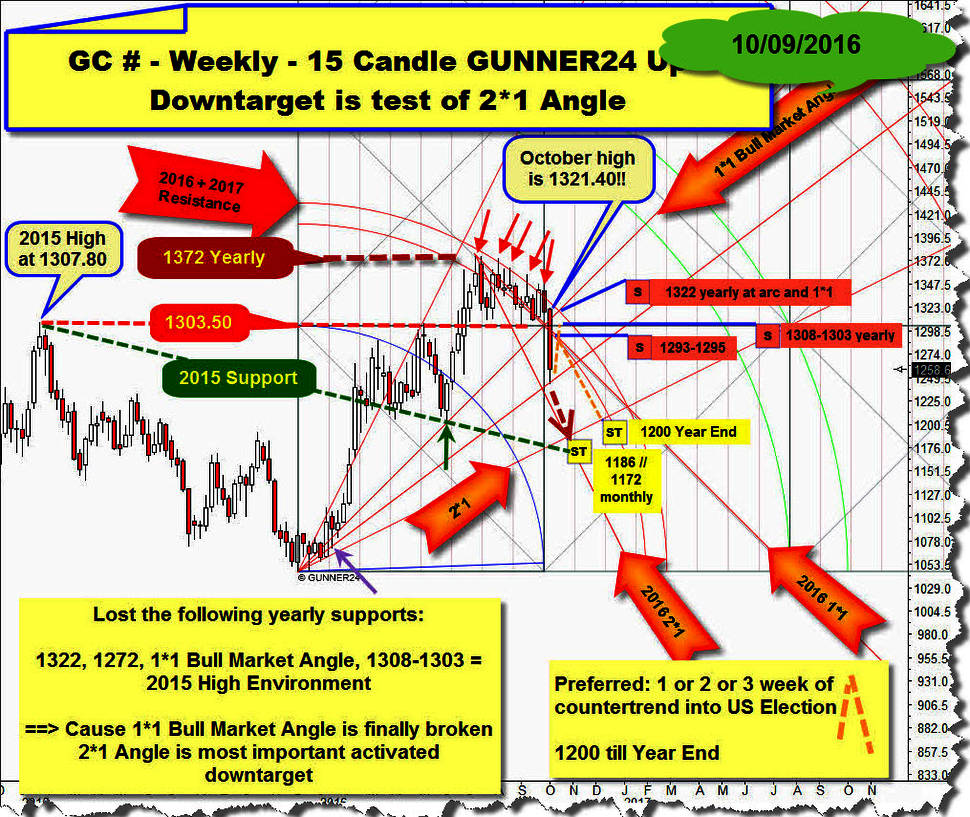
As well, the attractive 1186/1172 support magnet to be worked off was an option for the sell-off through year-end that was supposed to begin after the US presidential vote.
Someday by the beginning of November – and thereby shortly before the election!!! – it became clearer and clearer that gold is mercilessly caught in a weekly down cycle that orients itself by the Fibonacci number 21 – thus being doomed to keep on selling off at least till the trading week 11/28-12/02 in order to possibly deliver then a higher 1-year-cycle low:
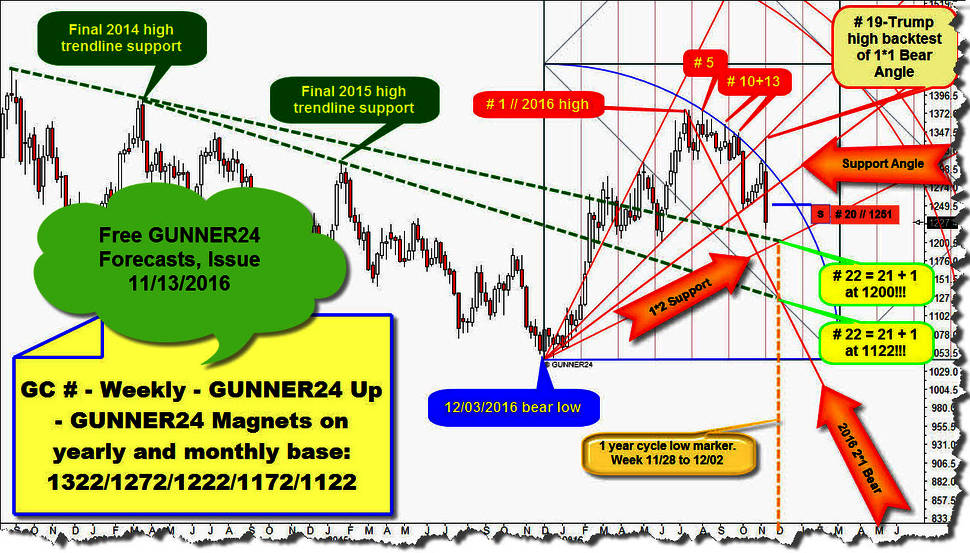
By the middle of November, 1200 was still the most logical downmagnet for the expected higher 1-year-cycle low…
But it was an option for gold to go lower, even much lower. Perhaps even down to the yearly 1122 GUNNER24 Horizontal Support, since at the end of such an important cycle, the emotions of the market participants use to fall into excesses that are actually uncontrollable, so even some strong supports are broken with ease and without much resistance.
1-year-cycle extremes - in the particular case and especially in the narrow and highly emotional gold market - tend to exaggerated panic, since the losses of the always long herd (Speculators) may get out of hand enormously fast…
==> That’s why to the analyst/investor/trader beforehand only the factor "time"= time analysis remains for the evaluation of a coming resp. a supposedly important cycle extreme to determine the extreme and thereby the change with a fairly high certainty.
For the time being, the overriding time factor (weekly count/assumption of a 1-year-cycle low) is telegraphing us: The final 1-year-cycle gold low was made at 1162.20 last week.
I think, with the Thursday (12/01/2016) 1162.20 low gold is most likely to have found a pretty sustainable bottom (at least in the short term) in the very first step, since the precious metal sector followed with some very positive Friday developments:
Some of the normally leading Gold and Silver Mining Stocks succeeded in leaving upwards their respective bottoming formations with the Friday close: ABX, AG, EGO, FR.TO, MUX, HL, GPL...
In particular the SILJ ETF = the Silver Juniors outperformed once again in a model way with the Friday close. They’re signaling now their inner strenght thus indirectly confirming a shortterm sustainable bottom in the precious metal complex:
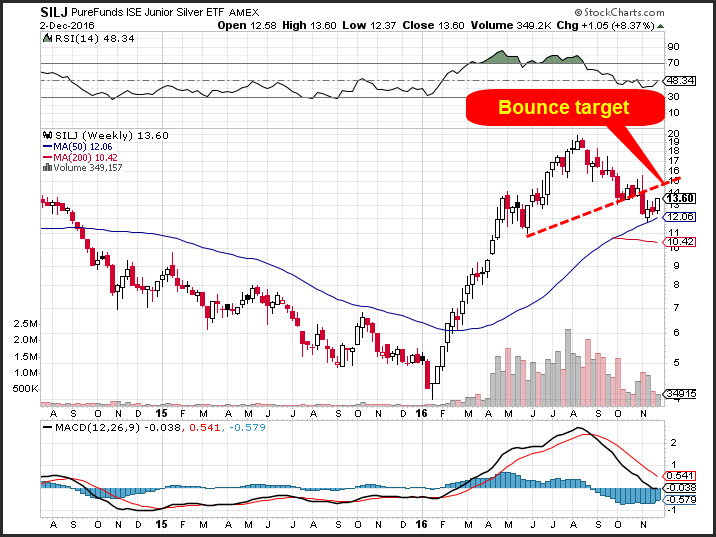
Source: www.stockcharts.com
The Silver Juniors were the leaders of the 2016 bull market rally, but they were also the strongest sector during the correction since they corrected the 2016 upleg by as few as a 50% apparently finding their shortterm bottom at the weekly 50 MA three weeks ago already.
For now, the past week high close is triggering upwards and backtest potential up to the red-dotted depicted former bull market support at about 15$-16$.
Furthermore pro-bullish is the observation that platinum tested successfully the "round" 900$ at the Thursday lows. Since, it nicely bounced upwards closing last week at about 930$.
In addition, the gold/silver ratio closed at the week low making us supposed beyond that silver will have to outperform gold during the coming days as well. This is always a sure sign that the precious metal complex is to be classified as bullish!
Now again back to the gold market and its possibly attained 1-year-cycle low however but also to its next intentions in the short and medium terms looming more and more now:
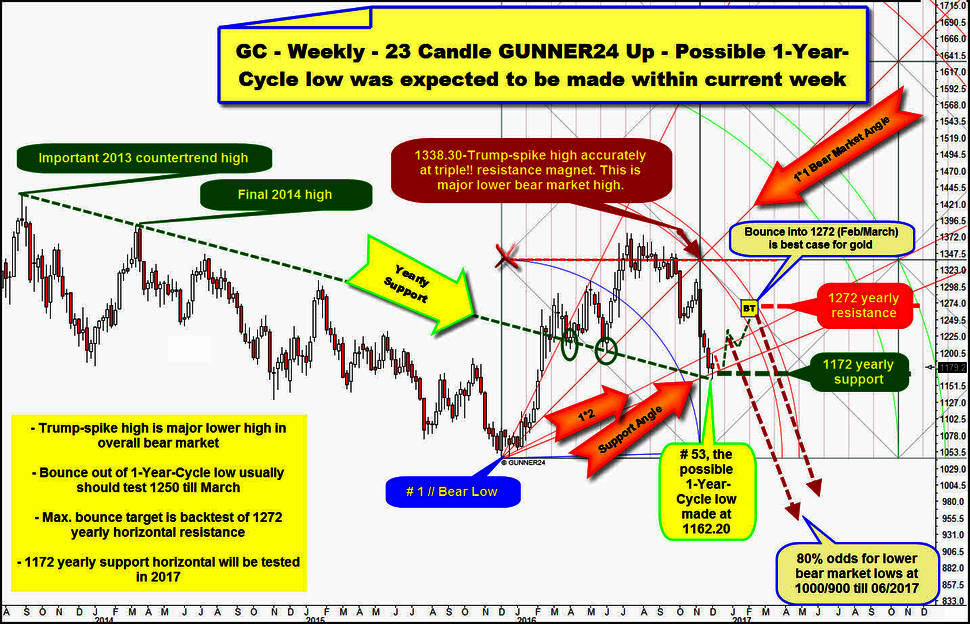
Exactly 52 week candles after the received # 1 December 2015 bear market low gold tested the falling yearly support that springs from the important 2013 countertrend margining the final 2014 high and being broken upwards during the 2016 rally as well as the extremely important 1172 GUNNER24 Horizontal Support in the yearly time frame.
Gold made an 1172 intraweek undercut low in the weekly time frame. Violating the yearly 1172 support horizontal smells like a bear trap to me because in the course of last week, gold tested three times the 1172 on daily closing base most intensely whose defense bore however.
Of course, the 1172 likewise held on weekly closing base in spite of the immensely important rollover of December 2016 to the February 2017 contract.
Ditto, with the November close of 1173.90 the 1172 could be defended on monthly closing base. ==> 1172 further on is important support in the weekly, monthly and yearly time frames!
==> At the supposed higher 1-year-cycle low, gold worked off and defended a combined yearly support magnet. So far…
It is s always suspicious to me when all three important precious metals together – gold, silver and platinum – show signs of life immediately after such blatantly obvious orchestrated futures contract rollover sell-offs AND when possible important lows are received at the very first trading day of a new trading month... This means generally that short-selling has ended with contract rollover, and the first days of the new month are allowed to bounce/rally/countertrend, whatever...
With Friday, gold succeeded in reaching both a higher high and a higher low compared with Thursday! This pattern confirms indirectly that a new daily upswing has begun at the lows of the very first trading day of December...
I don’t expect now the price fireworks to be displayed for the due daily bounce that is not supposed to last more than 5 to 7 days, at most. The expected gold bounce is more likely to run maximally into the new defined strong 1195-1200 resistance area before the week of FOMC (14th of December) will test the 1170-1162 intensely once again (small red-dotted line outcome). Then, not before the expected FOMC test of the current low surroundings, we’ll indeed have got the final confirmation whether the 1162.20 were "THE FINAL" 1-year-cycle low.
In any case, I expect gold to bounce upwards in the weekly time frame after the December 14 FOMC rate hike announcement!
==> Technically, the weekly bounce should be able to test again the 1st double arc resistance in the weekly 23 Candle up setup above, after the rate hike. That’s where the extreme resistances will newly wait for gold then. The existing main resistances for the year 2017 are A) the 1st resistance double arc and B) the 1272 yearly horizontal threshold.
The 1272 couldn’t be held resp. re-conquered in 2016. The gold year 2016 is likely to close far below the 1272!!! Thereby, there is no buy signal for gold in the yearly time frame. And thus no confirmation that the bear market has bottomed at the 2015 December low.
The 1338.30-Trump-spike high cracked vehemently into a triple resistance magnet molded with the first square line, the 1*1 Bear Market Angle and the lower line of the 1st double arc resistance. Since this negative test of the triple magnet took such a negative course, technically the 1st double arc is hardly to be overcome in the expected bounce! No, to a greater degree it’s supposed to keep on providing enormous resistance deeply into the year 2017. Really, at the next test of the 1st double arc the final year high of 2017 should have to be attained.
==> The Trump-spike high was the final backtest of the 2016 high environment thus meaning a major high and therewith a next important lower bear market high. Certainly, it rang in a new important bear market leg! Technically, gold is dead now with the ugly November 2016 performance.
So, in the best case up now into the major 2017 1st double arc resistance = backtest of 1st with probable year high between 1250 and 1272. As the moment for this extreme and the next lower important bear market low to ensue, I reckon rather March 2017 than February 2017.
After a spring year-high – since the 1st double arc should now be the most determining yearly resistance for 2017 – down again to another test of the 1172 yearly support horizontal. This one is not supposed to succeed in being defended any more at the next serious attack… therewith, all the dams would be breached. Then, in the further course of 2017 the actual 1045.0 bear market low shall have fallen till summer being reached and worked off the "round" 1000... at least!
==> So, at most 4 months of bouncing now: December + January + February + March. There and then the final 2017 high, likely at 1250 to 1272, afterwards thoroughly 8 more months of bear market through the next 1-year-cycle low, probably far underneath the "round" 1000!
==> The bounce is allowed to end at the 1222 yearly threshold already and perhaps as early as in January 2017. From such a "very early" 2017 high, some much deeper lower bear market lows would be deduced. In that case, perhaps the 800 would already be on the agenda for 2017.
Be prepared!
Eduard Altmann