„An irrational story…" was the only thing I perceived last week roaming about my head, how can it be that really everything is rising and performing great but just gold was beaten down during the whole week until the end? Stock markets top, silver, palladium, platinum – the other three precious metals were showing a top performance, US crude and US copper appearing with new buy signals, the US Dollar falling and the Euro standing right before the breakout of its consolidation pattern, upwards. How is it possible that in these absolute gold-positive surroundings just gold is dancing its November blues all alone?
It’s a divergence that happens rarely, to me not seeming normal – in such an extreme – and for now making ring all the alarm bells concerning the continuation or the power respectively of the uptrend on its way since May. The gold performance last Wednesday and last Friday reminded me heavily of the "relative weakness of gold" in December 2011 when the Big Boys permanently launched fanciful short-attacks with kinkily high contract volumes thus breaking one strong and important support after another without much resistance like a withered femoral in the course of that month before the low of the quarter # IV of 2011 was marked on 12/29/2011.
The volumes of the COMEX short-orders put into the market last Wednesday and Friday were so high that actually just a big central bank would be able to manage them… The gossip factory is on full speed, spreading: This time the Chinese are COMEX-short…
How long they want to hold this position is a different question, of course, so is which moment the Chinese are going to go paper-long again… The entire campaign may have been thoroughly just the matter of a very short-term action by the expiry day being shortened the December 2012 contract in order to get cheaper into the February 2013 contract. A fat rollover profit as it were.
Or the Chinese did what they like to do being clever merchants: Ostensibly they shorted the paper market in order to use the generated profits of the paper-shorts to buy from behind "cheaper" physically on large scale in London.
A super-clever merchant would go on using the very narrow and small gold market with its permanently present signal effect to prevent the raw materials that are much more important for China’s sensitive economy like silver, platinum, palladium, oil and copper from rising vehemently in price. For example, China always buys a 40% of the worldwide copper production. As a rule, because of the season especially oil and copper use to start strong rallies by end of November and the beginning of December. This year they seem to do so as well! Copper makes an average rise of a 10 % from December to March!
It’s totally important for China that copper doesn’t cut the records. So they have to buy without making a fuss about it, with little strides and little volume for not to drive up the price!
As you see, the reasons why gold is chased into the cellar are manifold. There’s "pretty little game money" and really zero risk… Who would brace himself against 7000 contracts of a short-order appearing all of a sudden? With this gold-hit, "billions" of US$ can be generated, directly and indirectly. This is at least what I would do if I were the Chinese central bank.
China is fighting against the west, or better: they are defending themselves. They are trying to keep the prices for raw materials down. They have to buy inexpensive raw materials to go on expanding solidly. So they have to slow down the raw-material prices. The profits are in the purchase. This is not only an old stock-market wise saying. No, the Chinese merchants have known that since 221 BC.
The west is creating money from nothing. There is more printed than allowed. The keywords are QE3 to QE741133 - indebtedness and Euro rescue. That leads to a a rise, a mighty rise of everything, because inflation is prevailing. The cheap surplus money has to be invested. Because of this inflation the commodities are rising, and the stock markets are rising in future.
Rock and Roll at the stock markets:
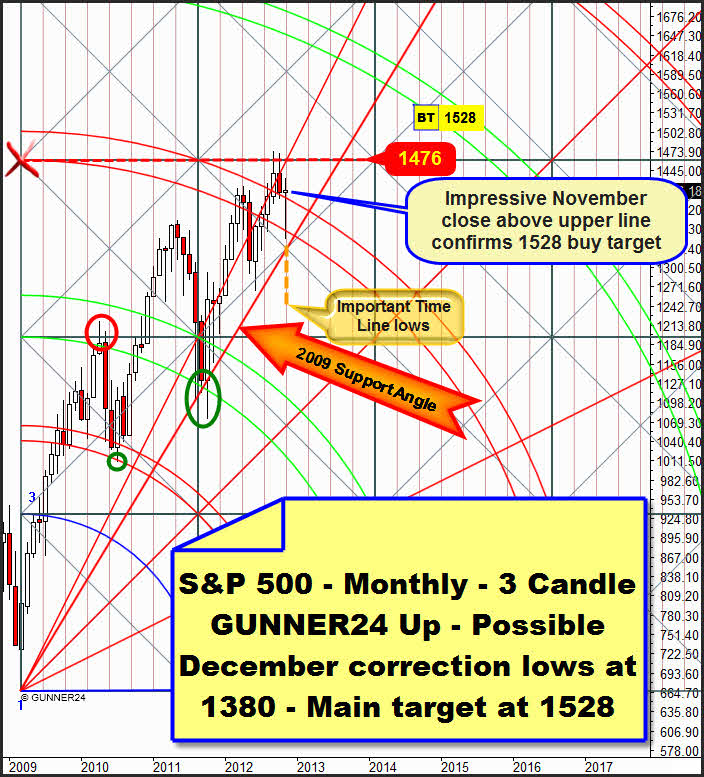
There’s nothing to find fault with the November 2012 candle. It’s a sock in the eyes of all the bears. The new close above the 3rd double arc confirmed again the main target of this swing, the 1528 points. It couldn’t have happened worse for the bears. November is exactly in the center of the passed square, on an "important time line". There are only three important time lines in a square: the left and the right square limits and just the center of the square. There’s a tendency prevailing to form important highs and lows or important turn points at important time lines. It’s obvious that in November an important low was marked. Now the swing is going to keep on 3-5 more months.
Correction targets for December are A) at first the 1400-1402, that’s where a strong weekly support is prevailing. If the 1400 are boken on daily base the 1380 – being an important weekly support as well – will be to be expected. At the latest from there the market is supposed to turn up severely again.
Beginning with December a correction is supposed to happen that is likely to last 8-10 days. The first starting point for this correction will be the actual swing high to be reached at 1420 until Tuesday. But if the 1420 are taken in the course of the week the 1434 will be likely to be reached. From there at the latest the correction will start. If the correction starts at 1434 you shall expect a maximum correction low at 1402.
After the end of the correction the 14-10 day Xmas and New Year’s Eve rally will start. You can work on the assumption that this rally may be extremely tough and violent. A monthly close above the 1467 horizontal is actually possible!
In the long run also the NASDAQ-100 will act in the sense of the timing analyzed above!
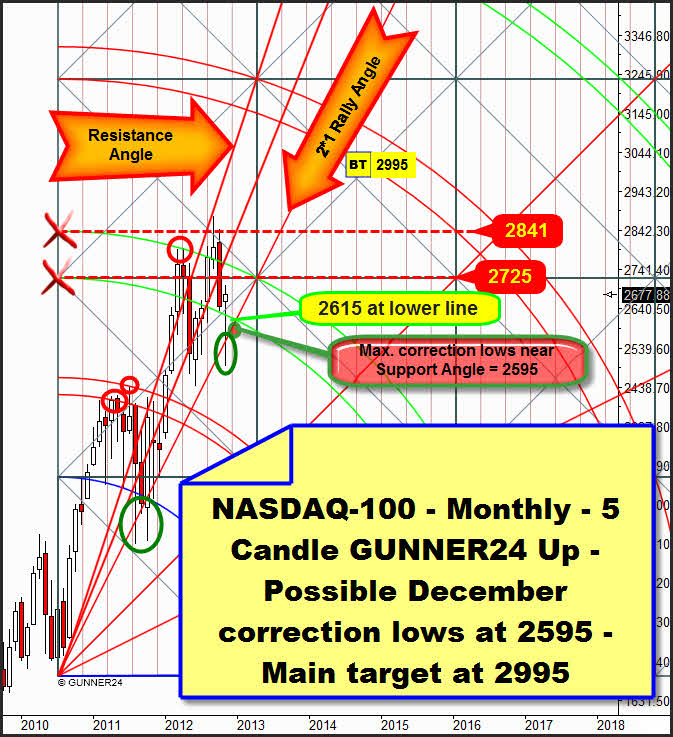
The correction in November fell below the 2*1 Rally Gann Angle about as far as the last important correction of the year 2011. Please pay attention to the lower green oval at the angle. The extremely long lower wick of the November candle is a sign of extreme support that the 2*1 Rally Gann Angle is still putting out. It will take a monthly close below the 2*1 to finish this uptrend.
November closed again within the 2nd double arc which is a sign of strength. Of course in this monthly setup the NASDAQ-100 appears weaker than the S&P 500 does in its up setup. Nevertheless we have to work on the assumption that the trend goes on pointing upwards. For December I newly expect a closing price above the 2nd double arc that passes at 2757 (upper line of the 2nd) for December. Maximum correction target is the 2*1 Rally Angle at 2595 index points that isn’t expected to be reached unless the NASDAQ-100 turns at the beginning of next week from the actual swing high surroundings – about 2690.
If the index cracks the 2690 at the beginning of next week it will be likely to reach the next important monthly resistance at 2725 next week starting its 8-10 day correction from there. You may expect in that case a correction low at the lower line of the 2nd = 2615.
What will we have to expect of gold and silver during the coming weeks?
I sketched it in the introduction. Either the uncommon gold behavior was just a single short-term story to switch cheaper into the new contract, or it was the beginning of something that makes December become a blood-red month for all the precious metals like it did last year.
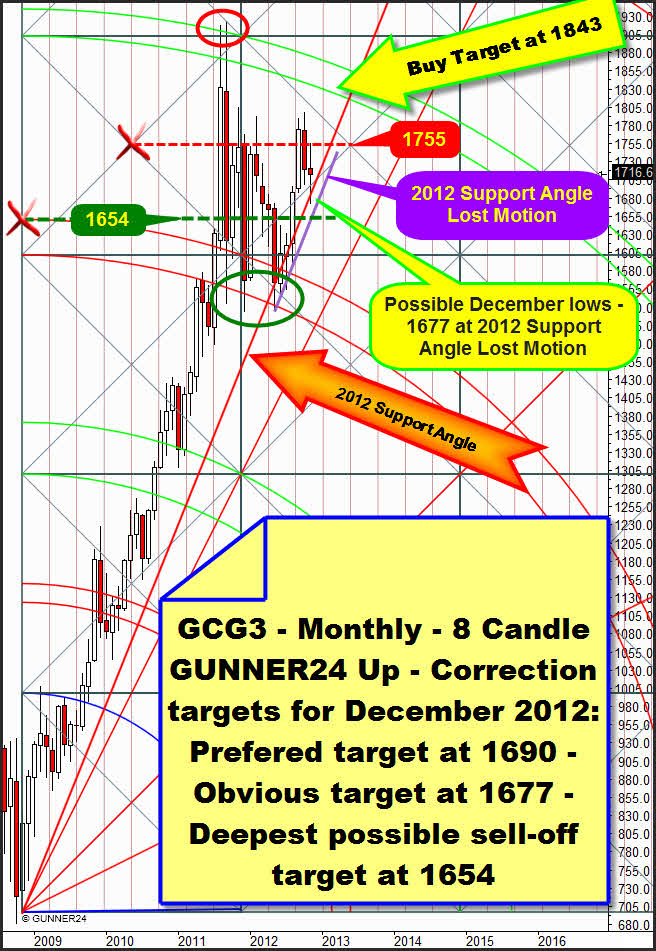
Last week I was completely convinced that the important weekly and monthly resistances at 1755 were to fall quickly. The week before last the weekly time frame still fired off a new buy signal. But this buy signal appeared simultaneously with reaching the monthly resistance at 1755.
There at 1755 there is the monthly resistance situated that was likewise analyzed in the last issue of the GUNNER24 Forecasts. And by virtue of the odd unnatural course of gold it’s obvious for all of us that gold is showing a reaction to the 1755 resistance. During one trading week a strong monthly candle became a weak candle with shows an unusual loss according saisonality. Two extreme sell-off days were enough to prove how important the 1755 resistance really is.
And unfortunately there’s the threat now that the losses of last week may extend because the monthly time frame is showing some weakness.
First the seasonality speaks for that. Over the last 30 years gold and silver have often shown a weak performance concerning the first two December weeks.
Secondly the daily time frame is still far from being oversold, so a lot may still come down… In terms of the indicators and the momentum the weekly and monthly time frames are pointing up. For me that means that any further sell-off in the daily time frame is not expected to result very deep.
But the dominating negative momentum in the daily time frame is well able to knock through the 1700 downwards next week. And then a strong sell-off possibly happens soon!
The very most important weekly support is passing at 1690$, and that is technically the lowest I can imagine. But if the 1690 fall on daily basis you may expect the 1677 to get to the 2012 Gann Angle Lost Motion. If this one falls on daily basis the 1654 horizontal support will take effect!!!
I’m sketching here a possible brutal sell-off – like the one that happened in December 2011. The reason is the severe reaction to the 1755. Where there’s smoke, there’s fire. The average negative seasonality of the last 30 years supported two more weeks of weakness. In addition, with the 34.49 highs of the week silver newly rebounded from its most important midterm resistance:
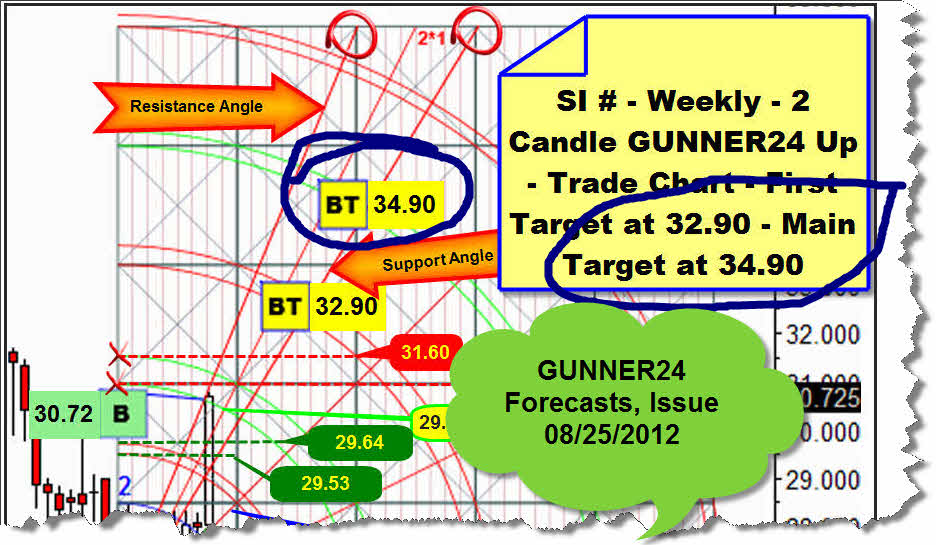
We haven’t considered silver intensely for a certain time in the free issues. Above in the weekly chart you see the expectations and targets of the upswing that started in July. Target was at first the 3rd, then the 4th double arc. For the first time the 4th was reached at the beginning of October, in the 15th week of the swing, then a correction started that finished in the 20th week of the swing. A strong upswing newly followed. On Wednesday the strong resistance that the upper line of the 4th radiates was newly reached:
That doesn’t look well. It seems that silver had to reach its most important Gann magnet after gold. The last candle is clearly showing reaction to the upper line of the 4th. In addition, the Fibonacci count is giving the feeling that something awful is going to happen. With the rebound frome the clearly existing 1*1 Gann Angle support to the 34.49-highs at the 4th five weeks passed. Furthermore in the daily silver is absolutely overbought, and now it may last as many as two weeks till this condition is cut back. It may have been an important high. And that may lead to two more weeks of weakness!
A weekly close below the Support Angle we can see above will newly activate the 1*1 Gann Angle Support. This one will pass at 31.70 the week after next. A mighty sell-off in silver may start when the 33.30 are newly fallen below.
Silver may fall now severely. But really it can just on daily basis. The weekly and the monthly time frames are clearly pointing to the supposition of one only temporal weakness in silver. About this, please pay attention – among other things – to the long-term weekly candle count:
First swing highs happen in the week # 15 of the swing. Then the super-important correction low in week # 20 of the swing. The proximity to the important Fibonacci number 21 is indicating that the upswing isn’t likely come to an end before it will be near the next important Fib number, the 34, where it is supposed to find its swing highs in terms of the price and time, by the end of February 2013. We’ll have to keep on expecting the possible swing highs at the 5th double arc, or even at the maximum extension of the weekly 2 candle up setup above.
The GUNNER24 Gold Trader will provide you with the critical knowledge you need to forecast and analyse the precious metals with the GUNNER24 Forecasting Method. All the GUNNER24 Trading Signals you receive real-time are based on the actual Gold and Silver Future. The NEW GUNNER24 Gold Trader is a must for every actively working investor and trader who wants to trade successfully in everyday trading. The insights you receive from the head trader Eduard Altmann (and discoverer of the GUNNER24 Forecasting Method) are truly amazing sometimes. I promise!
Click the button below and order the GUNNER24 Gold Trader - $39.90 US a month. For 201 members and up - $49.90 US a month.
Be prepared!
Eduard Altmann


