
The last time we had a look at the actual gold and silver situation was two weeks ago. We ascertained that also this time gold and silver would stick to the seasonality well-known for decades. A significant low in October, followed by a 4-5 month rally, until it gets to a significant high in January/February of next year, followed by a several week consolidation/correction in the upwards trend.
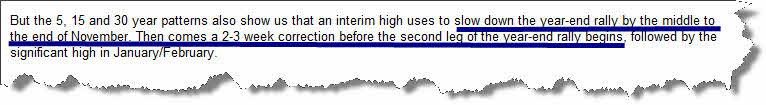
Further we analyzed that a 2-3 week correction in the upwards trend was imminent within the 5, 15 and 30 year pattern until the middle/end of November:
Here are again the historical patterns for gold in the period of time from 1974 to 2010:
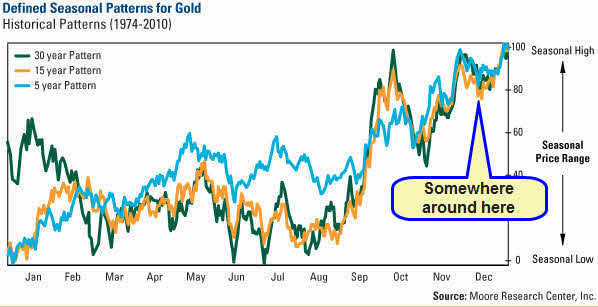
(Source:www.mrci.com)
The correction of the November high will have finished by the end of November/beginning of December, I suppose. Gold continues sticking exactly to the seasonal schedule, as I see it. The question is now: Is it going to be a two or a three week correction?
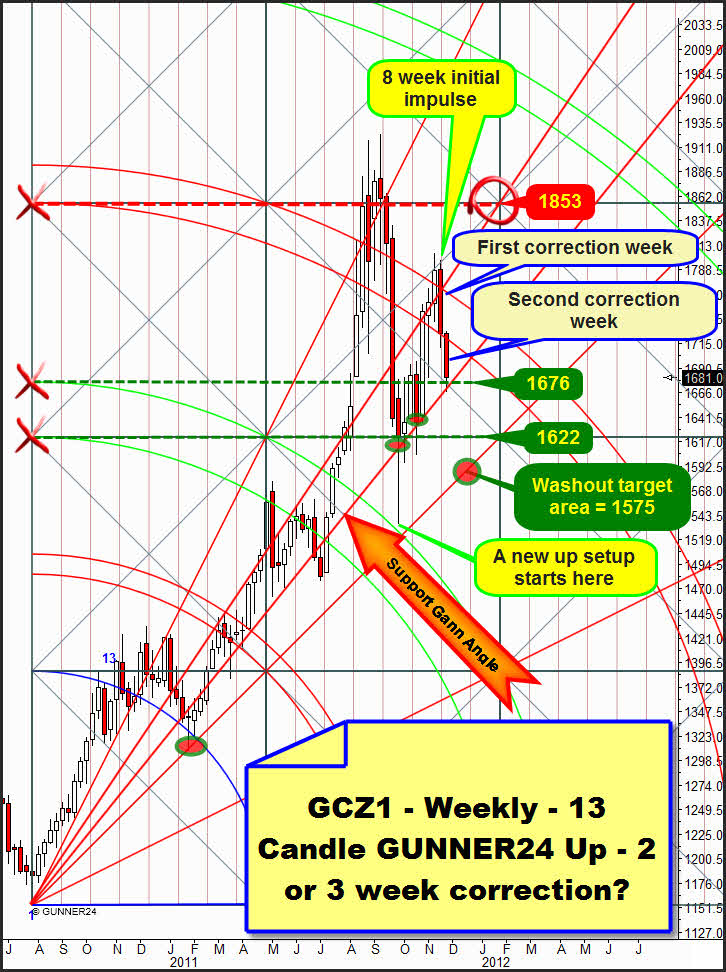
My prediction that the 3rd double arc would provide a very strong support at 1740-1750 turned out to be wrong in the actual weekly 13 Candle GUNNER24 Up. And the top of the new 8 candle initial impulse wasn’t developed in the 8th week at 1853. The top of this setup was marked at 1804.4 in the 7th week. Thus the picture that results from this setup has turned very negative. That is clearly shown by the closing price far below the 3rd double arc. We can see that the strong support Gann Angle newly hindered gold last week which was the second correction week. So the current correction MAY have finished. But the correction may go on next week – that would be the 3rd correction week. In my opinion, a strong evidence for another correction week is the conduct at the weekly close on Friday when gold sold off almost 18$ within the last three trading hours. This extremely poor weekly close is a sign that the low (1667.1) of last trading week is most likely to have the aim of being tested once more.
A dayly close underneath 1670 or below the support Gann Angle respectively makes very probable the 1622 to become the first target. Even the 1600 environs are threatening and so is perhaps a touch at the 1*1 Gann Angle that is expected to provide an ABSOLUTELY STRONG SUPPORT!
If gold decides to correct the weekly 8 candle impulse in the third week the 1940 target for the end of January/beginning of February will have been solved (you may read here again the derivation of that target). The maximum target for the next important high will rather be the 1870 environs in that case!
Why 1600? Why maybe 1575? Why washout?
By tradition the Thanksgiving week is a strong week for the equity markets, this year it isn’t. 1. A divergence. 2. The equity markets are in an absolutely bad state, but like gold and silver they’re totally oversold on daily basis. This condition may still last a few days possibly ending up with a washout/sell-off before the traditional Christmas rally can start here, as well. 3. The break of the actual weekly support Gann Angle in the weekly 13 Candle GUNNER24 Up on daily basis above would make the next important Gann Angle at 1575 become the next target (the 1575 are the maximally possible down target in case we’ll see a crack next week!).
And 4. now: The monthly support Gann Angle in the gold month setup for December is lying at 1608:
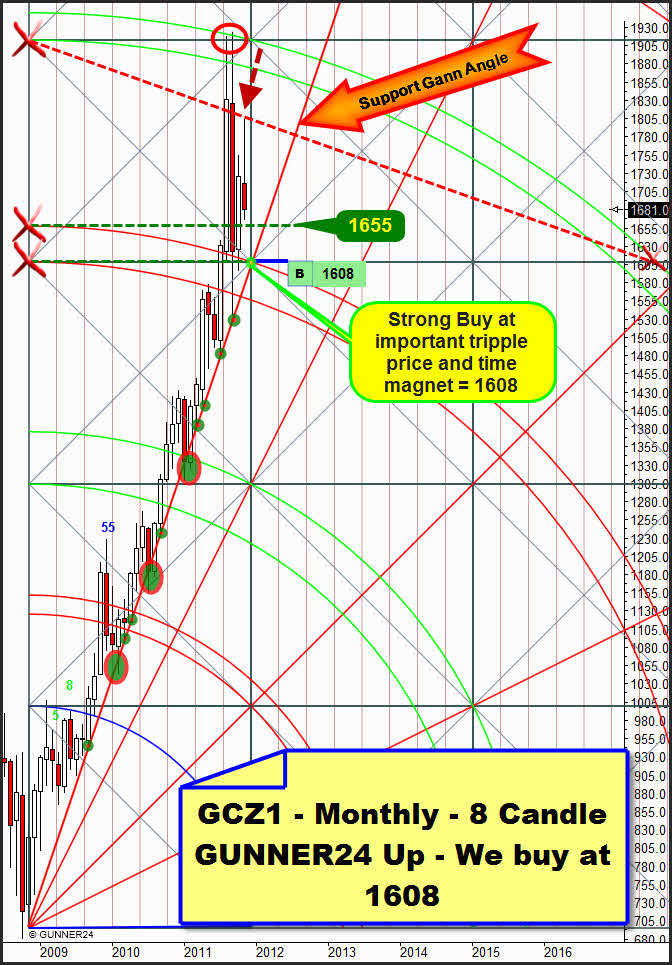
Counting precisely we realize that the upwards trend that is under way since the end of 2008 touched eight times pretty exactly the monthly support Gann Angle (small green/red circles) rebounding from it. For December this angle passes at 1608 which is a so-called triple price and time magnet. At 1608 the lowest horizontal support of the just passed square is meeting the upper line of the 3rd double arc and the support Gann Angle. It stands to reason that triple magnets have more force of attraction than double or single magnets. Three times gold dipped strongly beneath the support Gann Angle (big red/green ovals). The 1575 would facilitate a repetition of such a conduct!
I always like to consider silver in a context with gold - even though actually silver is not rendering a "safe haven" play like gold but rather orienting itself parallel to the equity markets or to the US$. But of course, frequently it is also orienting itself by gold – on hourly basis and for days or weeks. That doesn’t really simplify the analysis at the moment because the interactions between equities, gold and US$ aren’t just easy to be assessed and certainly they are only vaguely predictable.
That’s why at first I’ll analyze the charts and the setups. I’m trying to be super neutral working out the highest probability the way I see the GUNNER24 Status Quo.
Admittedly the problem with silver is always its state as a commodity or respectively a market that has led to the ruin of the very most traders and accounts. It is often too imponderable and lethal. That’s why – supposing a possible washout/sell-off – in this case we can work on the assumption that blood will be shed in the streets and some very low down targets will possibly/will have to be headed for if some weekly and monthly supports are broken through from one hour to the other…
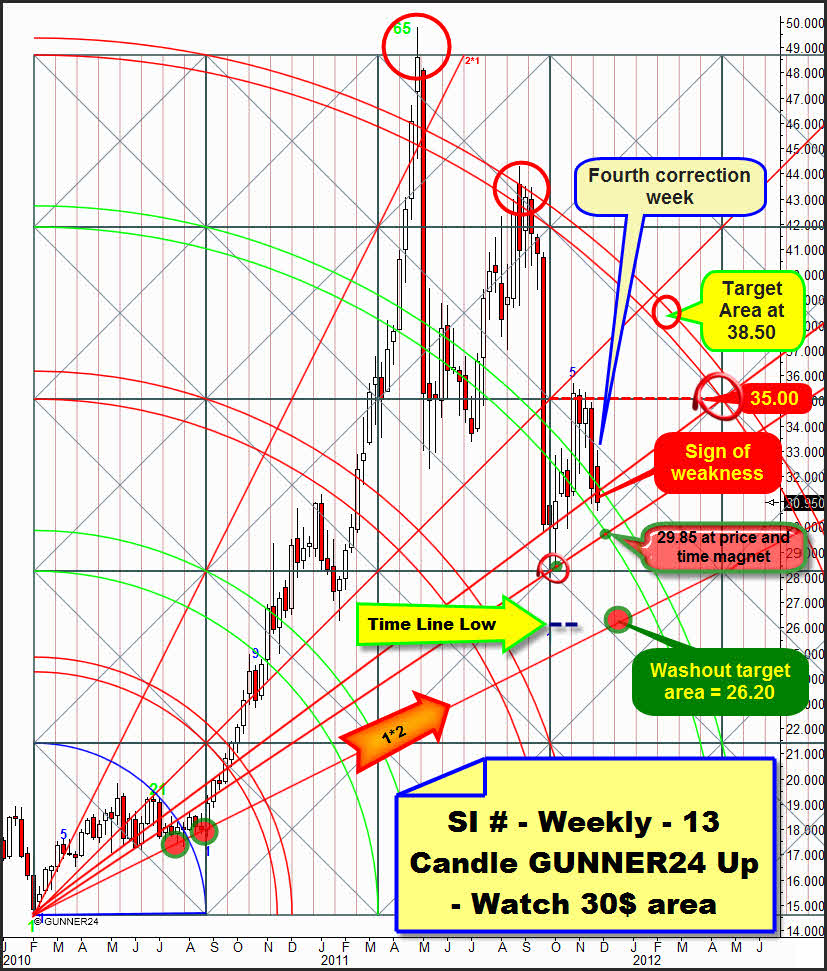
On neutral consideration, in the weekly 21 CandleGUNNER24 Up Setup the 4th double arc is providing a support that is currently followed downwards by silver. My experience has shown that this 4th double arc shall not be broken downwards by a 70-80%. Silver is visibly following the double arc support downwards, and it’s supposed to keep on doing so next week as well. This would be the fifth correction week in which we may expect an end of the correction. The most obvious target are the 29.85 at the price and time magnet (intersection point support Gann Angle and lower line of the 4th double arc).
But look out! This target should only be headed for if silver closes below 30.65 – the low of last week – on daily basis! Intraday the 30.65 may be undercut narrowly! Likewise gold may make a narrowly lower low than the 1667.1 of last week. There’s no problem with all that, narrowly lower intraday lows are allowed. They’re possible and they would ideally go with the silver- correction count (5 weeks of correction in silver!).
Like in gold the Friday close was very poor finally leading to the break of the actual support Gann Angle = sign of weakness! Even though frequently we mustn’t trust this very thin Friday trade concerning the break of supports and resistances we should always recall that somewhere a fire is burning when we can make out smoke. That’s why the 29.85 are absolutely possible next week – in case of a daily close below 30.65.
Also the actual month setup is indicating the 29.85 area as a possible target:
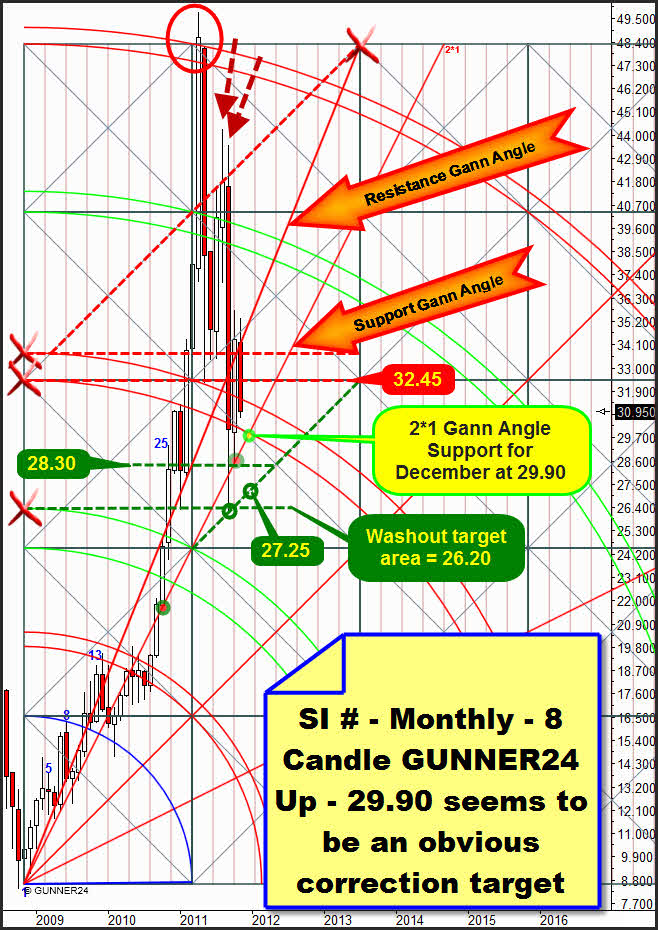
Actually, a visible time and price magnet at 29.90 is passing for December. It’s at the intersection point between the actual support Gann Angle and the lower line of the 3rd double arc. All in all here, too, it’s a sign of weakness that the November candle now is noted again within the 3rd double arc. But a new strong rebound from the support Gann Angle is thoroughly probable – keeping the seasonal patterns in the back of our heads.
But if the 29.90 area breaks on daily basis – that might happen in case gold really wants to head for the 1600 area again very much will be possible downwards, various supports on monthly and weekly basis are present – please note that down for your day and intraday trading. The maximum washout target is supposed to be lying at 26.20. It is signaled as to be an important support as well in the actual weekly as in the monthly setup. In the weekly 21 Candle GUNNER24 Up it is exactly at one of the three most important Gann Angles (1*2), in the monthly setup it is located at a horizontal support that already stopped the September sell-off.
You best register with our GUNNER24 Gold Trader now. That’s where we oversee the optimal entries and exits for you. Especially in the difficult market situations where many factors have to be considered the Gold Trader is backed by the additional GUNNER24 Signals based on the combined 1, 4 and 8 hour setups to catch the optimum entries and exits.
|

The GUNNER24 Gold Trader will provide you with the critical knowledge you need to forecast and analyse the precious metals with the GUNNER24 Forecasting Method. All the GUNNER24 Trading Signals you receive real-time are based on the acual Gold and Silver Future. The NEW GUNNER24 Gold Trader is a must for every actively working investor and trader who wants to trade successfully in everyday trading. The insights you receive from the head trader Eduard Altmann (and discoverer of the GUNNER24 Forecasting Method) are truly amazing sometimes. I promise!
Click the button below and order the GUNNER24 Gold Trader - $39.90 US a month. For 201 members and up - $49.90 US a month.
 |
Be prepared!
Eduard Altmann