
For as many as 16 months the 1755$ mark has been accompanying us. Again and again we could employ the 1755 as a signal transmitter within different time frames. Now and then the 1755 had an effect as support, though for the last 16 months it has mostly exercised a tough resistance function. Within this period, only two monthly closings above the 1755 resistance succeeded. Once it was in August 2011, the other time it succeeded a pretty short time ago, in September 2012:
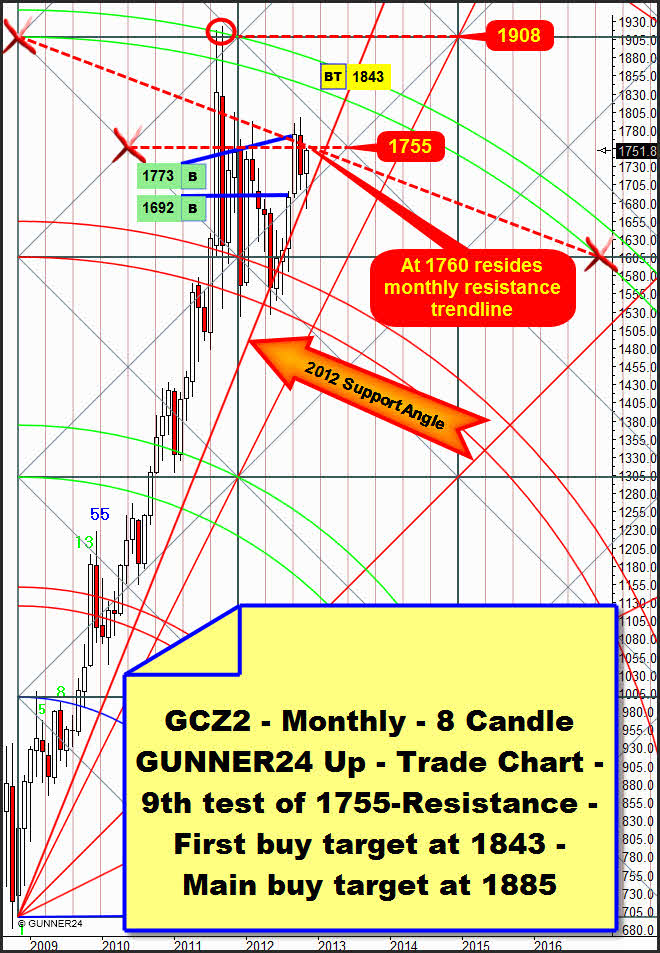
Not before gold cracks the 1755 resistance horizontal – the center of the just passed square – with two consecutive monthly closings above, the center of the just passed square will be supposed to mutate to a very strong support horizontal on monthly basis. That may happen at the earliest by December 2012 in case November and consequently December 2012, too, close above 1755.
Any November 2012 close above 1755 would newly confirm the 4th double arc (exactly at 1843) as the first target for this move. If gold finishes above 1755 as well in November as in December that would be a monster buy-signal on a very long term which thus would be likely to make the 4th double arc look just as a "pretty thin-skinned resistance area".
That means that the whole area of the 4th double arc starting at the lower line of the 4th and coming to an end at the upper line of the 4th (for December 2012 between 1835 and 1875) is expected to be overcome permanently within 6 months or so, looking at this resistance area by the end of 2014 for instance. I.e., through May 2013 we can thoroughly look forward to +2000$. Later in 2013 the 4th shall be re-tested from the 2000$. But on monthly basis it is supposed to hold clearly because a monthly close below 1790 will hardly be to be expected then. On the long term the 4th will mutate from being a resistance to become a support area.
The 1755 will fall soon… next week, at the latest the week after next…
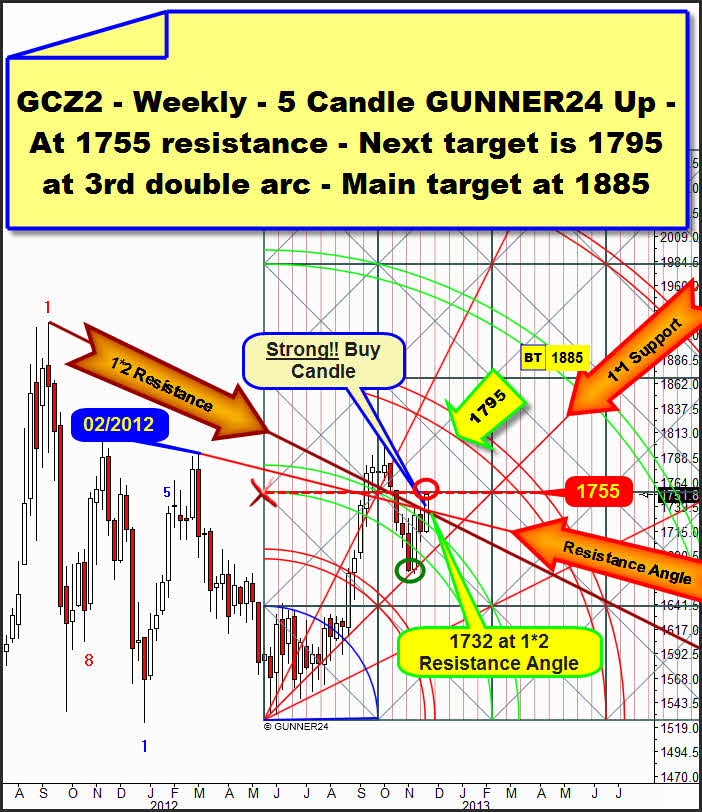
For the chains were burst that the very important and strong 1*2 resistance Gann Angle starting from the all-time high had put on. After as many as 10 days of consolidation below the all-time high 1*2 resistance angle, a lot of up energy is now supposed to develop.
Furthermore, starting from the 02/2012 high und the upper line of the 2nd double arc in the weekly 5 Candle GUNNER24 Up Setup, the resistance Gann Angle was overcome simultaneously. Thus a mighty buy signal was generated on weekly basis. Next target in the weekly time frame is now 1795 at the 3rd double arc. Pay attention to the Cup and Handle trigger at 1800 in the chart at the bottom!
The main target put out by this setup are 1885 until February 21, 2013. Riskless entry on daily basis for next week will be the possible back-test of the 1*2 resistance angle at 1732!
It’s no fluke that exactly the 1755 resistance horizontal coming from the intersection point of the lower line of the 2nd was reached with the beginning of the setup in the week-high. There is a coincidence in the monthly and in the weekly time frames.
When the most different expansions of the very first initial impulses in both presented up setups, in the monthly and in the weekly time frames coincide in one price at a given time we call it a price and time magnet or a Gann Magnet. In case of price and time magnets we always have to reckon that:
A) The existing trend ends because the touch with this magnet may lead to a turn because an important target has been reached.
Or B) the existing trend continues accelerating again if the correspondent Gann Magnet is overcome. As a rule, by overcoming an important price and time magnet a lot of energy is being released.
As mentioned above already, in the actual case the 1755 resistance is expected to be overcome pretty fast, also because another – the most important – weekly gold GUNNER24 Up Setup is signaling so now:
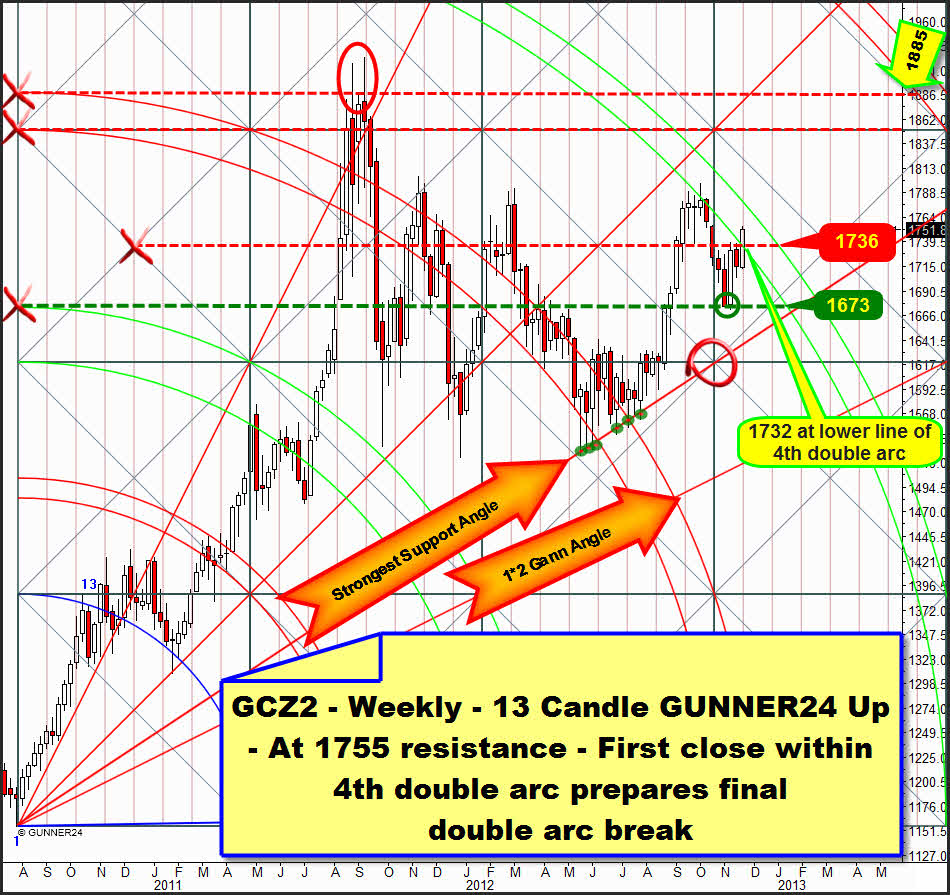
For the very first time gold closed within the lines of the 4th double arc in this setup. The resistance of the 4th begins to melt because in an up setup the closings within the lines of a double arc is a harbinger for their final break! Gold may hesitate now one or two more weeks with the final break of the 4th staying within the lines of the 4th during one or two weekly candles. But the next weekly up target of 1795 is really just a question of a very short time. At the latest till Christmas 2012 the fourth, decisive test of the 1800 area should occur.
The up potential for the actual gold uptrend till spring 2013 is "gigantic", from my point of view.
For fathoming out the possible spring 2013 tops, apart of the W.D. Gann method also the conventional chart technique helps us. The big question for us will have to be of course: "Is it truly going to appear as the following H-bomb is developing and feeling??":
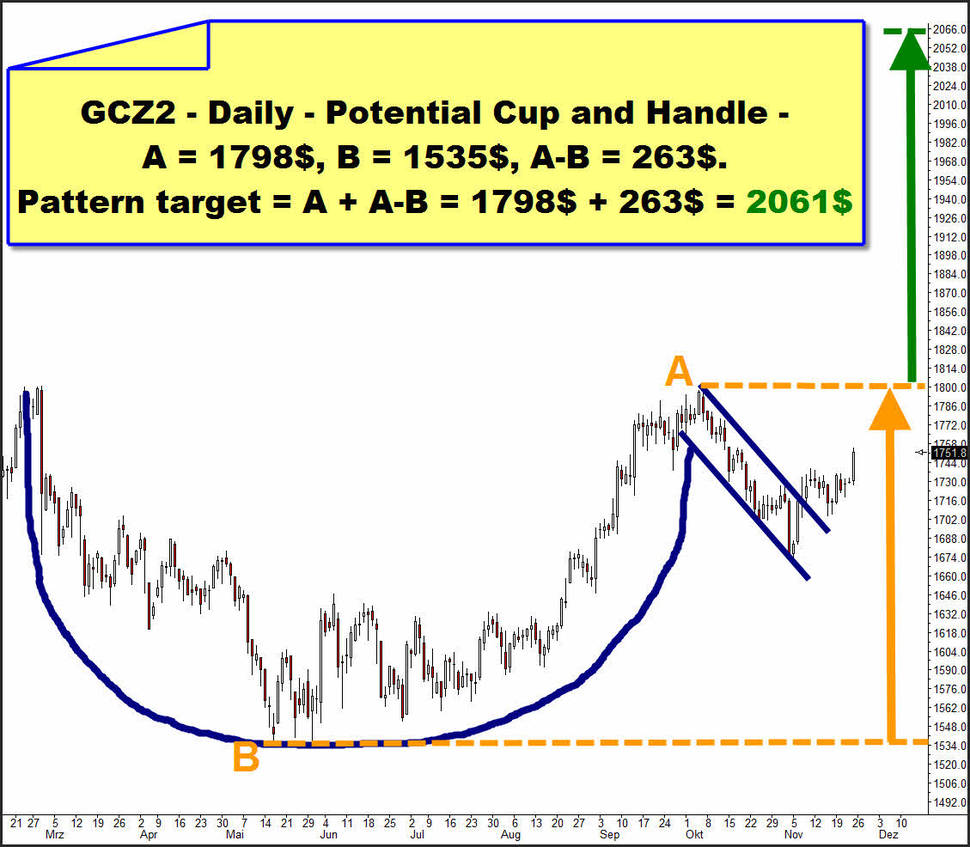
So far the extremely bullish Cup with Handle in the daily chart has been developing like in the text book. In this pattern it takes an average of 23 trading days in the daily chart until the handle has formed completely. For gold it took 25 days until the upper resistance trendline of the handle was broken. On Friday the consolidation that had followed the handle breakout was left upwards. The rise back to 1800 is now underway.
Not before the 1800 resistance is finally broken, the Cup with Handle pattern will be confirmed, and thus the probably maximum up target at 2065$ will be finally activated as well.
This 1800 may thoroughly hold until February 2013, but from my point of view something like this is not very likely: Strong seasonal influence, the GUNNER24 Weekly Setups fire off one buy signal after another. Overcoming the monthly 1755 resistance will activate a GUNNER24 Minimum Target of 1843… The GUNNER24 Main Target is situated at 1885. But if this really happens holding the 1800 until February, the outlook for all the precious metals – respecting the whole year 2013 – will be rather dreary for the time being. In terms of chart technique in that case a quadruple top at 1800 would be present involving considerable downwards potential – not only for gold.
You best register with our GUNNER24 Gold Trader now. That’s where we oversee the optimal entries and exits for you. Especially in the difficult market situations where many factors have to be considered the Gold Trader is backed by the additional GUNNER24 Signals based on the combined 1, 4 and 8 hour setups to catch the optimum entries and exits.
|

The GUNNER24 Gold Trader will provide you with the critical knowledge you need to forecast and analyse the precious metals with the GUNNER24 Forecasting Method. All the GUNNER24 Trading Signals you receive real-time are based on the actual Gold and Silver Future. The NEW GUNNER24 Gold Trader is a must for every actively working investor and trader who wants to trade successfully in everyday trading. The insights you receive from the head trader Eduard Altmann (and discoverer of the GUNNER24 Forecasting Method) are truly amazing sometimes. I promise!
Click the button below and order the GUNNER24 Gold Trader - $39.90 US a month. For 201 members and up - $49.90 US a month.
 |
Be prepared!
Eduard Altmann