
Things are going according to plan. Stocks and gold and silver are operating like clockwork, magically keeping on being attracted by their respectively determining magnets = targets. The stocks have to rise, and both metals – still – have to fall.
As to the timing, with the coming week gold and silver are going to have their next big chance for a change. Whether such a change will be sustainable is quite another matter…!! Stocks may top next week as well, taking a little break in the uptrend. But I rather suppose them to put down the next important interim tops by the beginning of the week after next turning afterwards.
The absolutely safest US stock market rally of every year – due to their timing band – uses to start two weeks before Thanksgiving mostly finishing one day before or one day after Thanksgiving. Thus, this time it would be Wednesday 27 or Friday 29. But both GUNNER24 and the strength of the bull-run are pointing to an interim high on December 2 or 3.
After these interim highs the markets are likely to consolidate at least 3 but rather 5-8 days at a high level or slightly correct before the X-mas rally starts. In the process, the US markets have very good chances to close at the year-high 2013, maybe even to a T, on the last trading day of the year, Tuesday 12/31.
An unequivocal clue on which floor the year-highs 2013 and the first interim high in 2014 (first or second trading week in January) are to be expected is put out by the GUNNER24 Forecasting Method on the NASDAQ-100. They are likely to be at, I suppose them to be closely above the highs of the Thanksgiving rally that is now coming to an end soon.
The NASDAQ-100 is expected to finish the Thanksgiving rally at 3467 within the next 6 trading days:
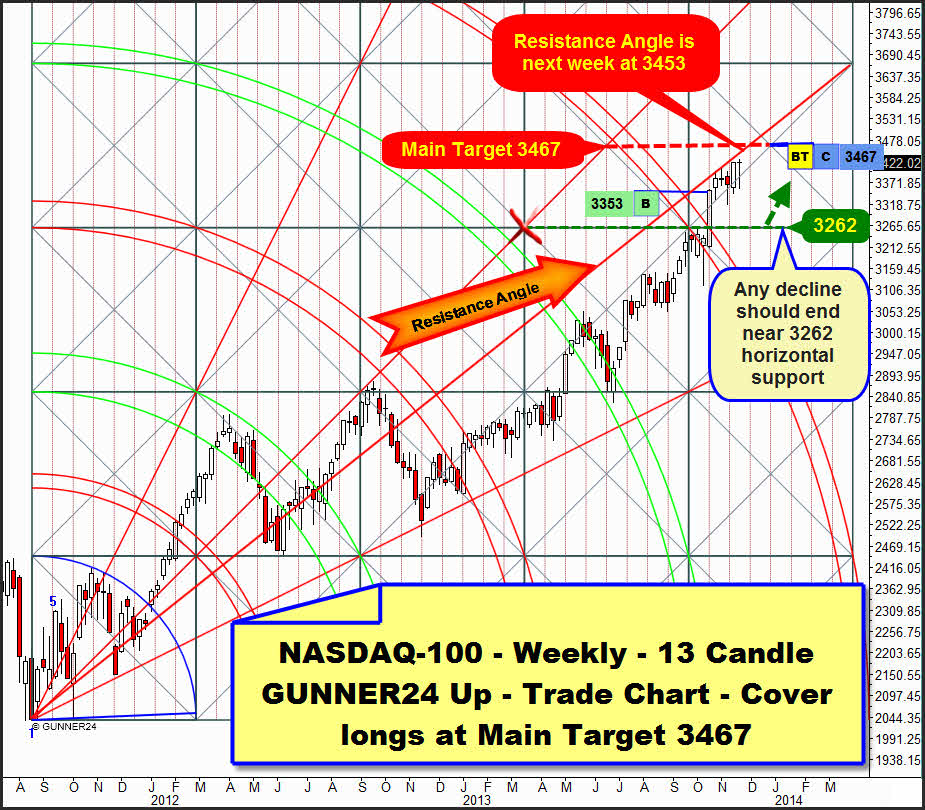
Correspondingly we will cover there our weekly long-position we triggered on 10/18/2013. The 3467 index points are the main target in this weekly setup. They are situated exactly at the center of the just passed square becoming the next important main resistance next week and the week after next since the Resistance Angle will intersect this horizontal the week after next. Thus the 3467 are depicting an important attraction point for the price. It’s a so-called Gann Magnet, in this case an important resistance and most likely turning and topping point.
Since the last weekly buy signal, the final break of the 5th double arc resistance 6 weeks ago the market has been struggling up, clearly losing impetus. The Resistance Angle is marking an obvious limit. Technically the NASDAQ-100 cannot go beyond. The market is only just sustained by the positive seasonality…
…and when time will be mature this rally will finish. Probably it will after reaching the 3467 the trading week after next.
Above I mentioned that in terms of time a correction or a decline will be to be expected then that will last at least 3, but more likely 5-8 days. In the NASDAQ-100 we may work on the assumption that it will rather tend to 8, 9, 10 days, for this market is clearly impoverished. It may frighten many traders during the imminent weakness phase, thoroughly falling pretty low onto the strongest weekly support to be seen in the chart above – the lower line of the just passed square - to 3262. At the latest from there the X-mas rally should start that is likely to drive the market to the 3467 or a little higher again till the year-end 2013.
Regarding its condition the S&P 500 is clearly doing better, and it’s better prepared for the 11th and 12th round. Concretely: The 11th round – correction/consolidation of the Thanksgiving rally – is likely to turn out poor and lukewarm correspondingly finishing the 12th round more forcefully than in the NASDAQ-100:
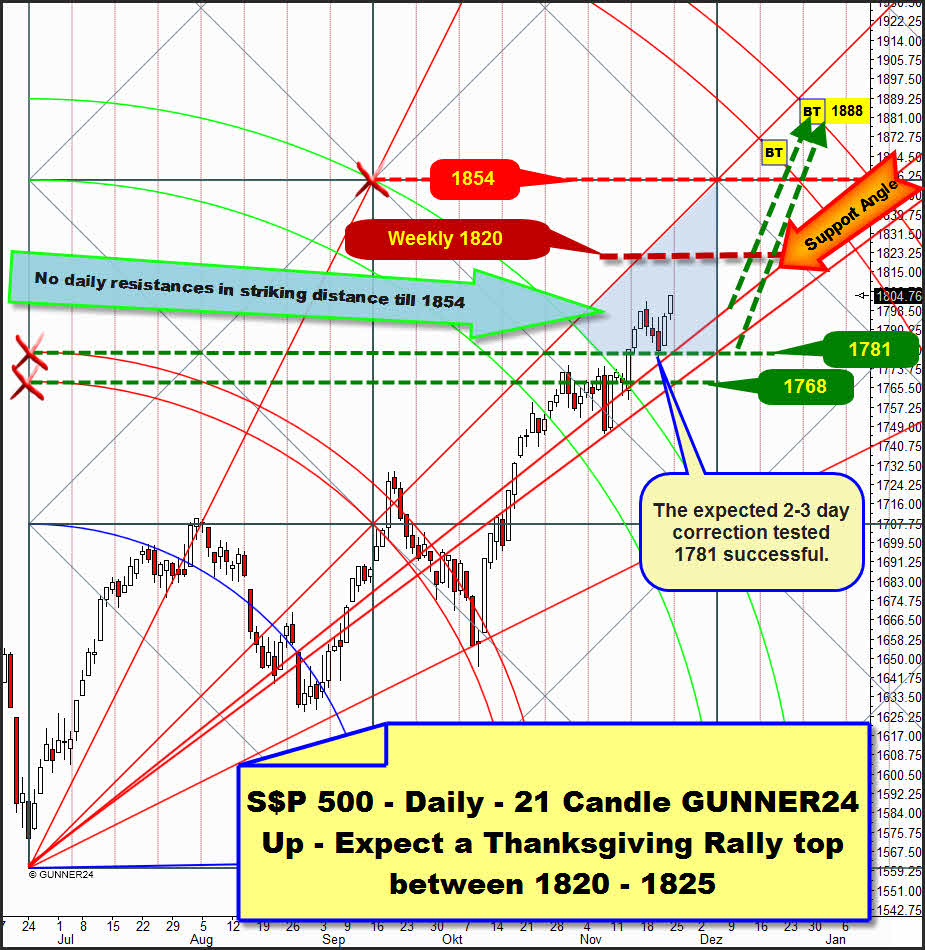
Let’s have a look at the daily 21 candle up setup that is currently determining the market most of all. The S&P 500 broke the 2nd double arc clearly upwards on Wednesday of the week before last – a new buy signal. Main target for this swing is reaching the 3rd double arc in trend direction.
Last Sunday I gave a good, extensive talking to the S&P 500. All in all 4 possible high potential price targets were worked out where the market will top out at the beginning of 2014: 1854/1864/1880/1889.
Among other things I observed that all the important time frames – the daily, weekly, monthly ones – were going in trend direction in total harmony. Everything was on go and without any disturbance. Furthermore, most compellingly I recommended you to buy the market at 1781 within the 2-3 day mini-correction to be expected for the beginning of last week.
From Monday to Wednesday the market corrected narrowly onto 1277. Then it took off for some new all-time highs. On Friday it closed at narrowly 1805 being now on its way to the expected Thanksgiving target at 1820. The 1820 are a strong weekly horizontal resistance being yet supposed to offer just marginal resistance. Here’s the derivation of this resistance.
In the daily setup above I marked for you the currently important dynamic space zone in light blue. At the moment, the market is in the upper half of the right square-triangle where the price is always allowed to carry out quick moves in trend direction. There isn’t much to detain it, to put on the brakes, according to the GUNNER24 Doctrine. So to speak, it is trading in the vacuum where the trend always may and often has to accelerate.
That’s why any daily close above the 1820 will make the chase of the main target, the 3rd double arc, go off.
The S&P 500 is likely to overshoot closely the 1820 intraday – 1823-1825 – before from December 2/3 it will be allowed to fall on the Support Angle marked in the chart above. That’s technically where the X-mas rally should start from, hence about 1800. If it goes lower this would be just to the daily 1781 support that is extremely strong now. A daily close above 1820 in December will activate the mentioned 1854/1864/1880/1889 till the beginning of January 2014 in that case.
There’s fire in the hole now. Again gold produced a new powerful sell signal on weekly and monthly base. The extremely important 1251 October low was fallen below on Wednesday. In the determining weekly 5 Candle GUNNER24 Down Setup starting at the October 2012 highs the 5th support double arc is clearly broken by the weekly close of 1242.90. Thus the weekly time frame activated some new correction lows. The next weekly downtarget is now at 1169 to 1159 not being unlikely to be reached before the end of 2013.
Only the monthly time frame is able to offset this weekly sell-signal if it finally shows strength once. But unfortunately during the last 3-4 years the weekly time frame has clearly been dominating gold and silver with its signals. Actually, from now on only praying may help. Perhaps silver may as well. Otherwise gold will close at fresh year-lows:
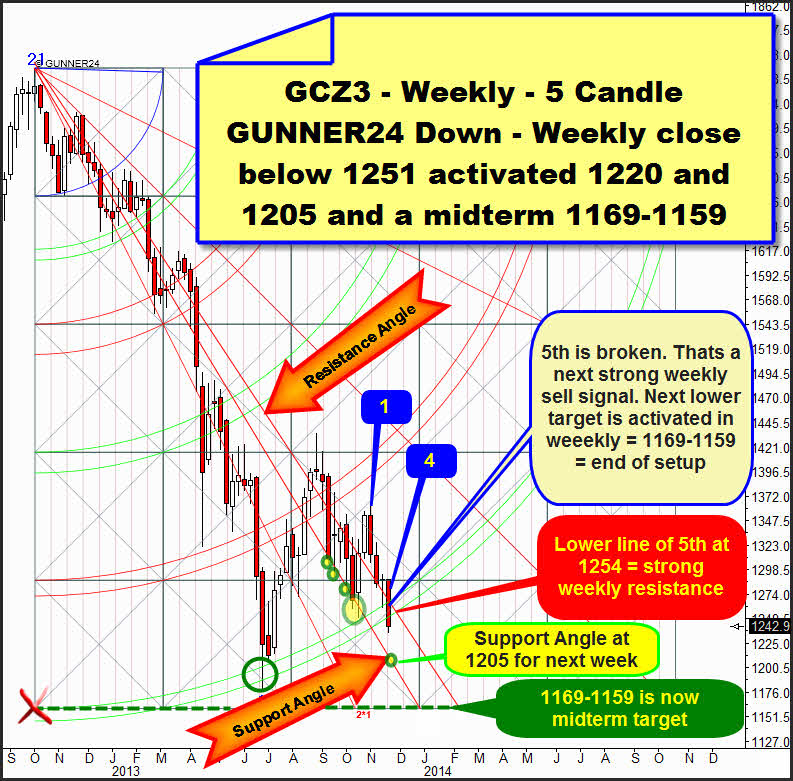
After the unambiguous break of the 5th double arc at the third test, the price end of the 5 Candle down is activated now as the next downtarget. Next week gold may fall down to 1205 since according to W.D. Gann a failed 3rd test will/may normally make the existing trend accelerate very strong. 1205 is a combined weekly and monthly support. From there gold may turn up strongly. But it may be just a counter trend during 2-5 weeks. For next week the 1205 is exactly at the Support Angle that is responsible for 5 x weekly lows to be marked in its surroundings since the beginning of the current weekly decline (1430, August 2013 highs).
Next week the lower line of the 5th will be at 1254, the week after next at 1258, and a weekly close above next week or the week after next will be our signal for the lows of this swing been made, no matter at which level.
The weekly count is most important. Next week will facilitate a change since the current swing will be in its 5th week then. That enables the turn. Read more on that item in the silver analysis at the bottom.
Last week finished weak because closed near lows. This weakness is going to continue at the beginning of the week, and the current swing low – 1236 – will be expected to be taken on Monday, or on Tuesday at the latest. Then the monthly time frame will come into play, the White Knight as it were. It may ring in a hefty countertrend or even a new uptrend at 1220 in the 5th week of the decline.
There are 2 monthly setups signaling a change/countertrend/higher lows on monthly base at 1220-1222. Let’s consider the more important one at first, one of two determining long-term monthly down setups last published in the GUNNER24 Forecasts of 11/10/2013 with its important horizontal supports and resistances. For brushing up here are the important horizontal supports and resistances going far to the year 2014 that determine the gold price, in 50$ steps:
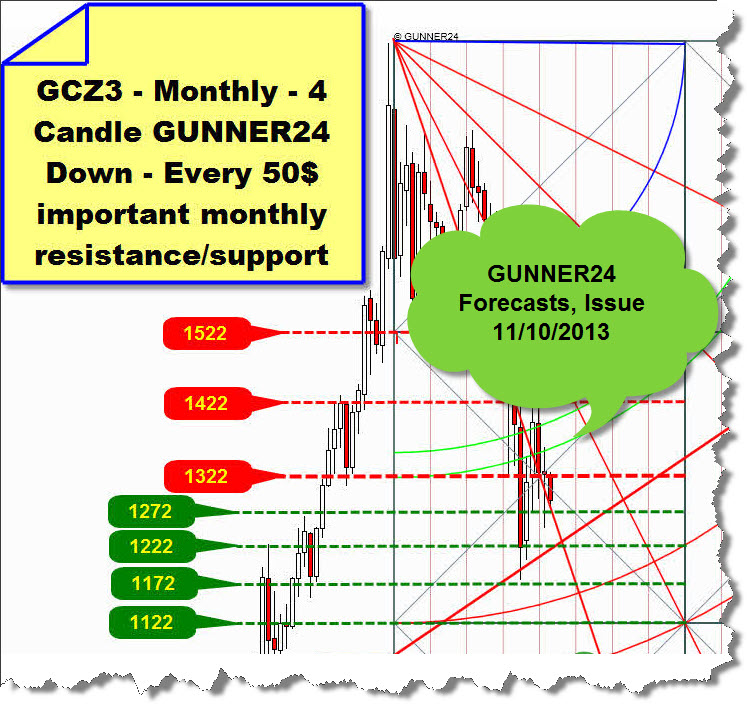
November broke the monthly 1272 horizontal last Wednesday finally. On the same Wednesday also the 5th double arc support in the weekly time frame was broken. The developments of last Wednesday are pioneering so to speak since the same signal appeared in the monthly and in the weekly time frames. It was a rarely hefty occurrence, just pioneering…
The weekly sell signal activates new downtrend lows after all, at first the 1205, then the 1169-1159. It seems to run ahead of the monthly time frame. So, if the monthly 1222 support doesn’t stop the decline so to speak overruling the weekly sell signal, also the monthly time frame will confirm new downtrend lows.
Beneath the 1222, in 50$ steps the 1172 comes into reach as the next important downtarget being on the other hand very close to the activated weekly 1169-1159 downtarget!
The current very short-term trend on monthly base is – hard to believe – still up. We can visualize it putting on a 3 candle up at the June 2013 lows. So we ascertain the following:
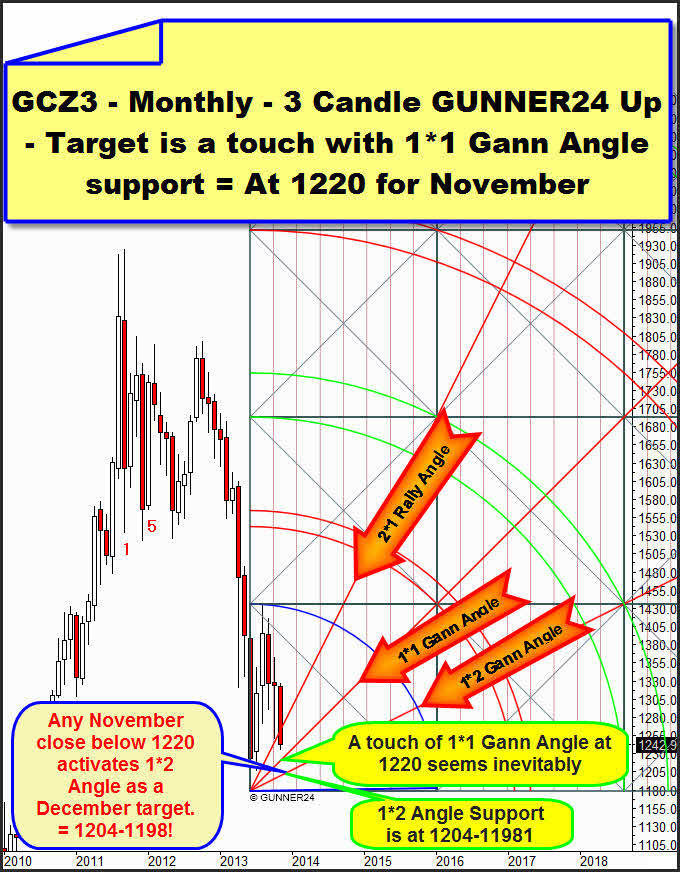
November fell below the 2*1 Gann Angle. This one is at 1267. Thus it was fallen below as well last ominous Wednesday. This way we have worked out some important support failures in as many as two monthly setups.
With the break of the 2*1 Gann Angle a touch with the 1*1 Gann Angle seems to be unavoidable. In November the latter proceeds at 1220 and in December at 1225. I mean, the 1*1 Angle seperates the setup into a bullish and a bearish half. As long as the price is above the 1*1 Angle in an up setup, the uptrend will be completely all right! Just theoretically, with the June 2013 low a new powerful uptrend on monthly base might have begun. But I believe in such things under no circumstances any more, rather in new lows.
A weekly or monthly close below 1220 will activate the next lower monthly Support Angle, the 1*2 as the next downtarget in the monthly time frame. This one is at 1204-1198 for December. Sic!
Silver may also help to avert new midterm downtrend lows in gold. The 1220 in gold is corresponding to the strong 19.50 support in silver:
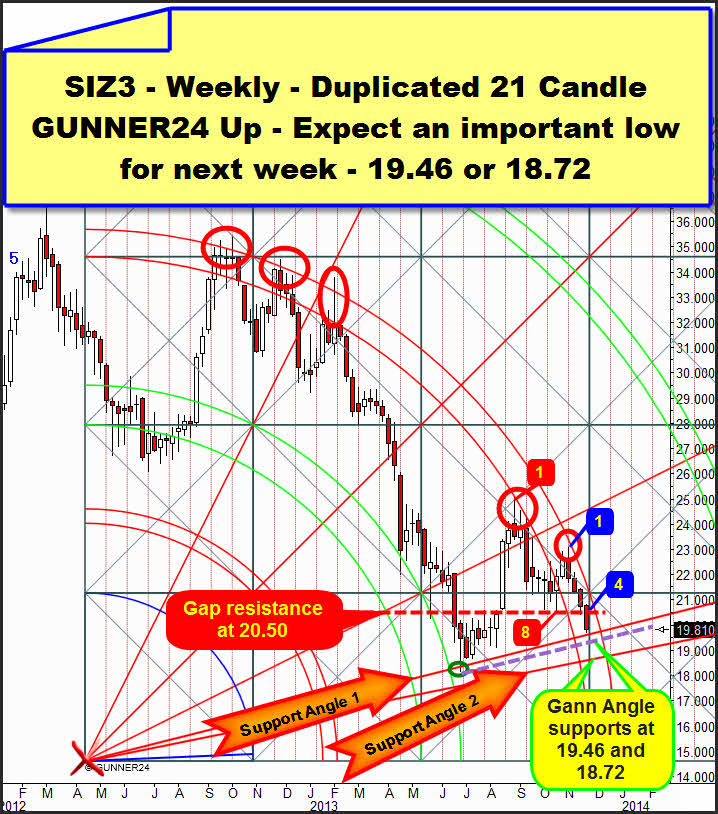
Last week I went into this weekly duplicated setup most extensively. Next target of the actual silver swing will be a touch with the Support Angle 1. Only a touch with this angle can be the precondition for a change.
Extremely interesting and prepared for a change is showing the Fib Count. We start at the August highs and at the red 1. The first weekly downswing lasted 8 weeks. The countertrend starting at the low of the red 8 to the blue 1 count 3 candles altogether. Beginning at the blue 1 next week we count the 5th week of the just current downswing. A possible change is nearing. This one will be confirmed by the first close above the red 3rd double arc resistance. If next week, the 5th, doesn’t turn and if the 6th week produces lower lows than the 5th, no one before the 8th week of the current downswing will offer itself as the next possible change option.
Last week was deep red again reaching a low at 19.705, very close above the Support Angle 1. This one is ascending after all being at 19.66 next week. But that’s where silver can/may turn. But I think that – as happened in the first test of the Support Angle 1 – this one will have to be fallen below slightly. Since the next test of this angle will be just the 2nd test, according to the rules the angle is likely to resist on the whole. Since the 2nd test will take place next week silver can/may fall about 20 cents below the Support Angle 1 without breaking it finally – to 19.46 or so, Gann’s lost motion.
In the chart above the lost motion of this angle is sketched purple. If the 19.46 breaks on daily base or on weekly base and a fortiori on monthly base (correspondingly gold at 1225-1220), well, in that case the 18.72-18.80 at the next lower Gann Angle – the Support Angle 2 is pointing to it – will certainly be a settled deal!
In these whipsaw markets of the last weeks that might confuse any trader thus leading mercilessly to burning the trading account the professional signals have got their special importance. You get them in the GUNNER24 Gold Trader!
You best register with our GUNNER24 Gold Trader now. That’s where we oversee the optimal entries and exits for you. Especially in the difficult market situations where many factors have to be considered the Gold Trader is backed by the additional GUNNER24 Signals based on the combined 1, 4 and 8 hour setups to catch the optimum entries and exits.
|

The GUNNER24 Gold Trader will provide you with the critical knowledge you need to forecast and analyse the precious metals with the GUNNER24 Forecasting Method. All the GUNNER24 Trading Signals you receive real-time are based on the actual Gold and Silver Future. The NEW GUNNER24 Gold Trader is a must for every actively working investor and trader who wants to trade successfully in everyday trading. The insights you receive from the head trader Eduard Altmann (and discoverer of the GUNNER24 Forecasting Method) are truly amazing sometimes. I promise!
Click the button below and order the GUNNER24 Gold Trader - $39.90 US a month. For 201 members and up - $49.90 US a month.
 |
Be prepared!
Eduard Altmann