
In all probability the stocks bottomed on Friday enabling us to expect a normally pretty strong Thanksgiving rally at first. The three days before and the day after Thanksgiving – the Thanksgiving week – has been one of the strongest "bull weeks" from time immemorial.
After the Thanksgiving week the current lows should subsequently put to the test, resisting. That means higher lows on daily basis. Such a successful test of the lows will raise the odds for an oversold rally into Christmas and year-end.
Targets for this rally are about 1410 points in the S&P 500 and the gap close in the NASDAQ-100 at 2669 index points:
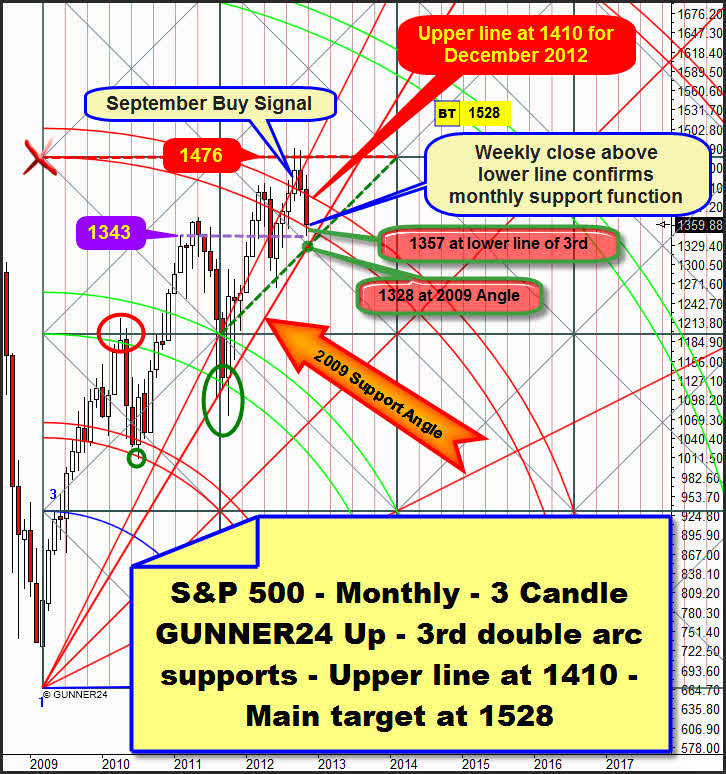
As analyzed last Sunday – GUNNER24 Forecasts, issue 11/11/2012 – the market bottomed in the expected time slot. But the S&P 500 dropped a little lower than supposed – 1343 were reached instead of 1357. Thus the highs of the months of February and June 2011 supported the market. See the dotted purple horizontal.
But the important item is – and it does validate the important support function of the lower line of the 3rd double arc – that with the beginning of the oversold rally narrowly before the end of the trading week a weekly close above 1357 was marked. Thus, in the last minutes the index escaped back to the space between both lines of the 3rd that puts out for us the highest monthly support area after all.
In the reverse conclusion, in future each weekly close below the lower line of the 3rd – for November at 1357 and for December at 1353 – should lead to a further sell-off down to the next lower monthly support, the 2009 Gann Angle Support.
So we deduce that the lower line of the 3rd exerts a visible support function, that furthermore because of the anticipated Thanksgiving rally another rebound upwards from the lower line of the 3rd is to be expected and that therefore the next higher monthly magnet in the setup above might/should newly be headed for. It’s the upper line of the 3rd that passes at 1410 for December.
I hazard a guess that the final lows of the downswing have been made. This allegation isn’t only backed by considering the action through the glasses of the monthly time frame, but also the daily GUNNER24 Down Setups are giving unambiguous clues for significant lows.
Simultaneously the S&P 500 and the NASDAQ -100 reached some important double arc supports in the daily time frame. And since in two different markets we can analyze a significant rebound at these double arcs simultaneously, technically we may work on the assumption that now the markets decided to turn:
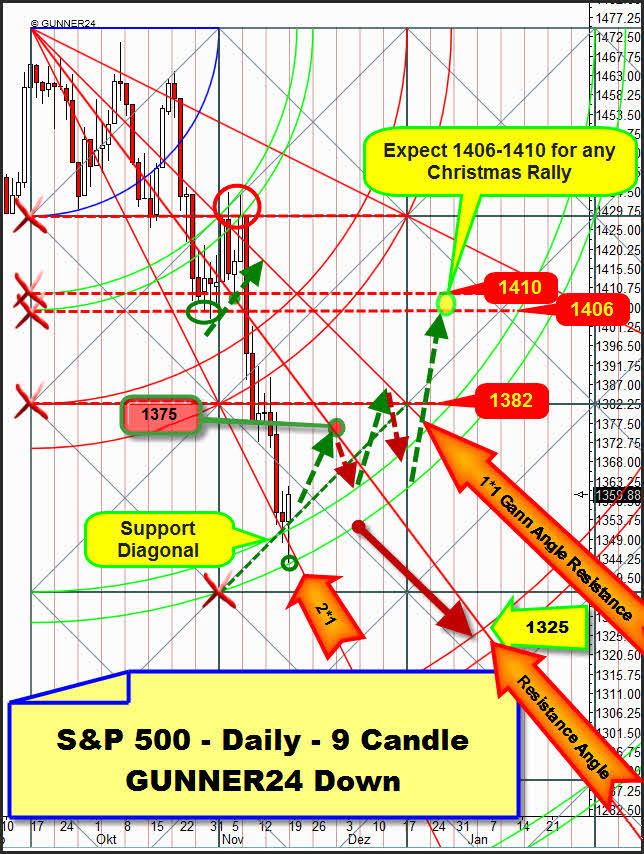
The trigger for the violent sell-off of the last two weeks was the rebound from the cross resistance at the red circle. The index didn’t achieve to re-conquer the 1430 area. The result was a severe rebound that broke through the 1*1 angle immediately. Since the 2nd didn’t provide any support at all, the market rushed down to the 2*1 angle un-braked. The market touched the lower line of the 3rd and rebounded significantly!
We recognize that the market is respecting the 3rd. Beside the Friday reversal candle, Thursday closed above the 3rd already. The expected Thanksgiving rally is supposed to lead till the next higher Gann Angle – the resistance angle sketched above. From there, from the 1375-1380 area the expected test of the 3rd double arc will be likely to start the week after next. If it resists - at the moment I assume it will – the market will be supposed to follow roughly the sketched green/red arrow course until Christmas. 1410-1406 will be possible until Christmas. It’s the actually most important resistance not only in the daily but also in the monthly time frame. If the 3rd don’t resist, the 1320-1325 area at the 4th double arc will become the correction target.
The 1410-1406 up target is corresponding to the 2669 in the NASDAQ-100 where a monster gap is waiting for being closed:
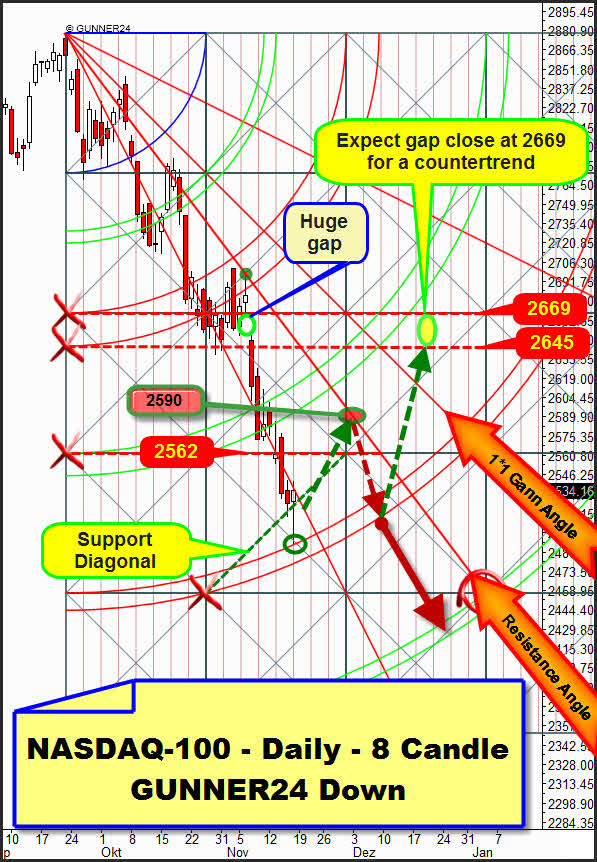
Such huge gaps are strong magnets that want to be closed as a rule. In the final conclusion the NASDAQ-100 is now likely to go up, similar to the S&P 500. The first severe punch after the bounce from the 4th double arc that is to be expected now will be likely to start at the resistance angle and the 2590 area. Subsequently the 4th will be supposed to support the market and lead it up to the Christmas target, following the arrow course. If the 4th breaks on daily basis we’ll be allowed to work on the assumption that the 5th double arc in the setup above will have to be reached!
Decisive for the continuation of the uptrend that has been going on since March 2009 will be the structural performance of the Christmas/year-end rally that is to be expected now. An ABC-structure – as sketched in at the NASDAQ-100 arrow course – would mean that the longterm uptrend will have come to an end because it topped in September 2012. I consider this scenario as having a probability of a 30%.
In case the expected up-move proceeds in five eaves as sketched in the daily setup of the S&P 500, the longterm uptrend will be supposed to go on topping out in spring 2013. Actually I consider this scenario as having a probability to occur of a 70%.
Waiting for Godot
Since in gold and silver last week rather took a trendless, non-active and meaningless course somehow seeming to initiate a sideways range even though the seasonal circumstances are plainly positive I’d like to get to the bottom of this "negative divergence".
It’s obvious that both metals are being kept back from the stock market decline. The fact that they didn’t join the sell-off at the stocks - especially considering the severe decline of the miners – is thoroughly owed to the seasonal aspects in my opinion. And if the stocks and miners want to turn up now in the medium term, also the precious metals should/would have to perform well, as to my arithmetic.
A technique I sometimes apply to identify the important ranges is focusing to the Gann Angles that start from important tops and lows being able to provide us information on the further course or on important supports and resistances respectively, if we can identify their importance for the actual pricings:
The trick is to work out, as I just call them, the "Gann Angle Clusters". An infinite "painting", I can tell you... after all you often have to apply many angles at the most different important lows and highs weighing them in terms of their importance regarding the actual price.
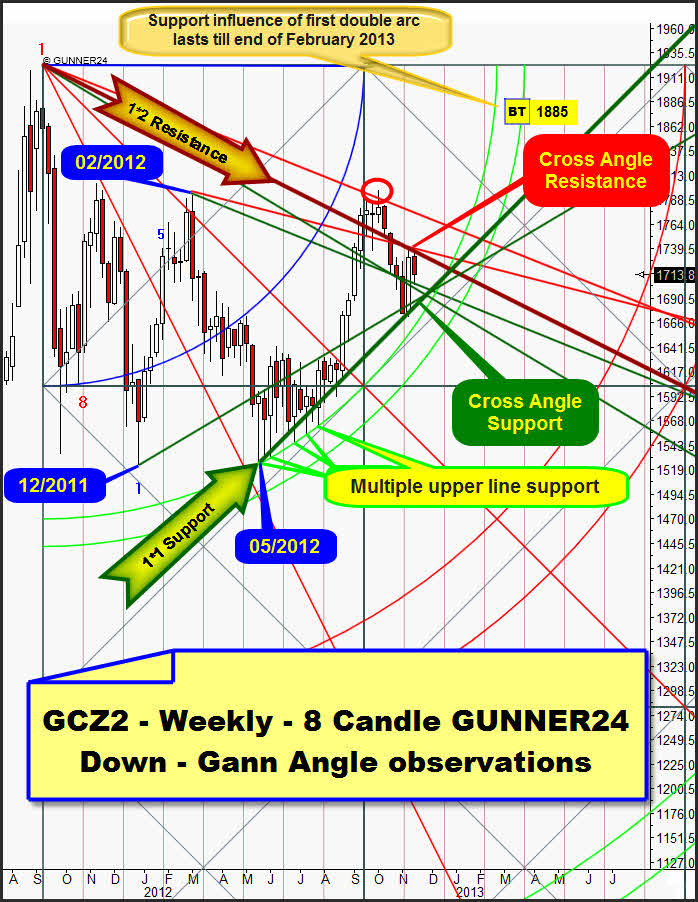
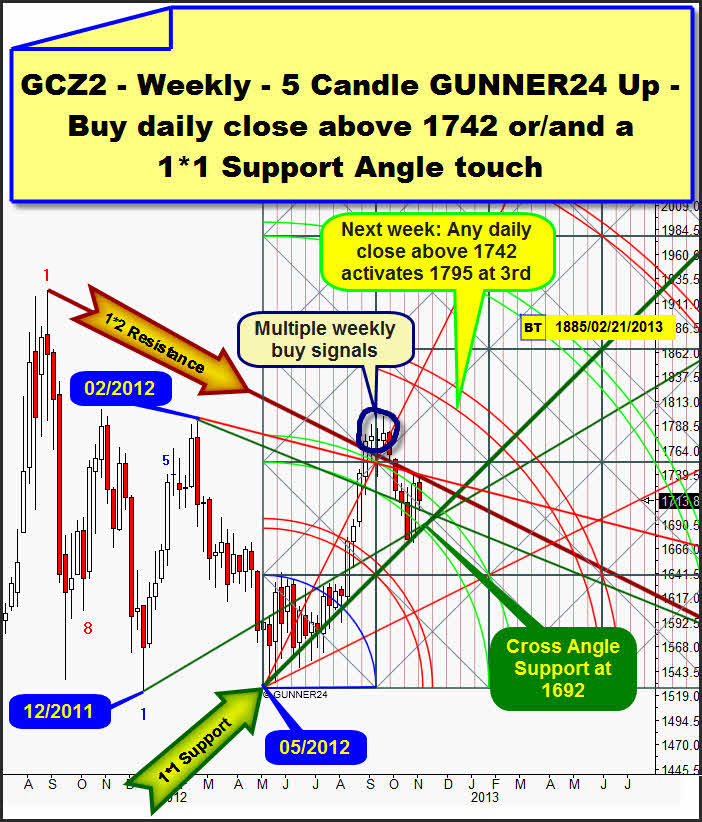
Let’s consider at first the angle structure from the sight of the valid weekly down setup. After all, from May 2012 gold was given support multiply at the upper line of the first that is to provide support until spring 2013 all in all. In future, in case of any new touch with the upper line of the first gold would have to show a new rebound. Since in the past we could observe such a comportment we’ll have to suppose the same for the future until the support of the upper line of the first comes to an end. It will be in spring 2013 when the upper line of the first will intersect the time axis.
So underneath the actual price there is the strongest support = the upper line of the first. Also the 1*1 Support Angle starts from the May 2012 lows. It was touched last week being the result a pretty strong rebound from this 1*1 support. That’s why the 1*1 Angle support is traced bold green. It’s actually the most important Gann Angle support. But with the highs of the last two weeks also the 1*2 Resistance Angle was reached again, that started from the all-time high. Since the 1*2 visibly slowed down the current recuperation it’s the most important resistance angle at the moment, so it can be traced bold red as well.
Furthermore we can identify the most different support and resistance angles - emanating from important lows and highs – that affected the price during the last weeks because gold touched them showing a reaction to these angles. They are dyed red and green, but only thin… They don’t have such a strong influence to the price and the future performance as the important 1*2 and 1*1 angles have.
Now it’s important for us that beside the upper line of the first we can identify 4 support angles beneath the price and only 2 important Gann Angles above the price that actually bring their influence to bear. These altogether 6 angles are forming the range where gold is actually situated and where it might remain…
…in the actually valid weekly up setup a resistance component supervenes. It’s the resistance the upper line of the 2nd is exerting right now:
During the last two weeks the upper line of the 2nd additionally prevented the last rebound from the 1*1 Support Gann Angle from continuing and above all from accomplishing.
But at the same time with last week gold is clearly positioned within the lines of the 2nd that is by and large exerting a support function after all.
All in all there’s a clear stalemate in gold, at least short-term. Up and down forces are balanced short-term. And short-term actually the resistance of the 1*2 Resistance Angle is dominating. Since in the combination of both gold setups the longterm supports are numerically stronger than the actual resistances, and there’s a clear buy signal in the up setup (in September 2012 the 2nd double arc was clearly broken upwards after all!) we’ll have to work on the assumption that the very strong supports will hold and the concentrated up-forces shall prevail soon!
We can trade the actual range in the following way:
A clear and significant daily close above the weekly 1*2 Resistance Angle and the 2nd double arc in the weekly 5 candle up setup will newly activate the 3rd double arc at 1795$.
On the other hand we’ll be able to speculate on a new heading for the 1*1 Support Angle in the setup above if the low of last week is underbid. There, at the combined supports of both green Support Gann Angles and the lower line of the 2nd there will be a good and technically pretty riskless long-entry at 1692$ next week.
In these whipsaw markets of the last weeks that might confuse any trader thus leading mercilessly to burning the trading account the professional signals have got their special importance. You get them in the GUNNER24 Gold Trader!
You best register with our GUNNER24 Gold Trader now. That’s where we oversee the optimal entries and exits for you. Especially in the difficult market situations where many factors have to be considered the Gold Trader is backed by the additional GUNNER24 Signals based on the combined 1, 4 and 8 hour setups to catch the optimum entries and exits.
|

The GUNNER24 Gold Trader will provide you with the critical knowledge you need to forecast and analyse the precious metals with the GUNNER24 Forecasting Method. All the GUNNER24 Trading Signals you receive real-time are based on the actual Gold and Silver Future. The NEW GUNNER24 Gold Trader is a must for every actively working investor and trader who wants to trade successfully in everyday trading. The insights you receive from the head trader Eduard Altmann (and discoverer of the GUNNER24 Forecasting Method) are truly amazing sometimes. I promise!
Click the button below and order the GUNNER24 Gold Trader - $39.90 US a month. For 201 members and up - $49.90 US a month.
 |
Be prepared!
Eduard Altmann