
The very last really important buy signal for copper was sent many years ago. It was in January 2012 when this buy signal was triggered in the monthly time frame. In retrospect, that was just matter of a pretty weak one, not at all sustainable since then copper was already in a multi-year lasting bear market move, from today’s point of view. The absolutely last, truly strong and ongoing buy signal of the red shining metal was released with the month closing price of September in the uptrend year 2010.
This monthly buy signal led copper into the alltime-high (ATH) of the year 2011 (ATH is at 4.65). Then started the bear market in which the metal is stuck till today.
==> The most recent developments about the metal generated an important buy signal now. The first since as many as 4 complete years!
==> Copper is breaking out of its 10 month trading range! A strong buy with GUNNER24 Uptarget at 2.68!!
It’s also very long ago that I last analyzed copper in the free area.
The last time that happened within the free GUNNER24 Forecasts was in June 7th 2015. Copper quoted at 2.70 then, being predetermined to reach at least 2.30-2.45 till the end of the year 2015, with prospect to sell off at 1.60-1.70 within a panic cycle.
At that time, in June 2015 inter alia I presented the following GUNNER24 Forecast, based on the monthly graph and the GUNNER24 Up Setup applied during the 2008 bear market low:
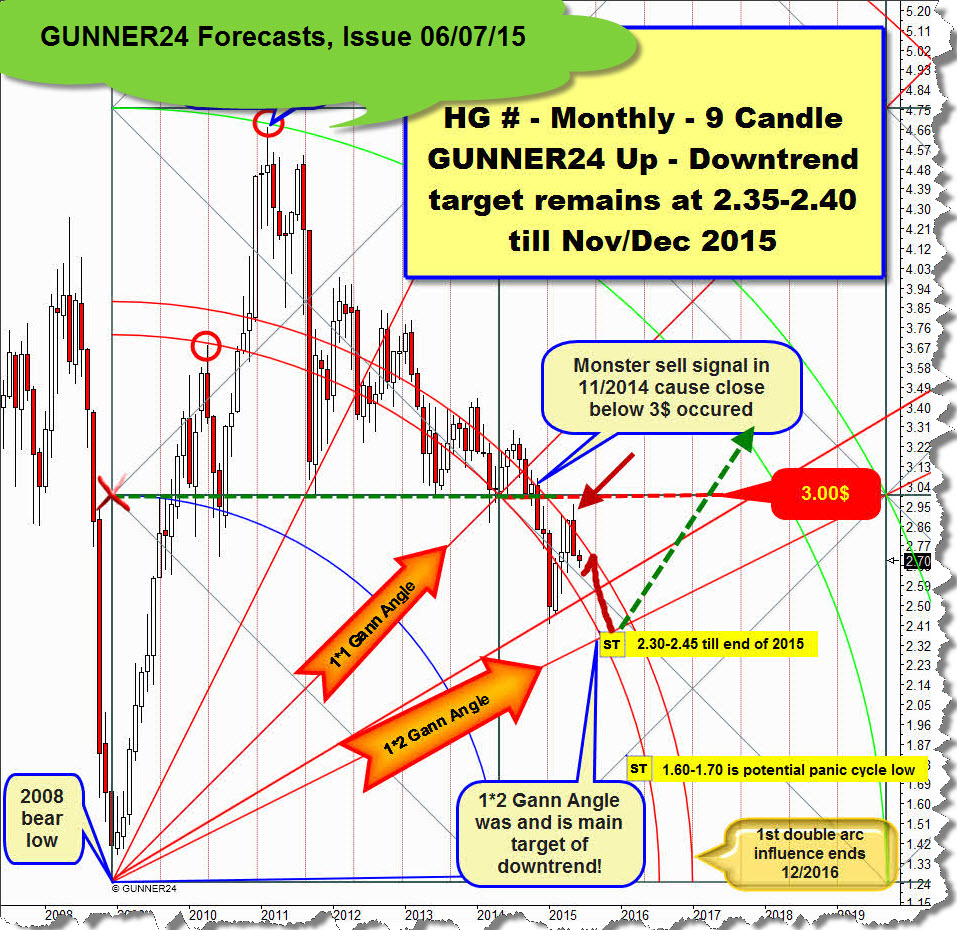
Then, copper was caught in the down suction of the downwards directed 1st double arc resistance that obviously, so it featured the 1*2 Gann Angle (springs from the 2008 bear low) as downtrend minimum target according to price and time. Everything indicated that the 1*2 Gann Angle – normally a very strong natural support in the yearly time frame – would be reached at 2.30-2.45 indeed till November/December 2015 to mark there and then an important downtrend low.
The forecast according to time was rather good. The current bear market low was reached by mid-January 2016. Copper bottomed into the bear market and the final 2016 low together with the Mining shares, platinum and palladium.
The price forecast was pretty lousy, since the 1*2 Gann Angle did not bear and besides the panic cycle price target was missed. The bear market low is at 1.94.
All that is meant as a survey and entry into today’s copper-breakout analysis.
Let’s get now straight to the nitty-gritty considering copper as matters stand today, evaluating the current upwards breakout as well as the developing powerful buy signal.
Point of departure of the new forecast shall be the downtrend view in the monthly time frame. The following monthly GUNNER24 Down Setup starts at the 2011 ATH of the Copper Continuous future contract (HG #) measuring classical 8 monthly candles down:
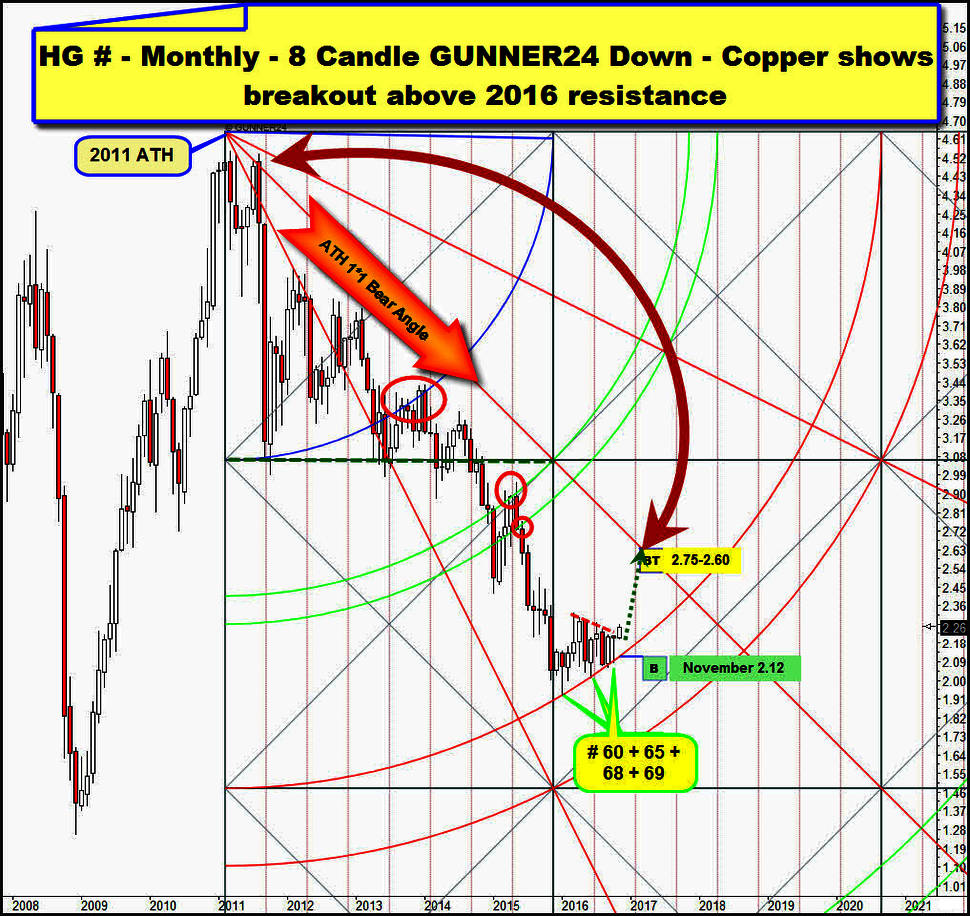
Copper bottomed after a 60 month lasting bear market decline accurately at the upper line of the 2nd double arc. Low of # 60 (January 2016 at 1.94) is final low of 2016 and start of the current countertrend in the monthly time frame. Like every other metal market, also Copper hints to a 12/13 month lasting countertrend period.
At # 60-low, the countertrend has started which has tested the upper line of the 2nd at monthly lows of # 65, # 68 and past month of October # 69.
==> Since the bear market bottom, a series of some important higher monthly lows can be noted. Each is caused by the lower line of the 2nd double arc support magnet, so the upper line of the 2nd above is the dominating support for 2016. Upper line of 2nd is strong countertrend support for the rest of 2016, likely with a 99% probability also for the first few months of 2017.
==> A VERY FIRST monthly close BELOW the upper line of the 2nd till April/May 2017 would officially signal the end of current countertrend cycle. Such close would activate the lower line of the 2nd double arc as an important monthly downtarget. I think, such a close will lead to a backtest of the 2016 final low environment and even some far lower bear market lows...
Since 7-8 monthly candles, the highlighted red dotted falling resistance breaks copper. ==> The red dotted falling resistance is a resistance in the yearly time frame!
The past October candle closed once again just shy below the 2016 resistance. Current November candle # 70 trades actually solid above the 2016 resistance! If Copper succeeds in overcoming that main resistance it usually should test back the ATH 1*1 Bear Angle within a substantial rally lasting 2-3 months.
The ATH 1*1 Bear Angle is the most strongest imaginable future resistance, and it actually seems to be the strongest attraction area for the countertrend, so Copper should normally test the ATH 1*1 Bear Angle at about 2.75$-2.60$ for the January-March 2017 time frame, if it is able to break the 2016 resistance finally within the course of November or December!
==> The obviously safest entry into a strategical long-position put out by this setup would be a new backtest of the upper line of the 2nd double arc, the yearly support that has often been tested positively in 2016.
==> For November 2016 the upper line of 2nd double arc takes its course at 2.12 (December 2016 at 2.13...)! But in my opinion, the upper line of the 2nd resp. the 2.12 will scarcely be feasible to be headed for in the course of November!!!
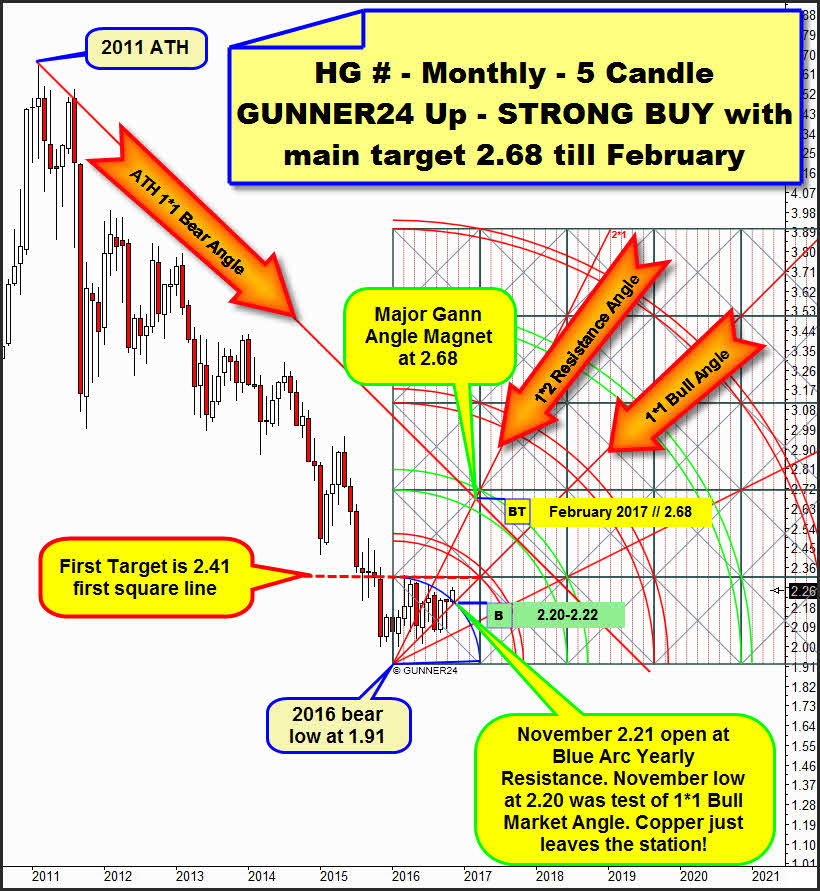
For… copper is breaking out now upwards hardly being supposed to look backwards before the next higher and attractive monthly GUNNER24 Up Magnet at 2.41 will have been worked off:
The present breakout cycle started at the daily low of 2.15$ on 10/25. Thus, in terms of Friday (close at 2.26) the copper breakout is just on its 9th trading day of a breakout move that is likely to comprise 20-25 trading days. The fact that 10/25 also marks the last important intermediate cycle top of the US Dollar Index attracts attention.
==> Thereby, copper is overwhelmingly supposed/likely to boom strongly now till February, the US Dollar Index conversely having delivered its next important lower high in 2016 on 10/25 thus having begun a multi-week downtrend that again shall/should last till January/February 2017! This pending negative US Dollar performance is supposed to drive up all the metals + the Mining Shares in a hefty extent, certainly till January/February 2017.
In the monthly chart above, at the 2016 bear low I anchored a 5 Candle up that we may use for the assessment of the breakout because the bear low was initialized by an upper line of a double arc in the monthly time frame, after all.
With this 5 Candle up, inter alia we get the most dominating 2016 resistance for copper which is/was the Blue Arc! For the whole year 2016 we can monitor that the Blue Arc has not been exceeded any time on monthly closing base. Furthermore, two exact negative tests at monthly highs can be observed at the 2016 Blue Arc main resistance. All in all we’ve got to state that the copper performance has actually been very measly over the entire year. It rather executed a consolidation at the bear low thus tending sustainably upwards not unlike its spirit brother, the white precious metal silver.
Once more, the October candle closed clearly below the Blue Arc 2016 resistance, copper thereby trading below its yearly resistance, also in the 10th month of the countertrend.
And now, please pay attention to this: With the beginning of November, the Blue Arc price resistance magnet was overcome according to time ==> November opened above resp. exactly at the Blue Arc (2.21). And furthermore: The current November low at 2.20 tested pinpoint back the 1*1 Bull Angle that arises from the 2016 bear low.
Therewith the November opening as well as the November low bounced from a strong November support magnet in the monthly time frame! Since the beginning of the Month of November, as many as 4 trading days have passed each of them showing a higher low, a higher high and a higher close.
==> With the November open & low, a GUNNER24 Buy Signal in the monthly time frame was triggered because an important GUNNER24 Support Magnet had released a strong upmove in the daily time frame. Such rebounds from monthly support magnets use to be very sustainable, as a rule!
The rebound made copper rise to 2.26 till Friday. This is the highest weekly close since May. That means, after the daily and the monthly buy signals also the weekly time frame generated a weekly buy signal!!!
==> Thereby, copper is supposed now to rise rapidly up to the first target at 2.41. First target is the first square line resistance. Technically, the first target at 2.41 should still be reached in the course of the month of November.
Well, as a result, the best and safest entry into this current breakout move is actually at the 2.21-2.20 GUNNER24 Support Magnet! By means of the US Election, next week is expected to become rather volatile, hence the 2.21-2.20 may perhaps be tested briefly once more. With a lot of Bull Luck…!!!
==> Main target for the countertrend is 2.68. The main target is supposed to be reached in February 2017. That’s where and when the ATH 1*1 Bear Angle = still most ruling bear market resistance intersects the 1*1 Bull Angle within the lines of the 2nd double arc.
==> 2nd double arcs are always the most important countertrend targets! February 2017 would be the 13th month of the current countertrend then. High Fib numbers (8, 13, 21 etc.) are always predestined for substantial turns/tops. Sic!
Be a part of our exclusive sworn GUNNER24 Trader Community – now... I try to protect your wealth!
- with daily trades – quick, safe and profitable…
- in well-chosen precious metals, commodities, indexes, currencies and in the best stocks worldwide...
- in both rising and falling markets…
- with little use of capital…

Click the button below and order the GUNNER24 Trade of the Day - $49.90 US a month.
 |
Be prepared!
Eduard Altmann