
I’m going to save the pain itemizing and summarizing the monetary-political developments of the last three trading days. There are plenty of inexpensive services and sites that can accommodate much more space for the fundamental contexts of the latest decisions than I’m willing to. In my capacity as a chartist/forecaster it rather matters me to realize how long the trends last, which goals they aspire and to recognize where the crucial marks concerning price and time are situated signaling us confirmations, changes and recesses.
Regarding confirmation respectively continuation of trends and significant signaling I cannot remember now having experienced such a lot of simultaneously presenting meaningful GUNNER24 buy- but also sell signals that were cemented with the Friday close.
By the developments of last week and the related October closings another incredibly important momentum thrust was triggered that is now putting out some new cognitions on when and where the bull in the US stock markets is supposed/likely to come to an end – but as well when gold and silver shall reach their final bottom.
Technically, the NASDAQ-100 shouldn’t top out before spring 2016, about in March – at either +5700, but it might also go to +7500. Both new GUNNER24 Price Targets resulting from the current October closings must be evaluated again and again during the year 2015 and fine-tune in terms of time. At the moment, for me it’s a matter of fact however that with a high probability the US stock markets are entering now into a kind of blow-off respectively exhaustion phase that can’t or shouldn’t end before 2016.
If the NASDAQ-100 mustn’t top out before spring 2016 we may derive the following in terms of time regarding some important bear-market bottoms and other bull-market tops: As to the history, gold and silver are supposed to find the final bottom in terms of time a little sooner than the US stock market major indexes: Around the turn of the year 2015/2016, actually silver finding its final bottom always a little sooner than gold. The gold- and silver miners are supposed to get to their respective final bottom a little earlier than silver, maybe July-October 2015.
Then, consecutively from January 2016 the other major US stock markets start topping out. Dow Jones, Russel 2000, Dow Transports, S&P 500 etc… Please don’t expect this very order! US$ respectively USD/JPY are likewise supposed to come to their significant highs at the earliest in 2016. As well the parity of the € with the US$ is definitely not to be expected before the beginning of 2016.
==> Here follows the currently most important setup in my quiver: The 34 Candle GUNNER24 Up Setup of the NASDAQ-100 index on monthly base. This is where we can derive from, why the US stock markets are most likely now to march upwards 1.5 more years mercilessly. Subsequent to this I’d like to present to you the current short term price targets of the S&P 500, gold and silver, triggered by the October close and now activated at a 100%.
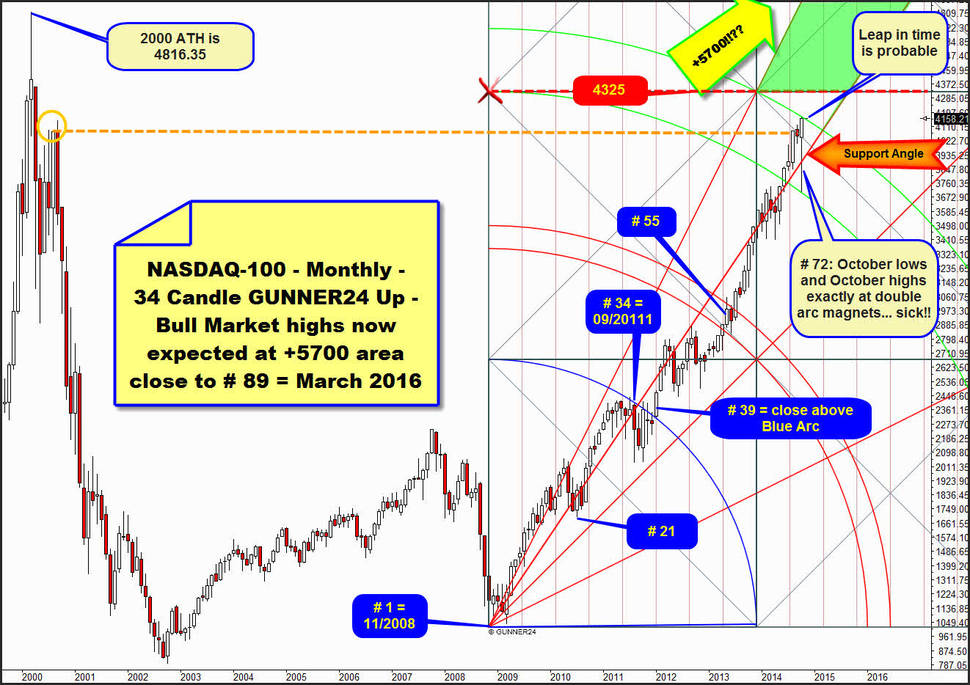
The 34 candle up starts at the 2008 low = month # 1. We clearly recognize that the first impulse is to be measured at the top of the candle # 34 even though the absolute high of the first impulse is lying in month # 33. The 34 impulse simply fits because inter alia the first close above the Blue Arc succeeded in the 39th month of the move releasing this close a new buy signal driving the market upwards. Here again, the low of the important month # 39 is exactly on the Blue Arc, thus confirming the existent Blue Arc just like it is anchored in the setup. It cannot be an impulse during 55 months because no important top is to be made out around the 55. It cannot be a 13 up impulse because no important top is to be seen there either.
A look at the October 2014 candle = # 72 is sufficient to realize that the setup above can only be valid the way it is adjusted. The October candle worked off to a T the upper line of the 2nd as well as the lower line of the 2nd, thus directly confirming the existence of the 2nd double arc and hence the importance of the signaling of the 2nd double arc to the market.
The 34 is thereby the longest identifiable first up impulse. Notoriously, 34 is a rather high Fibonacci number that long impulses forming extremely far-reaching magnets in terms of price and time. Now I didn’t depict it here because it is not so important concerning the current signaling/forecast, but the setup above will expire in the year 2025 according to time and at 12500 points according to price. Merely in theory, this setup thereby allows the index to be willing/able to reach the 12500 points through the year 2025.
==> going back again to the present October candle – candle # 72 – and the signal effect of the 2nd double arc: It’s astonishing how October rushed in one go, powerful and unbraked, from the October low to the Friday high that is exactly at the upper line of the 2nd double arc = monthly resistance!!
Thus, the lower line of the 2nd is confirmed important support, also for the future! The up-energy that arose by the touch with the lower line of the 2nd is terrifying for all the stock-market bears however. Completely bad for the bears is moreover the fact that with end-October 2014 the market is showing the longest distance to the Support Angle since the bull had started. The lower line of the 2nd as well as the support function of the support angle combined have released mighty up-pressure.
The October candle is signaling unlikely upwards momentum. We recognize furthermore 5 monthly closings within the lines of the 2nd double arc. Closings within the lines of a double arc nearly always prepare the final break of that double arc in trend direction!
==> Please pay attention to the little line at the right beside the close of the candle # 72. This little line symbolizes the possible opening price of the November candle under the presumption that November opens exactly where October 2014 closed. Hence, the line is also situated at 4158.21 pts., and the line is narrowly above the resistance of the upper line of the 2nd. If November starts with its first November 2014 price, its opening price above the upper line of the 2nd – we can work on this assumption after such a strong October close – the resistance of the ENTIRE 2nd double arc will be skipped over.
I.e., the powerful long-lasting resistance of the 2nd is most likely to be skipped in terms of time as early as with the very first November price respectively rather certain to be with the first daily November close, thereby softening for sure. Thus the price will be permitted to remove itself very quickly from the resistance of the 2nd double arc because this one will have been broken…
==> According to this, as early as in November 2014 the 2nd double arc is supposed to be broken upwards finally on closing base! THIS FACT WILL ACTIVATE FINALLY THE NEXT HIGHER DOUBLE ARC IN TREND DIRECTION AS THE NEXT IMPORTANT UPTARGET OF THE BULL MARKET! Technically, in the sketched green Gann Angle Corridor the bull market should run unbraked, undisturbed and without many difficulties up to the 3rd double arc surroundings.
==> Since the bull is only just in the 72nd month of its run, thereby it really cannot end respectively top out before around the 89th month = about March 2016. The lower line of the 3rd double arc (not visible) is at +5700 index points for March 2016. If the index want to take finally also the 3rd double arc upwards, +7800 (at 4th double arc environment, also not visible) will be to plan as a possible bull-market top!
This was the big picture. Let’s go now to the targets that the S&P 500, gold and silver should have to work off till year-end. Last week, at this place we worked out that the S&P 500 will have to work off the 1985 main resistance, the 1*1 Main Resistance Angle in weekly time frame before it can be supposed to turn sharply downwards form there between last Wednesday and last Friday:
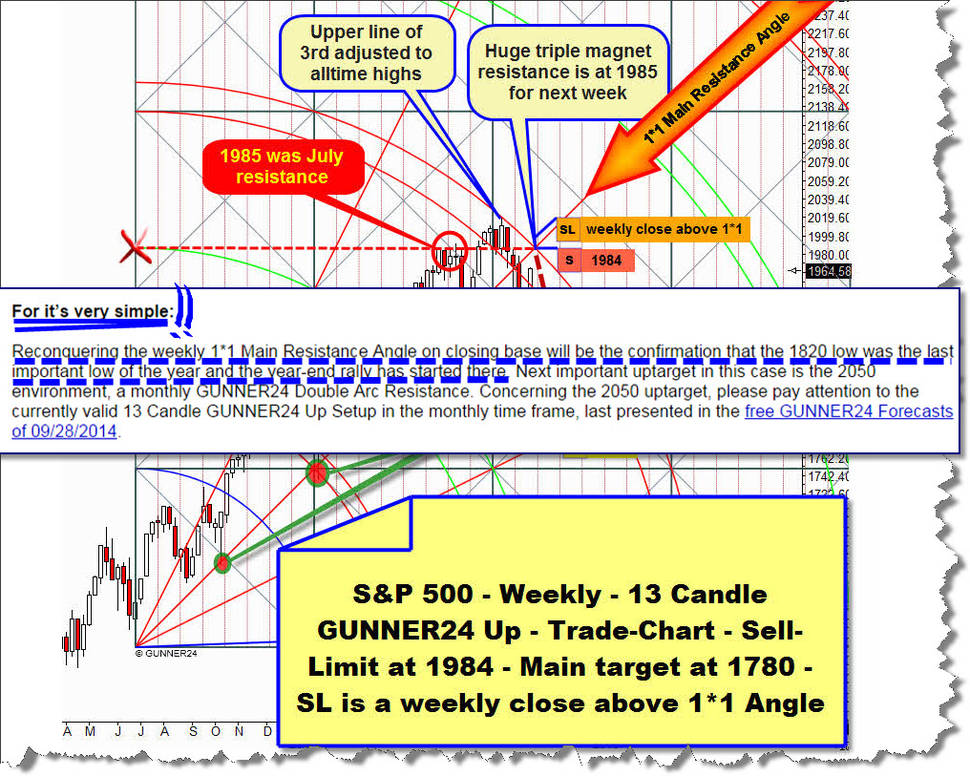
Fiddlesticks… instead of rebounding from the powerful 1985 main resistance it broke through, for the first time last Thursday with the 1994.65 close. Thus, the main resistance was re-conquered, again releasing mighty upwards momentum that led to prices shy below current all-time high on Friday. The current upwards momentum is likely to last at least 5-10 more trading days, so further all-time highs will be necessary for next week/weeks.
The strong October close led to another strong GUNNER24 Buy Signal on monthly base:
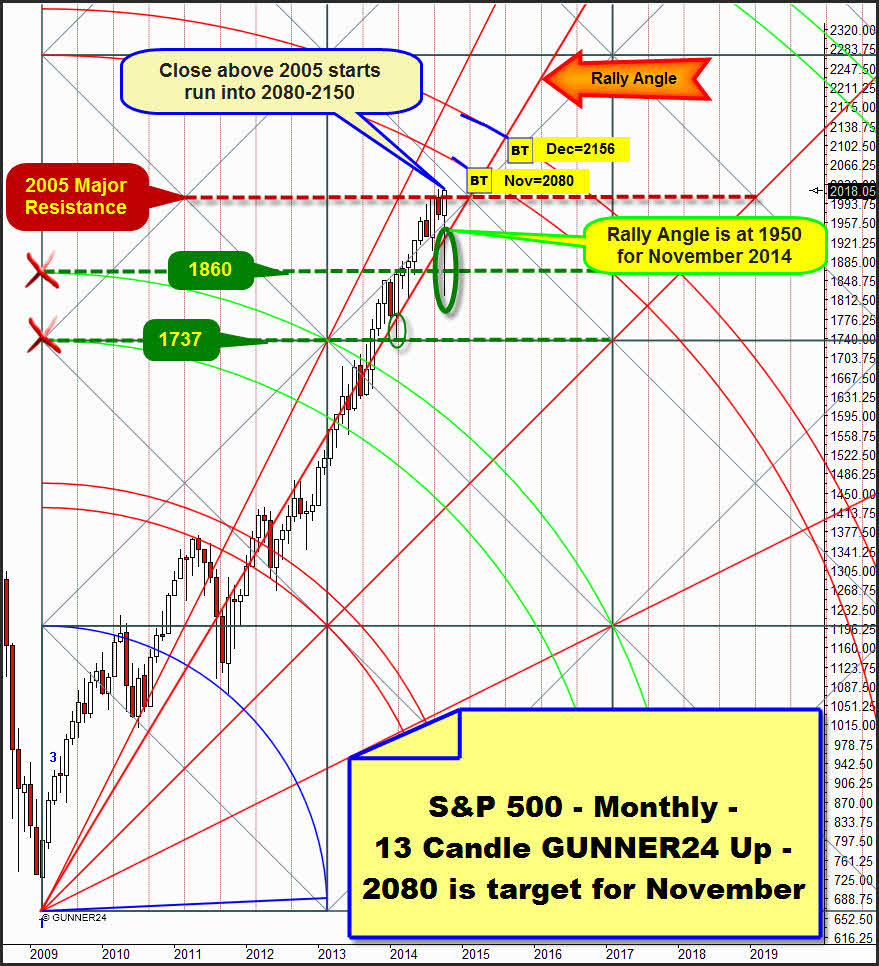
The 2005 main resistance, the important horizontal resistance that still braked August + September 2014 at the highs is now finally overcome on closing base. Thereby, the lower line of the 3rd double arc in the presently valid 13 candle up in the monthly time frame is now confirmed as the next short-term uptarget.
For November, the lower line of the 3rd is at 2080. For December 2014 it is at 2077. Maybe the S&P 500 will be able to reach as early as in December 2014 the upper line of the 3rd double arc. I.e., 2156 will be possible this year already.
If the 1950 are reached in November, there will be a good re-buy chance/entry into longs since the Rally Angle was newly confirmed as an important support – at least on monthly closing base. In the end, also in October 2014 the Rally Angle held, generating again a powerful upwards momentum that is supposed to keep the market up – or let’s better say generally chase it up at least for 3, rather 5 more months. The NASDAQ-100 suggests that another powerful up-wave is due in the bull market. Thus, the S&P 500 as well should be able to overcome some time in the course of the next 6 months the 3rd double arc resistance finally…
Gold and silver are performing a tragedy, no question. The US stock markets keep on accelerating upwards, probably for many, many further months. Correspondingly gloomier becomes the long-term prospect for both mentioned metals. After all, silver has been showing a minimum downtarget of 15.25 for a long time – last worked out in the analysis of 10/12/2014. After several weeks of recess and consolidation at the lows, the downtrend has only just begun to gather pace again on Friday. Some new, much, much lower bear market downtargets are looming now:
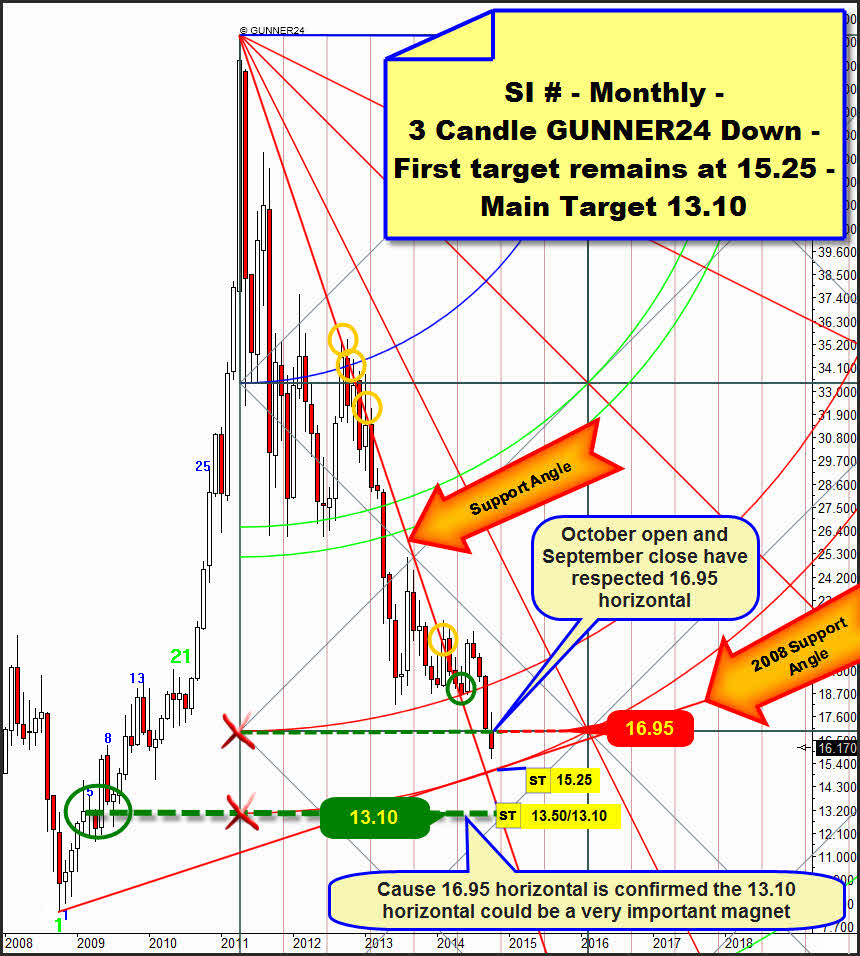
The last month – October 2014 – produces another sell signal, because the 16.95 horizontal that is derived from the upper line of the 2nd double arc was taken downwards finally. The 16.95 still held in September… thereby the 16.95 mutated to become a monthly resistance now. If this mark is reached in November in case of a bounce there will be a superb shorting opportunity there.
Silver first target is the 15.25. The lower line of the 2nd and an angle support that springs from the 2008 low are forming there for November + December 2014 the strongest down magnet and support. Technically, silver has to get there to be able to turn up starting a several month bounce.
Since we have temporal indications for silver not to find its bottom before the lapse of a year however, some much lower supports come into play. In question as final bottom for this entire downtrend is the horizontal that springs out of the intersection point of the lower line of the 2nd with the beginning of the down setup = 13.10.
If November 2014 closes below 15.00, silver will be likely to slide directly down to 13.50 within a couple of weeks. That’s where an angle is situated. It may sound curious, it’s the matter of a "Support" angle… In deed it’s a support angle however, since the angle was taken upwards in the course of the year 2014. Mind on this the upmost orange circle. Yet the Support Angle might be – at least it seems so now – an important future magnet for the price. A new test of this "support" does not appear to be unlikely. ==> For the first time the Support Angle was tested at the green circle. As mentioned, if the 15$ mark is fallen short on monthly closing base in November 2014, we will have to reckon with the test of this angle at 13.50 for December 2014!
On Friday, gold broke its triple bottom at 1180 downwards at the 4th test reaching new bear-market lows and thus activating the 1116 as next downtarget that should have to be worked off till December 2014:
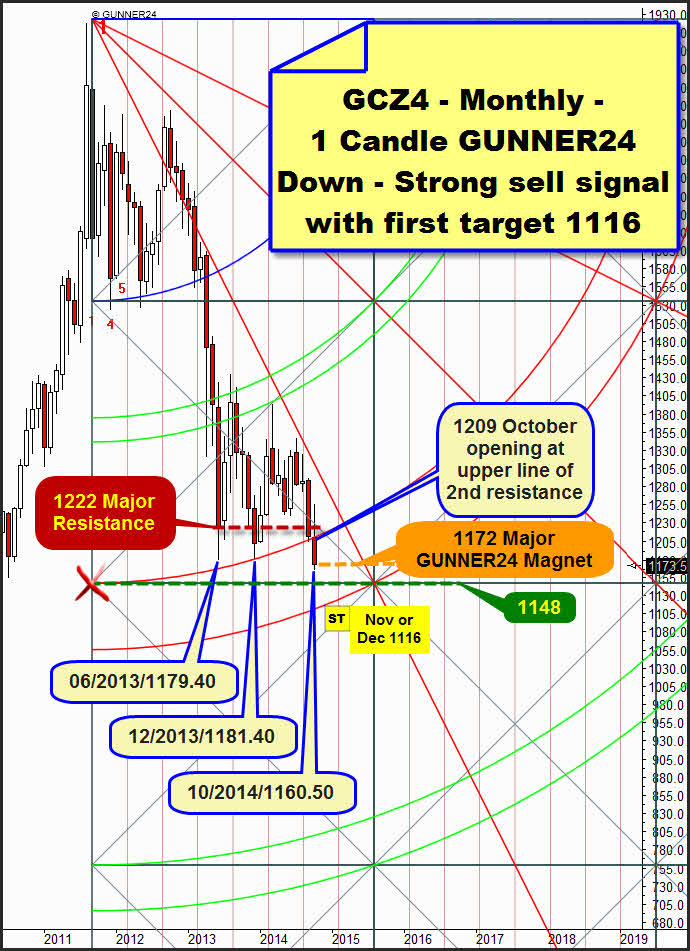
The October 2014 low is at 1160.50 and the October close at 1173.50. Thus, gold anyway avoided the final break of the important 1172 GUNNER24 Magnet (the derivation of the important 1222/1172/1122 monthly GUNNER24 Magnets is to be found here). So at least the immediate unnoticed slide to the 1116 might be averted…
Thereby, October broke through the support given by the upper line of the 2nd double arc. Now, gold is aiming inevitably to the lower line of the 2nd. In the end, it is just re-enacting what silver’s action. Working off the lower line of the 2nd at 1116 is now compellingly necessary!
It will take a touch with the lower line of the 2nd for gold to be allowed to start a persistent counter-reaction over weeks respectively months again. If the lower line of the 2nd breaks with a monthly close below 1100 in November and/or December 2014, it will go down rapidly. The 1100 should be reached till December 2014 since this mark is a derivable downtarget in a weekly GUNNER24 Down Setup!
A daily close below 1165 in November 2014 means that the next lower important monthly support horizontal at 1148 should be reached in fast manner.
A weekly close below 1150 in November 2014 means that 1116 will be reached as early as in November 2014.
==> The 1172 as well as the 1148 were considered to be just intermediate stops on the way to 1116 resp. 1100! The terrifyingly strong downwards momentum that within 3 trading days cracked the 1222 (important monthly horizontal support, now strongest monthly resistance) as well as the upper line of the 2nd double arc support support at 1209, the psychologically important 1200 and the triple bottom at 1180 does not augur anything good. The 1172 support may hold 5 days or so leading gold back to a test of the 1200 area. At the latest from there the downtrend is supposed to gather pace again.
In these whipsaw markets of the last weeks that might confuse any trader thus leading mercilessly to burning the trading account the professional signals have got their special importance. You get them in the GUNNER24 Gold Trader!
You best register with our GUNNER24 Gold Trader now. That’s where we oversee the optimal entries and exits for you. Especially in the difficult market situations where many factors have to be considered the Gold Trader is backed by the additional GUNNER24 Signals based on the combined 1, 4 and 8 hour setups to catch the optimum entries and exits.
|

The GUNNER24 Gold Trader will provide you with the critical knowledge you need to forecast and analyse the precious metals with the GUNNER24 Forecasting Method. All the GUNNER24 Trading Signals you receive real-time are based on the actual Gold and Silver Future. The NEW GUNNER24 Gold Trader is a must for every actively working investor and trader who wants to trade successfully in everyday trading. The insights you receive from the head trader Eduard Altmann (and discoverer of the GUNNER24 Forecasting Method) are truly amazing sometimes. I promise!
Click the button below and order the GUNNER24 Gold Trader - $39.90 US a month. For 201 members and up - $49.90 US a month.
 |
Be prepared!
Eduard Altmann