
Today, I’d like to go into the bigger picture incl. the expected course of Crude Oil. The last few weeks, increasingly I received requests on this item by GUNNER24 Traders who are often bang on target after all when it comes to important and tradable turns in different markets.
Crude Oil is in a confirmed bear market that is expected to bottom at 34$-33$. This, it will resp. it should test back at least the bear market lows of the year 2009 perhaps falling below them. In the free GUNNER24 Forecasts, issue 08/16/2015, I expressed my expectation that this price target was most likely to turn up in quarter 4/2015 and less likely in Q1/2016.
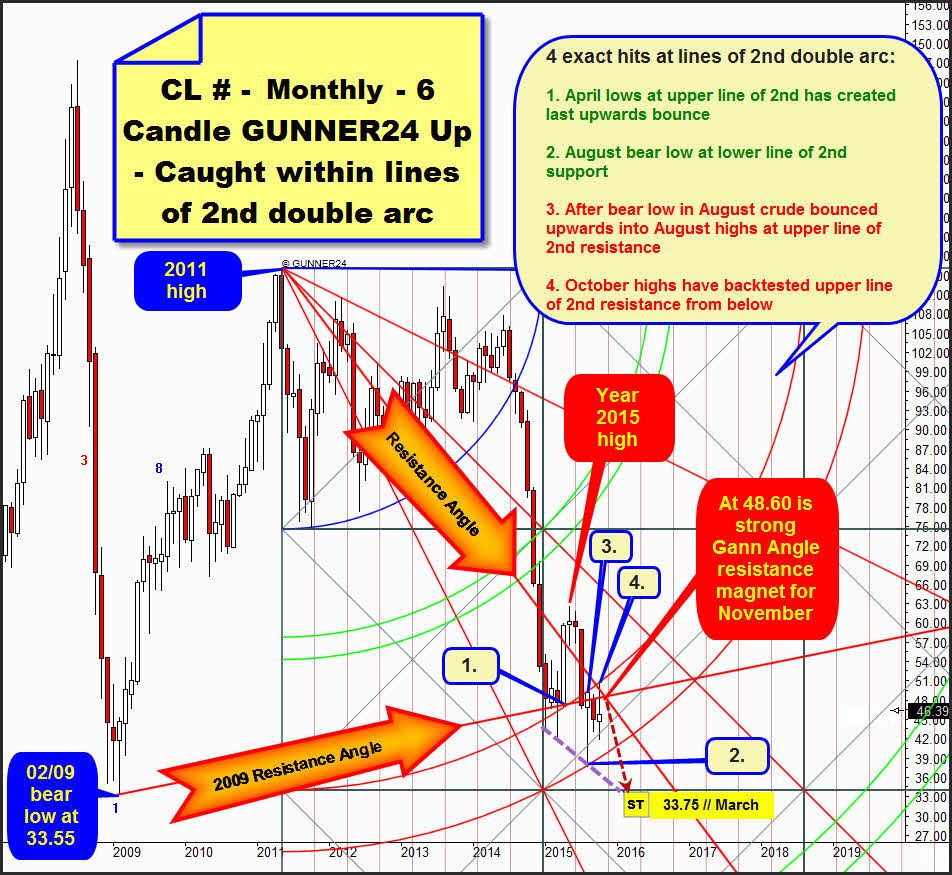
The following 6 Candle monthly up, starting at the 2011 countertrend high is what I analyzed intensely within the free GUNNER24 Forecasts 05/17/2015. At the moment, it is the most dominating GUNNER24 Setup in the monthly time frame. So, go ahead and use it just as I do at present, for possibly arising trading signals and upcoming investment decisions:
I refrain today from revealing the complete signal impact of this important setup since 2011. Also by the help of this setup, I considered Crude Oil most intensely several times since mid-2014 as however something has been brewing up there what in turn facilitated some most promising trades. You may look up the preceding analyses/signaling on this setup – beginning at the 2011 countertrend high – in the publicly Newsletter Archive in: www.GUNNER24.com at: www.gunner24.com/newsletter-archive
Let’s now cast a glance at the last 10 months/candles, I mean at the complete development in 2015.
==> The importance of the 2nd double arc and the 2nd double arc lines for Crude Oil:
It was at the January 2015 lows where the upper line support of the 2nd double arc was tested for the first time. A weak rebound followed after the first test of the upper line of the 2nd. At the January 2015 low there is the first anchor point of the dotted purple support line, directed downwards.
At the March 2015 low, the downwards directed dotted purple support line was finally cemented. The March 2015 candle succeeded once more in closing above the 2nd double arc.
At 1., we recognize that the April 2015 low was brought in at the support of the upper line of the 2nd double arc. This is also where the price met the important 2009 Angle – springing from the 2009 bear low - then still functioning as support. At the April 2015 low, by means of these two combined supports on monthly and yearly base, a powerful bounce started that led to the strong +performance of April 2015. ==> The April 2015 delivered the best performance on monthly base since mid-2012!
It was but the matter of a short-covering rally topping out in May 2015, likewise generating the year high for 2015 the same month. Afterwards and in the further course, Crude Oil declined further into 2.
The upper line of the 2nd support as well as the 2009 Angle – important!! – became easy victims to the decline that came after the year high 2015. The 2009 Angle is thereby future important resistance. As a proof for that, e.g. the September 2015 opening was exactly at the 2009 Resistance Angle. After this backtest of the 2009 Resistance Angle, September 2015 closed in red!
Furthermore, also October 2015 closed BELOW the 2009 Resistance Angle!
At 2., exactly at the support of the lower line of the 2nd double arc and at the third touch point of the downwards directed dotted purple support, the year low 2015 war brought in = in August 2015, the current year low was reached. From the low at 2., another bounce up to 3. ensued.
The high at 3. = the August 2015 high, tested the lower line of the 2nd double arc from below – negatively!
Likewise, the just passed month of October 2015 tested the lower line of the 2nd double arc from below, at 4. Again bouncing downwards from the – by now double-confirmed – resistance of the upper line of the 2nd double arc!
The lines of the 2nd double arc have onwards the following function:
==> The upper line of 2nd is an important resistance in the monthly time frame by now AS WELL AS CURRENT YEAR RESISTANCE. This means, the upper line of the 2nd double arc is the most important resistance for the rest of the year 2015 and for the entire coming year 2016 and perhaps even for the whole year 2017 etc.
==> The lower line of the 2nd is now important support on monthly base AS WELL AS CURRENT YEAR SUPPORT. This means, the lower line of the 2nd double arc is the most important support for the rest of the year 2015 and the most important support for the entire 2016 and perhaps even for the whole year 2017 etc.
We realize now that for as many as 3 months, Crude Oil has quoted completely within the lines of the 2nd double arc. From above, the upper line of the 2nd is exerting resistance now on monthly and yearly base, and from below the lower line of the 2nd is supporting now on monthly and yearly base.
==> As no impulsive impulse is to be seen since the year 2015 low at 3., oil having reacted rather weakly positive upwards since the bear low and Crude Oil trading now simultaneously within the lines of the 2nd double arc, so at present Crude Oil is in a consolidation at the lows, the space between the lines of the 2nd functioning now as support, as a probably rather weak future support.
=====> Crude Oil – since it is consolidating now rather weakly above the bear low – is supposed to lose this support of the 2nd double arc in future! Ergo, it should be able/forced to reach even lower bear lows!
=====> I stick to it: Crude is expected to be able/forced to reach the 33.75$ downtarget within this bear. It is likely to at the 4th hit with the purple dotted support line, some day in spring 2016!
====
Just in theory, the support exerted now by the space of the 2nd double arc may continue resp. persist for many more months. Crude might – is allowed to – trade within the lines of the 2nd double arc for months now without leaving this space.
Since the space within the lines of the 2nd double arc is weakly bending upwards as well, the next months, too, might perform in a slightly positive course until Crude Oil leaves the space between the lines of the 2nd double arc either upwards on monthly closing base = FIRST TRUE monthly buy signal!
…or downwards on monthly closing base = next important monthly sell signal!
Next up, please pay attention to the 48.60$ resistance for November 2015. At this price, two important angles intersect. One of them, thee Resistance Angle, is derived from the countertrend high of the year 2011. The other one, the 2009 Resistance Angle, comes from the 02/2009 bear low.
At 48.60$, both angles form the strongest monthly resistance magnet for the month of November 2015. At the same time, they also shape the next higher resistance magnet for the rest of the year 2015, there:
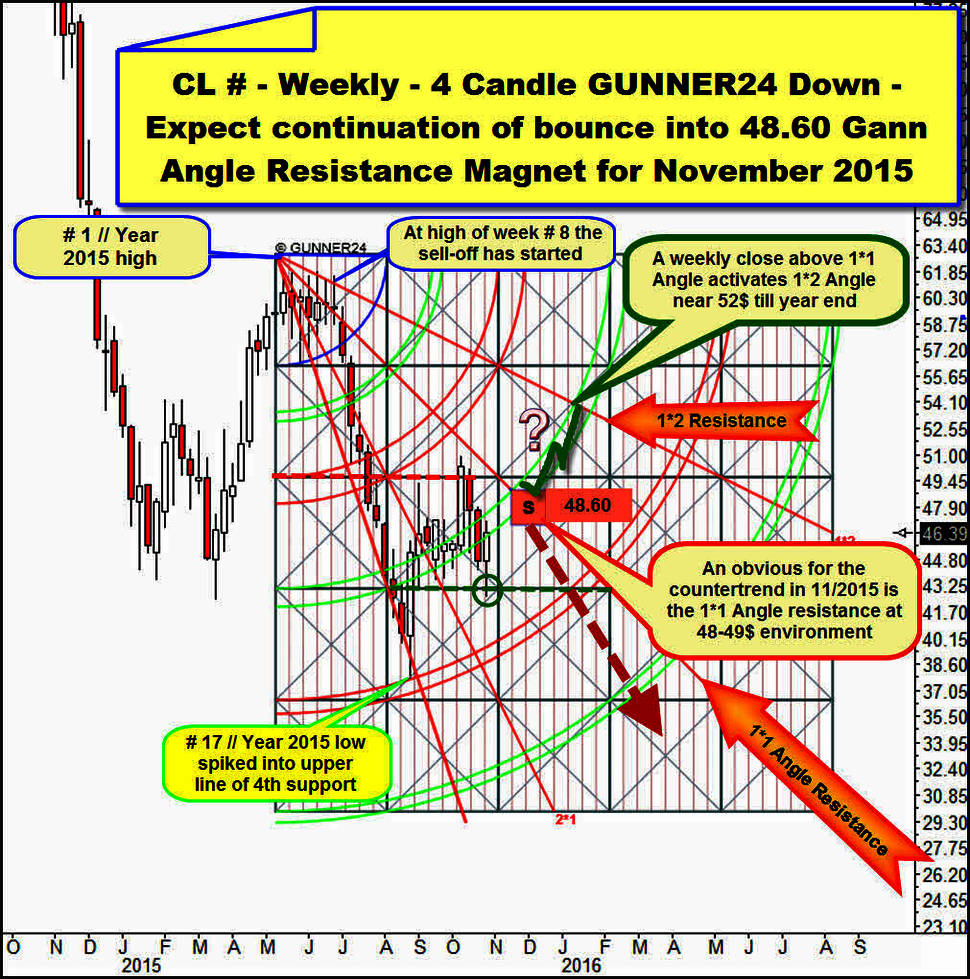
The 48.60$ are also the next higher resistance = resistance magnet – if we consult the weekly chart and the currently most important GUNNER24 Setup on weekly base.
For this is where in the near future the 1*1 Angle resistance springing from the achieved year 2015 high takes its course.
==> Thereby, at resp. narrowly around the 48.60$ the combined weekly, monthly and yearly resistance is situated in November 2015. So, it’s a true monster resistance what the high time frames reveal together.
I think, most certainly this countertrend is going to reach/work off the 48.60$ November 2015 magnet within the next 10-15 trading days!!, because the last week candle closed strongly after another spike low had been made, thus a first important higher countertrend low was most likely to have been achieved in the course of last week!
==> The 48.60$-resistance magnet is the ideal entry price for a short-engagement in 11/2015. This is where the countertrend that started exactly at the upper line of the 4th double arc support with the year 2015 spike low, might come to its first lower high. And of course, such a lower countertrend high might be the trigger for Crude Oil to sally forth to go directly from there into the 34$-33$ target region for spring 2016 (please observe the red dotted arrow scenario)!
==> The stop-loss (SL) for a short-engagement at 48.60$ may be set rather narrowly: Stop-loss (SL) for short at 48.60$ in November is a first weekly close above des 1*1 Resistance Angle!
==> Each single weekly close above the 1*1 Resistance Angle in November 2015 should lead to the 52$ mark to be reached by Crude Oil, supported by the 3rd double arc, till year-end because in a GUNNER24 Down Setup every weekly close above the 1*1 Angle always makes the next higher important Gann Angle automatically become the target. In this case, it is the 1*2 Resistance Angle. With its last touch at the high of the week # 8, this angle was the trigger that forced Crude Oil to sell-off down to the low of # 17 = year 2015 spike low.
Yet, at the latest at the 52$ region, after a possible backtest of the 1*2 Resistance Angle the whole countertrend is supposed to collapse like a house of cards expiring by the end of 2015/beginning of 2016 in order to work off successively the 34$-33$ target region for spring 2016.
==> It is, on the one hand, because the 1*2 Resistance Angle in the weekly chart should be a tough, nearly insurmountable countertrend resistance, and on the other hand in this case the upper line of the 2nd double arc resistance in the monthly 6 Candle up setup presented above would be reached again = the most important main resistance for the rest of the year 2015 and for the new year 2016.
Be prepared!
Eduard Altmann