
I'd like to invite you today to analyze together the monthly GUNNER24 Up Setups on the US stock markets, on gold and on silver. October is all over, and I expect the rallies to go on. Yeah, in my sight it's really going off now. Up, up and away through March 2011. Viewing at the monthly GUNNER24 Setups on the markets, actually a phenomenon is to be seen which I don't remember to have noticed before that frequently in the markets observed by www.GUNNER24.com.
That phenomenon is based on the time factor. It's the time that allows the price to rise or to fall. The time limits price moves and defines points of change in the price course. The reason why GUNNER24 in my view is that new and revolutionary in the environment of the technical analysis is this: All we're optically shown by GUNNER24 can always be connected with the important time factor – the blue arc, the VERY IMPORTANT double arcs, Gann Angles and – of course – all the lines put out by the square itself.
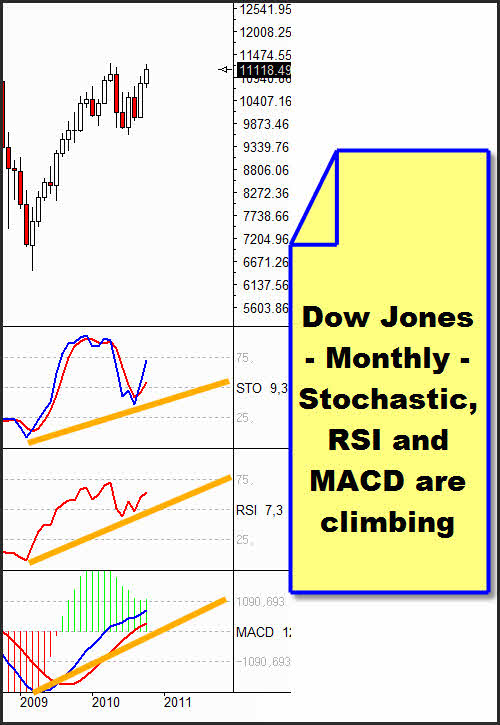
See above an overview table of the most common tools of Technical Analysis. The RSI is a momentum indicator. The stochastic is a momentum oscillator, and the MACD is a trend following indicator. But those tools only depict the actual condition of the markets being calculated by means of PAST price observations. The time factor is left out, they don't tell us directly what is going to happen tomorrow. Apart from that a quick look at those conventional tools is enough to see that the markets will have to rise in the long term!
Next Monday, with the stock market opening you'll witness a time slip:
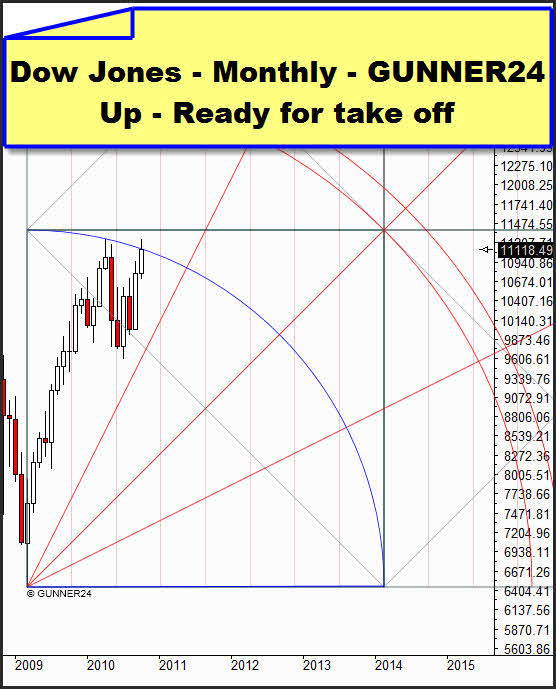
On Monday the November candle will be shaped. Above, I simply formed the vector from the March 2009 low to the April 2010 high. That vector depicts the blue arc. We see that the Dow Jones closed EXACTLY upon the vector with October closing. The rally of the last four months was influenced by the blue arc. Well, the price wanted to get there. It was a great magnet which last trading week again emphasized its influence implementing a mini correction on daily basis last Monday that forced the marked exactly until Friday closing exactly back to the magnet.
And now to the description of the phenomenon. In all probability that magnet shall loose its influence. With the opening of the November candle the market will "skip" the resistance of the blue arc. Unless, yeah, unless it opens with a gap down. I'm not assuming so for now. If the market opens at least at the same level it closed on Friday the "obstacle" of the blue arc will have been cleared. Just like this. Time is mature for it.
Also the next two GUNNER24 Up Setups show the importance of the opening by 11/01:
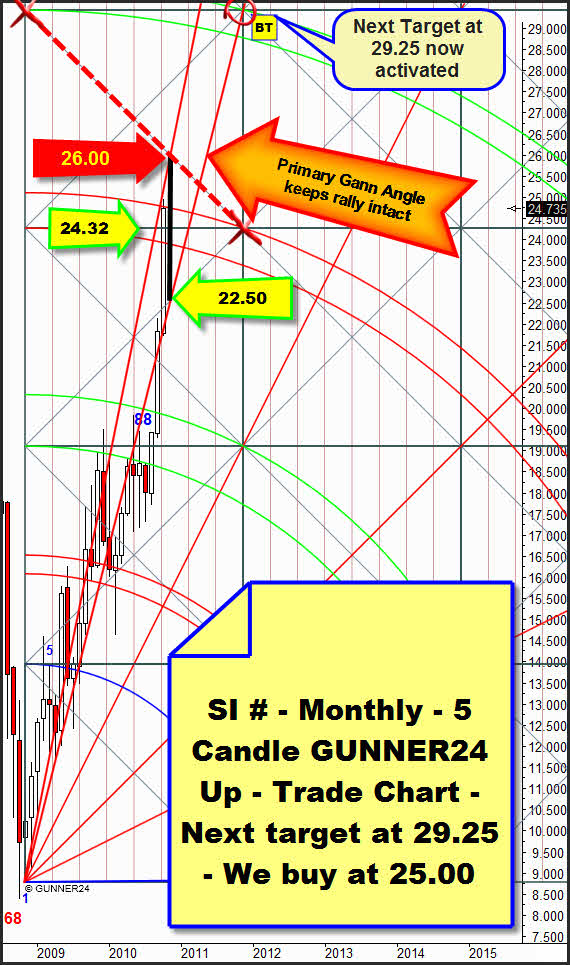
In the monthly 5 Candle GUNNER24 Up of the silver continuous contract, because of the super strong Friday I can imagine an up gap at opening. In that case, on the time level silver, too, would have cleared at once the upper line of the 3rd double arc. From one day to another a resistance converts into a support.
Of course for that reason you can't expect now that the upper line of the 3rd double arc is not going to be tested or re-tested intensely in November. After all the other market participants don't have the faintest idea what "time" really means, and the shorts are fighting for the mark of 24.70-25.00 being able to the silver fall even lower after the possible 26.00. I sketched the elbowroom for the November candle in the setup. But we KNOW more than the others do, and in the further course we'll have to keep in mind that the 3rd double arc will be cleared by the TIME FACTOR if silver really does gap upwards or if Monday closes green respectively.
All in all silver is ready for another take off. Highest week closing price during 30 years. The monthly closing price within the 3rd double arc activated the target of 29.25. I can only say: Buy any dip...

With Friday, the gold future gave an important signal, as well. The next up swing should be on the agenda. I even believe I can see that gold closed narrowly above the 3rd double arc! For the time being, October overcame the primary Gann Angle. Another positive signal! 1410 will be the next important target here, 1315 should be a mega support for November.
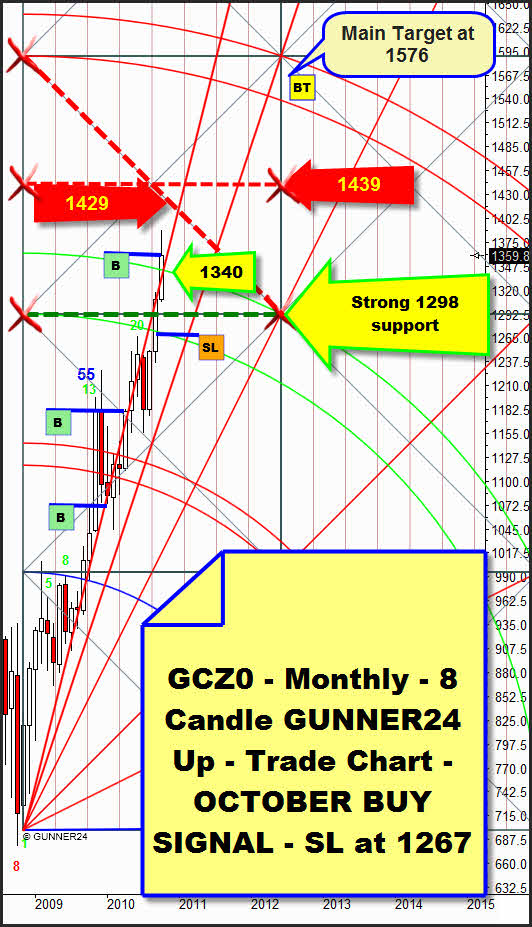
In the actual 8 Candle GUNNER24 Setup on monthly level we've received another buy signal. The 2nd double arc was broken significantly. All the supports and resistances are defined.

To round off the overview of the precious metals let's have a quick glance on gold in the daily setup.
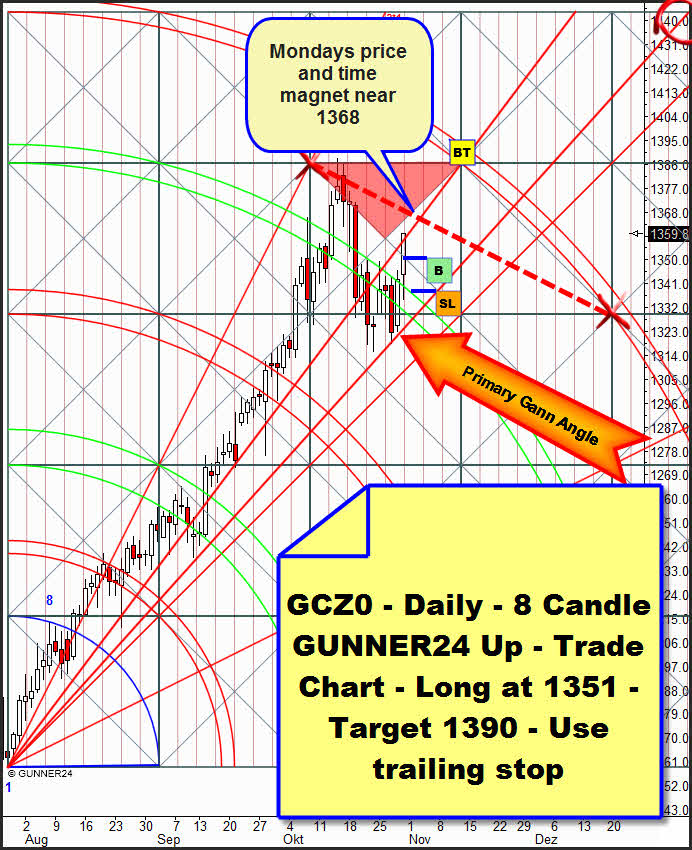
On Wednesday the gold future was supported by the new primary Gann Angle testing there the low of the week before last, as well. A higher low was formed. As analyzed in the last issue the important 1320 monthly and weekly supports resisted, and as analyzed by its Thursday closing price of more than 1340 (1342.5 to be precise) and the daily close within the 4th double arc, gold prepared the resuming of its main trend.
It was pretty clear that a new high over 1350 could be used for a new long entry. At 1351 we had us been stopped into the market since that's where the break out mark of the shaped flag formation was situated.
At 1365-1368 we will have to observe the market well because that's where the resistance area above the price begins (red triangle). Furthermore the setup anchored resistance diagonal is getting involved. Actually those are some violent resistances which might make us trace the SL narrowly above the entry. We will have to place the buy target depending on the power of the likely rebound at the 1365-1368. If the market goes on orienting by the primary Gann Angle on 11/11 the buy target will be at 1390. If the Friday course continues next Monday and Tuesday resulting the 1365-1368 as to be a minor resistance until Thursday 11/04 the 1410 might be reached. Since because of the seasonality there's still the possibility of a longer lasting correction in the upwards trend you should keep watching the 1*1 Gann Angle. If that one breaks on daily basis we'll have to reckon on a three to four week correction.
To close the circle I'd like to go briefly into both other US stock markets.
Monthly 3 Candle GUNNER24 Up for the S&P 500:
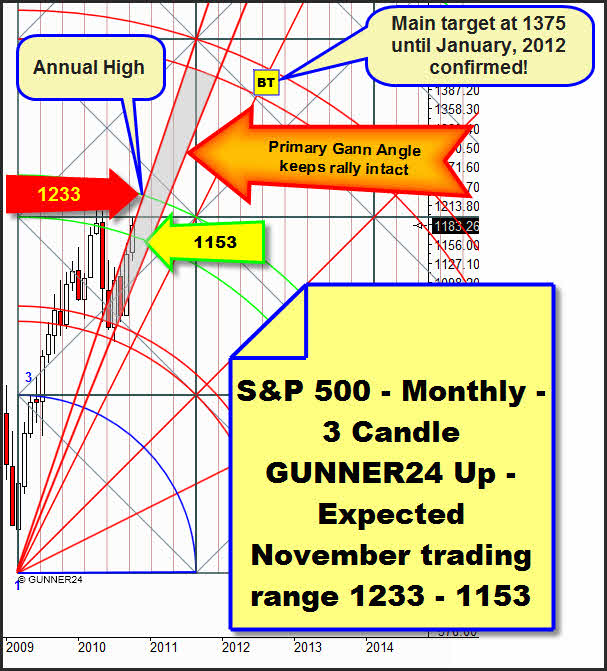
The market is moving at the uppermost end of the Gann Angle corridor (underlaid gray above), but it can't break it. The second closing price (after April 2010) within the 2nd double arc confirmed the target of 1375. We expect the year high to happen by the end of November/beginning of December at 1233. Corrections should be limited to 1153 in November. The market may fall back to the primary Gann Angle without loosing its rally ambitions. That would be excellent buy opportunities for all the newcomers.
Monthly 3 Candle GUNNER24 Up for the NASDAQ-100:
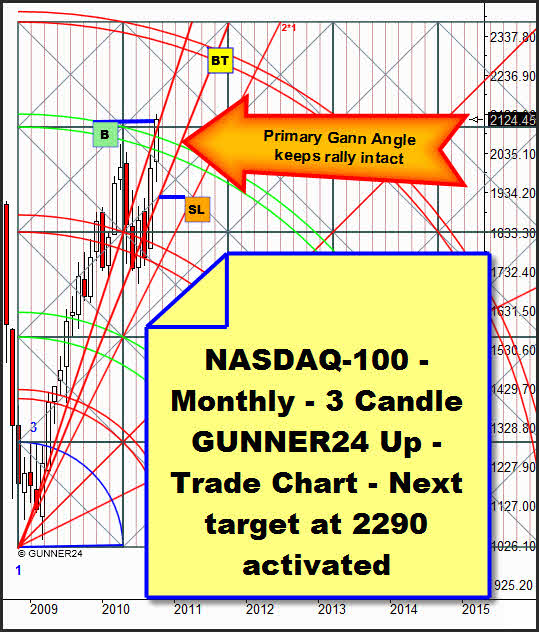
Here, there was another buy signal. With October the market broke the 4th double arc significantly. The monthly target is at 2290. Besides, the index is trying to leave its Gann Angle corridor upwards. The attempt could result to proceed much more successfully than in the S&P 500. Also consider about it all the up targets in the weekly and the daily time frames. In the issue of 10/24/2010 of the GUNNER24 Forecasts I analyzed them for you in depth.
Be prepared!
Eduard Altmann