
In today’s issue, I’d like to center upon the present signaling of these two majors, basing on the monthly time frame.
Whereas the S&P 500 (together with the NASDAQ-100) is clearly situated in a confirmed uptrend yet, certainly being due there some further highs in 2014, for quite some time the DAX (together with the other leading EU stock market indexes and the widespread US American small-cap Russel 2000) has been in an extensive correction in the uptrend that may continue several more months. Thereby, some lower lows will have to be expected there during the coming months.
For the year 2014, Gann’s decade calendar prognosticated a sideways course with positive cardinal tendency for the western, and especially the US major stock markets however. Thus, the 2014 close should have got near to the 2014 opening, preferably narrow above. It should have had to come to a 10-15% correction in the bull market during 6-8 week in order to accumulate energy for another sharp up-leg due to top out in 2015. Whereas Dow Jones and Russel 2000 respectively also the DAX are likely to fulfill the forecast of a sideways year at least roughly, S&P 500 as well as the US tech majors are denying such an outcome. Let alone the expected -10-15% correction in the bull-market.
Some attempts for this correction course according to time and price (-10-15% within 6-8 weeks) were thoroughly there. At the beginning of 2014, as early as in January, the US markets corrected for but 4 weeks however – by only about -8% (in the case of the S&P). The tech indexes (NASDAQ-100/Nasdaq Composite) corrected just for 5-6 weeks from March 2014 losing at it about a -9% .
At the beginning of February, with the flaring of the Ukraine and Crimea crisis respectively the Ukraine civil war, the so far only considerable correction of the S&P 500 in 2014 came to an end after just 4 weeks. In retrospect, the investors seem to have started – following the well-known motto "buy when the cannons rumble" – the flight into the US stock markets.
Since then, everywhere in the world new trouble spots, crises, wars have developed and the worldwide civil unrest intensified. So we can’t work on the assumption that the state of the safe-haven function of the US markets might change anytime soon. The S&P 500 as well as the NASDAQ-100 and the Nasdaq Composite are thereby supposed to settle down another flawless uptrend year. I mean, the year 2014 is expected to close at the year highs again in the mentioned indexes!
S&P 500 – monthly 13 Candle GUNNER24 Up:
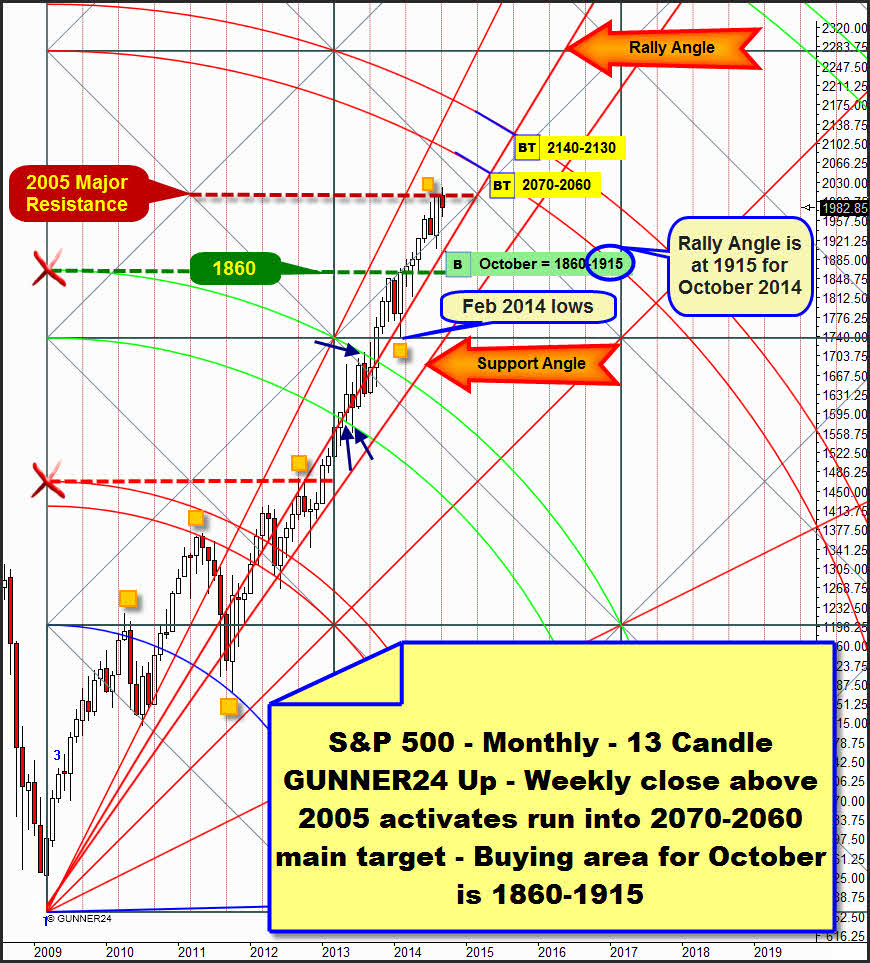
Never before, I have presented the setup above. It was just 2-3 weeks ago when I realized its validity and importance. Of course, I always try to check respectively verify the classical 2, 3, 5, 8, 13 and 21 sequences of the initial impulse and the respective resulting forecasts. Until a couple of weeks, somehow never crossed my mind that the S&P 500 orients itself by the forecast above that measures the first 13 months since the 2009 low. In the 13 up, the index is following certainly few but extremely important predefined magnets – resistances/supports/turning marks.
I marked each of them with an orange square in the chart. In hindsight, my difficulties to validate the setup is due to the fact that the market has hardly taken into consideration the 2nd double arc respectively completely denied the normally appearing resistance function that a double arc exerts in an up setup. We recognize – actually just wraithlike – that the environment of the 2nd double arc must have given some resistance respectively support at the respective monthly lows and highs = blue arrows.
In my opinion, the setup is absolutely valid and its signaling trustworthy now because the low of February 2014 and the high of August 2014 are in a perfect mathematic correlation. The February 2014 low was marked exactly at the lower line of the just passed square and the August 2014 high exactly in the center of the just passed square. Thus, the 2005 horizontal is the currently dominating monthly horizontal resistance!
That’s what the market will have to overtop to finally head for its next main target, the 3rd double arc.
According to the GUNNER24 body of rules, the 3rd double arc is activated as the next higher uptarget and confirmed as target after all, because the 2nd double arc is clearly overcome on monthly closing base.
==> A monthly close above 2005 – actually not to be expected for September since just only 2 trading days are left… - OR THE NEXT WEEKLY CLOSE ABOVE 2005 will activate the final run to the lower line of the 3rd that takes course between 2070 and 2060, depending on the month. After overcoming the 2005 either on weekly or on monthly closing base, the lower line of the 3rd will technically be supposed to be reached until year-end 2014! I.e. the S&P 500 is likely to finish the year 2014 near the 2070-2060. If this is the case, it will be allowed/possible that the upper line of the 3rd will have to be headed for till May/June 2015 then = 2140-2130!
The market may start its sell-off any time after reaching respectively working off the lower line of the 3rd double arc however, or finish the complete bull-market declining badly for 12-16 months. At the latest after working off the upper line of the 3rd double arc, a 12-16 month bear-market move will be likely to start though.
==> October, as we all know, is always threatened by corrections. It’s traditional that the Big Boys often want to use that fact for generating panic attacks. Well, the market is presently correcting the attaining of the 2005 monthly resistance horizontal. September seems to be willing/obliged to close in a minus, thereby confirming the fact that September traditionally shows weakness almost every time.
A monthly resistance may release strong energy thrusts. Thus, and especially because in October frequently a strong nervousness begins, the market is allowed to shock and appall the bulls a lot. That’s why the market may fall now in October down to the Rally Angle recorded above. This one is at 1915 for October 2015. That’s where the first good buying zone for the resumption of the uptrend and the 2030-2040 main target is.
Yet, if a trading week in October 2014 breaks the 1915 monthly Rally Angle support – a weekly close below 1910 should be striking enough for that – at first the August low (1904) will be likely to be broken consecutively the index being able to reach its very strongest monthly support at 1860 till the end of October. At the latest at this important GUNNER24 Horizontal the year-end rally up to 2030-2040 should have to start then. Technically, the August low at 1904 is not likely to be broken downwards in October. That’s my assessment.
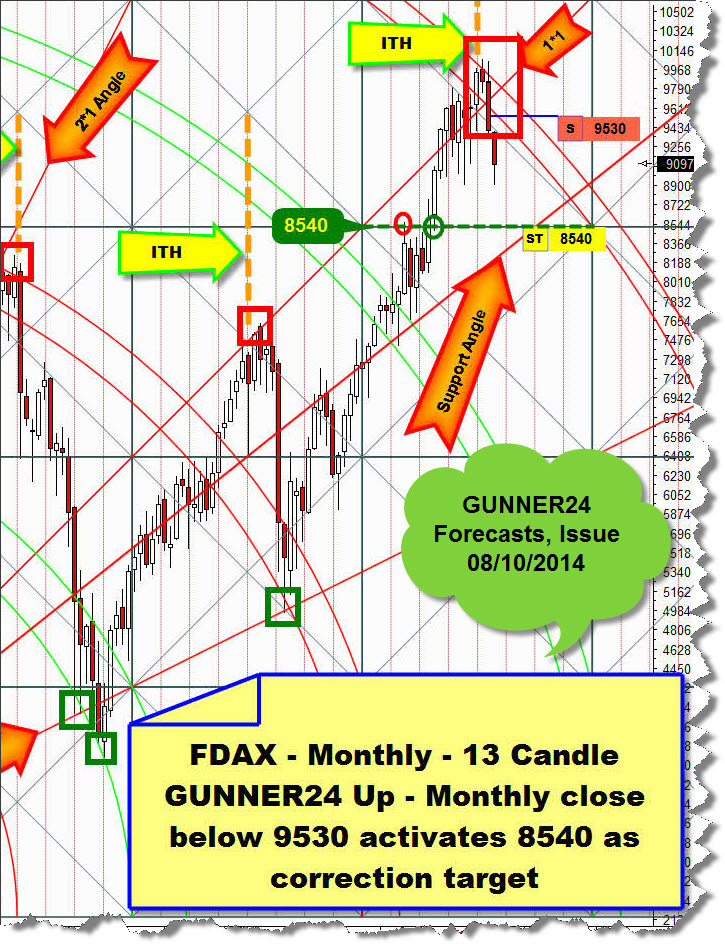
The DAX is in a confirmed downtrend on daily and weekly base.
It was the free GUNNER24 Forecasts of 08/10/2014 where I last outlined why the DAX might have topped out perhaps respectively most probably for several months, maybe even years with the all-time highs of June 2014. The June 2014 all-time high was visibly marked again at an important time line (ITH). Since 2003 the DAX has been tending to top out starting several month corrections at important ITHs:
Fundamentally, there is nothing to object against the thesis that the DAX and - since it is the leader of the European indexes – with it the entire rest of the stock environment in Europe will dive/correct now for several months or even years. Europe is toast in respect of the general growth prospects, the long failed experiments of the Euro and the Brussels central government, its degree of indebtedness etc. Wedged in between the interests of the USA and the powerful emerging Russia-China alliance it’s the featherweight between two heavyweight champions in the ring, sooner or later being forced to keep on diving into the mediocrity in economic terms.
Only Draghi with his liquidity bazooka – the next salvo is going to be fired at the beginning of October – is able to slow down respectively detain on a high level the fall of the European stock market indexes. Some day however, all the dams will break because the indebtedness degree of one country or several of them will make them crash into the abyss… the last one will turn out the light then.
The DAX – for analyzing and forecasting actually always I use the continuous DAX Future contract, the FDAX – is clearly on sell in the monthly time frame, with a minimum correction target 8545 first target, through 5-6 months.
For refining the forecast, with the Blue Arc of the final bear-low of the year 2003 instead of a 13 candle up impulse we measure now a 14 candles up impulse:
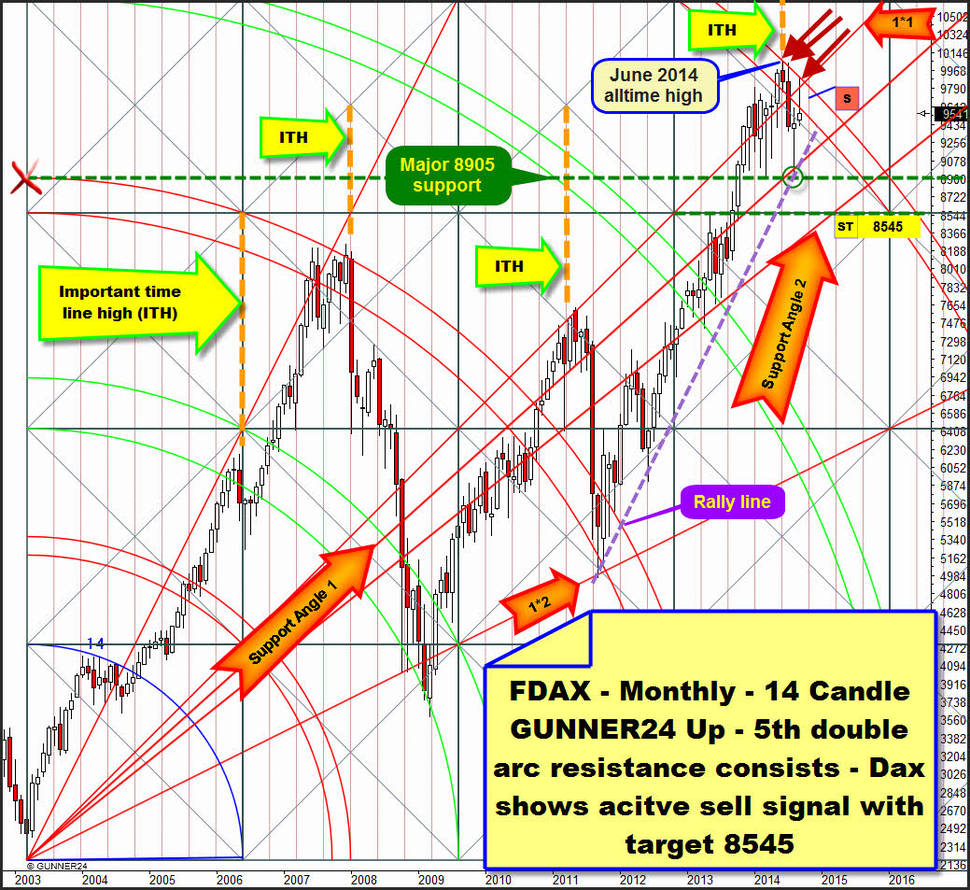
This is no infraction of the rules. The high of the 14th month is only 4 index points below the high of the 13th month. Focusing now to the main target of the 5th double arc, with this fine-adjustment we can determine now the course of the important monthly highs of June, July and, last not least, the current September rather exactly at the upper line of the 5th double arc – red arrows.
==> The upper line of the 5th is thereby confirmed as a sturdy and strong monthly resistance.
==> The July candle closed underneath the lower line of the 5th generating the currently valid sell-signal. Likewise, the August candle closed underneath the lower line of the 5th. September as well is technically supposed to close underneath the lower line of the 5th. Ergo, the lower line of the 5th is resistance on monthly closing base. The currently valid sell-signal in the monthly time frame keeps on enduring!
At the green thin circle, in August, the index came to its current correction low at the major 8905 GUNNER24 Horizontal Support and the purple rally line sketched in the chart and at the surroundings of the Support Angle 1. From there, the market had to bounce back to the 5th double arc main resistance.
Because of the fundamentally negative prospects and the fact that the index newly produced a top at an important time line in June 2014 – into the bargain exactly at the main target of the bull market running since 2003 and the subsequent negative bias – technically the existing resistance power of the 5th double arc should enable the FDAX to break the current August correction low at 8905. That’s likely to happen in October. Next lower target then will be the 8545, where the next lower important GUNNER24 Support Horizontal intersects the currently strongest Gann Angle support in March 2015.
I leave it to your phantasy however, all that will happen… and how low it may go… if the rally line is broken downwards, the uptrend-line that has been targeting the rise of th index for years.
It will take a monthly close above the 5th double arc for the current sell-signal and reaching of the 8545 to be denied. Such a close would be at 10000 for October.
==>> Just a brief announcement: Next days I´ll take a couple of days off. Thus, the next issue of the free GUNNER24 Forecasts will came out again on 10/12/2014.
|

„As far as I know", the GUNNER24 Forecasting Method is the globally unique and only technical analysis tool that deals intensely with the comportment of the market at support and resistance marks being able to combine that with price predictions. You’ll learn everything on these really "secret" facts in the Complete GUNNER24 Forecasting and Trading Course. Order now!

Be prepared!
Eduard Altmann