The plenty of time longed-for gold breakout took place last Tuesday. Almost 30$ up in one go. The Tuesday high was at 1276.5. In this issue, I'd like to elaborate intensely on how we can deal with such a breakout being GUNNER24 Traders. After such a brilliant rise personally I use to ask myself some important questions. Was that the absolute high for a long time because the market might turn at once? Should we wait for a counter reaction to get cheaply into the market again? Is that counter reaction really going to take place and how low would it be going? Generally, the old trader rule is valid: To wait for the first correction in order to speculate then into the trend direction again. In the traditional TA (Technical Analysis) frequently the Fibonacci Retracements/Pivots/Andrews Pitchfork or the support levels may help us along.
For us GUNNER24 Traders there's still the possibility to employ some GUNNER24 Counter Setups:
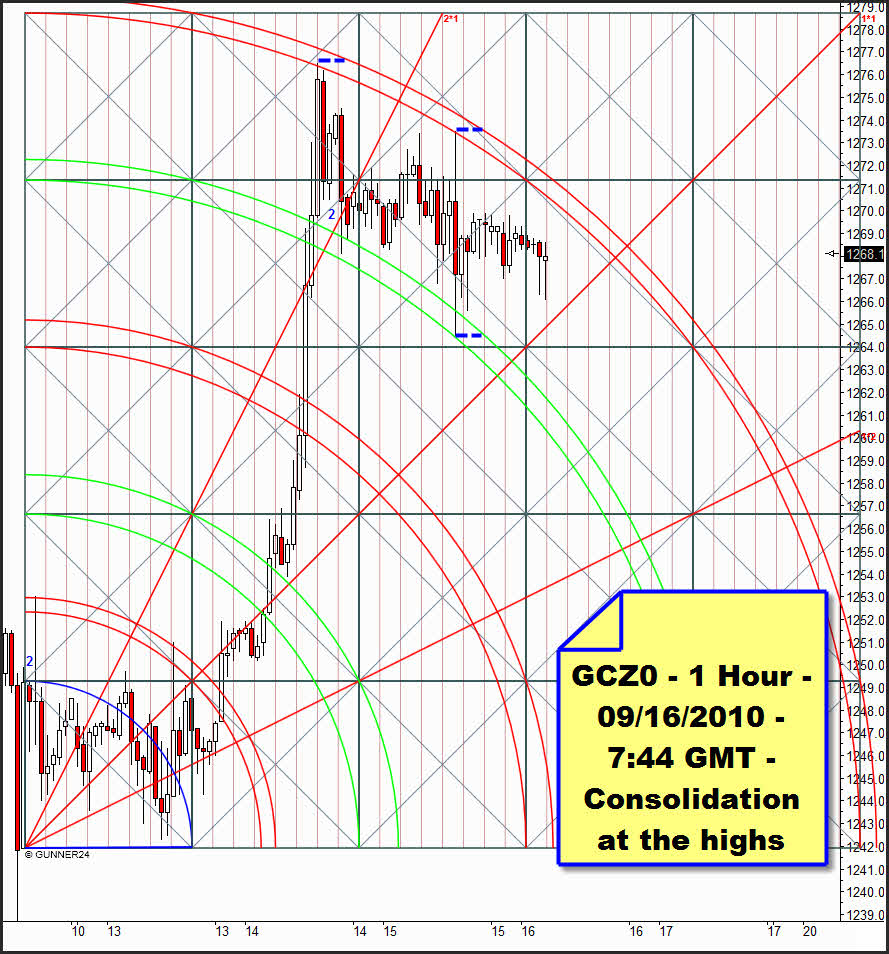
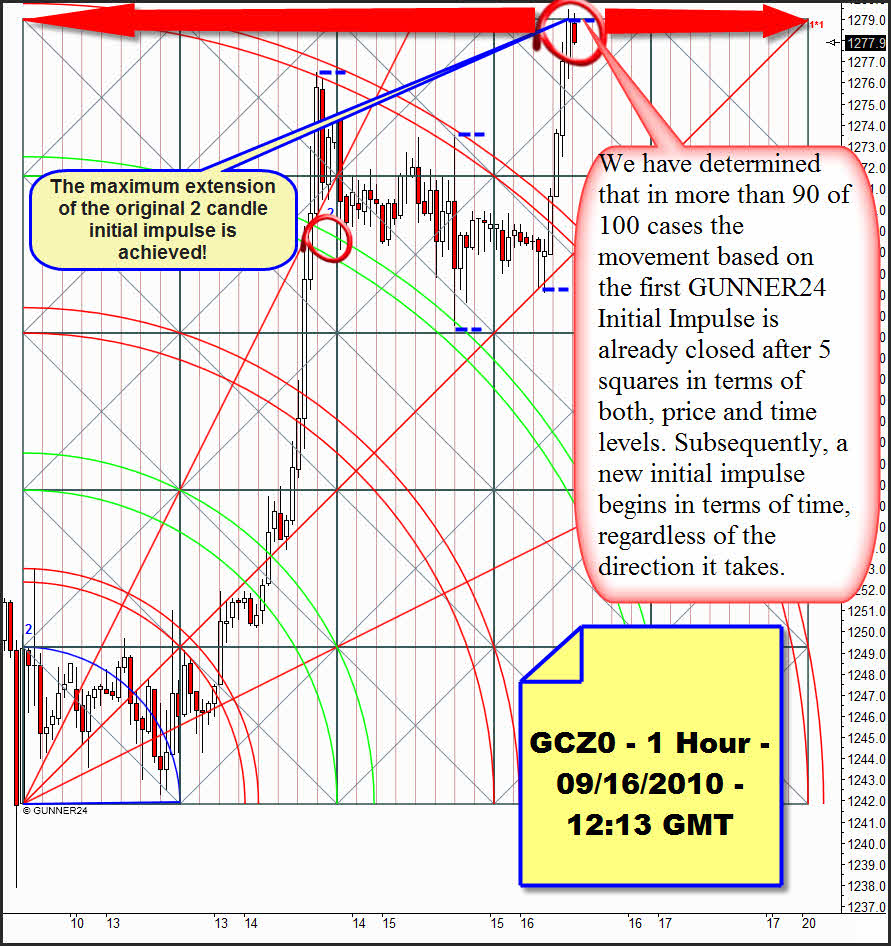
Where's the market standing? Not quite one and a half days after the all time high, in the 1 hour time frame of the 2 Candle GUNNER24 Up we recognize that the market is swinging to and fro between the forth and the fifth double arc. It touches the lines of those double arcs rebounding from them. The Tuesday all time high rebounded exactly at the lower line of the 5th double arc, and the market is consolidating downwards. The arising chart formation is equivalent to a flag (bullish). We consolidate at the highs (bullish). But when is the breakout upwards expected to happen? Is it going to be soon, or is the consolidation continuing for hours?
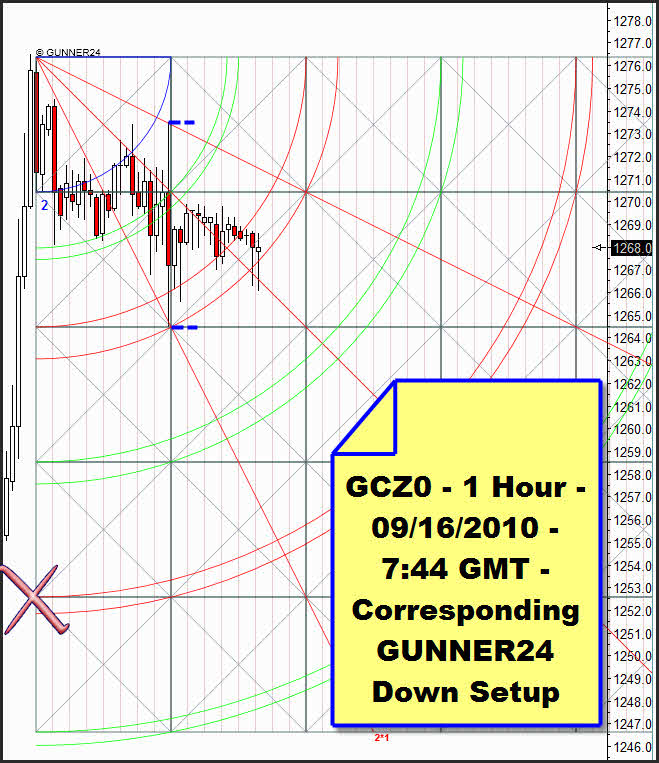
Above at the all time high, according to the rules we apply the actual 2 Candle GUNNER24 Down. Here again the price is developing appropriate to the price and time magnets. The last four hour candles closed within the 2nd double arc preparing the price for falling until the third double arc, according to the rules. A break of the lower line of the 2nd double arc would confirm that target. So a long lasting consolidation is threatening! But in case of the strong upwards trends such as the present one in gold (monthly, weekly and daily GUNNER24 Up Setups, see GUNNER24 Forecasts, Issue 09/12/2010) we'll always have to reckon on a resumption of the up swing and we'll have to SCRUTINIZE TWICE or THRICE all the present GUNNER24 Setups which give hints to act contrary to the main trend. That's why all the GUNNER24 Traders should often work with counter setups playing with them a little bit – and maybe you'll find out something fantastic.
Such as in this case:
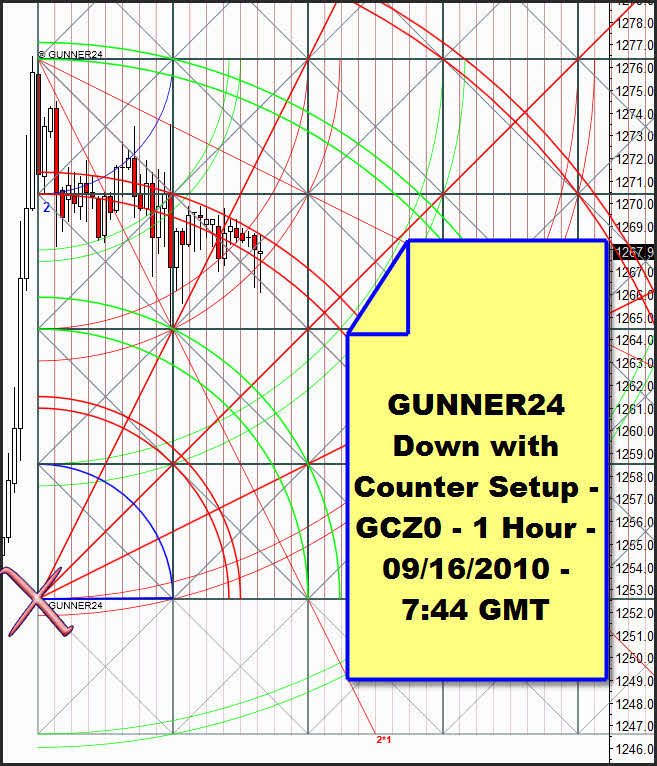
Exactly on the big X we apply a GUNNER24 Up precisely the same square size as the GUNNER24 Down. And suddenly the ambitious trader sees the light: For hours, the market has followed the 3rd red double arc of the counter setup downwards. During the very next hours it will come to the decision whether it's a breakout or a break through because the market is within both red double arcs. One of them will have to dominate for the future. Thus, also the decision will be taken which of both present GUNNER24 Setups will dominate in future.
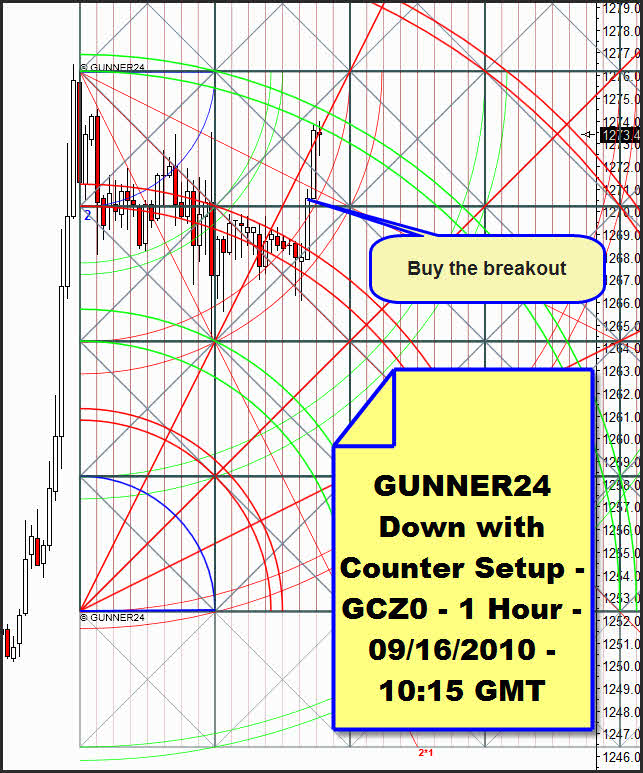
A couple of hours later you see how gold is parking at the 4th double arc of the counter setup after the breakout. In this situation we hedge the breakout trade by trailing stop.
 |
The Complete GUNNER24 Trading and Forecasting Course will give you the critical knowledge you need to forecast and analyze the markets with the GUNNER24 Forecasting Technique. The NEW course is a must for any trader/investor who wants to understand this innovative and revolutionary forecasting method and use it successfully in everyday trading. The materials in this course are all you will ever need if you plan to trade the markets and make a living doing so.
The breakout candle broke the 5th double arc. Here again a buy signal! Double signal = double safety! Further that 2 Candle GUNNER24 Up shows us that the up swing on hour basis should have ended.
Rule from out the GUNNER24 Trading and Forecasting Course: The dimensions of the 1st square are stacked and multiplied now until the 25 squares of the GUNNER24 emerge which depict a 90 per cent of the maximum extension of the GUNNER24 Initial Impulse.
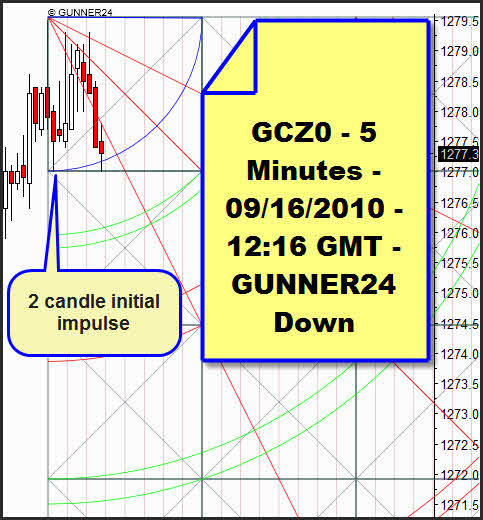
Just before 12:16 GMT I covered my long contracts because in the 5 minute time frame the following situation was developing:
At 12:16 GMT the 5 minute 2 Candle GUNNER24 Down looked as if it was on the point of producing the second sell signal that is the break of the blue arc. According to the rules, the first sell sign was 19.4 or 19.5, respectively which I had missed at that moment.
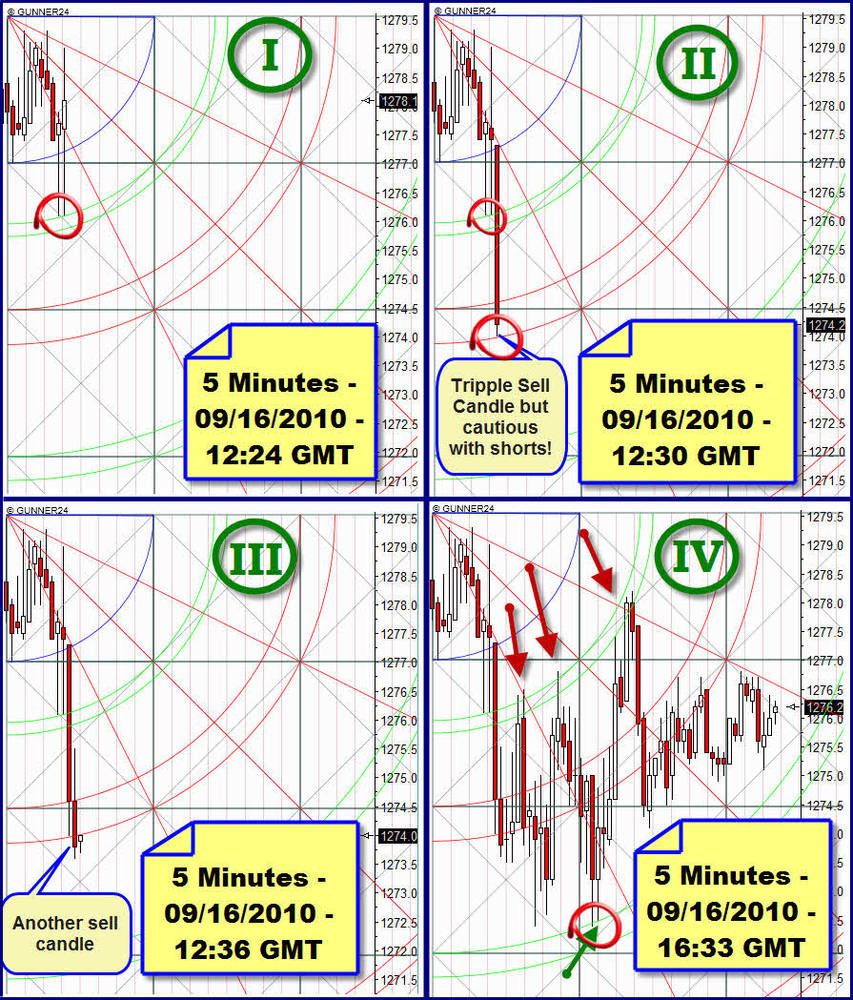
In the further course I didn't go short because from my point of view too many odds were against it. Let me explain the situation in the light of the following snap shots:
I: At this moment we recognize that the last two 5 minute candles have touched the upper line of the first double arc but both rebounded into the first square. There's no closing price below the first square yet. That bounce at the first double arc hints that the downswing might have ended already since in case of a strong up trend the first or second double arc respectively for the GUNNER24 Down Setup is the main target.
II. We've got a triple sell candle. Break of the blue arc, the first square and the first double arc. The candle touches exactly the lower line of the 2nd double arc indicating the end of the downswing accordingly. That again might precisely be the swing low...?!
III. From my point of view only the next candle gives the final signal that the main target of this downswing that is the 3rd double arc will be reached. But it is only 2 to 3$ away. There's something wrong with the chance/risk relationship.
IV. In the further course of the setup we recognize that certainly the 3rd double arc is spiked precisely but before and after the first double arc is tested. So it turns out to be a resistance. Below, at the green arrow you may apply the next 8 Candle GUNNER24 Up already. All in all it's a possible short opportunity with too much risk in it!
To the precious metals:
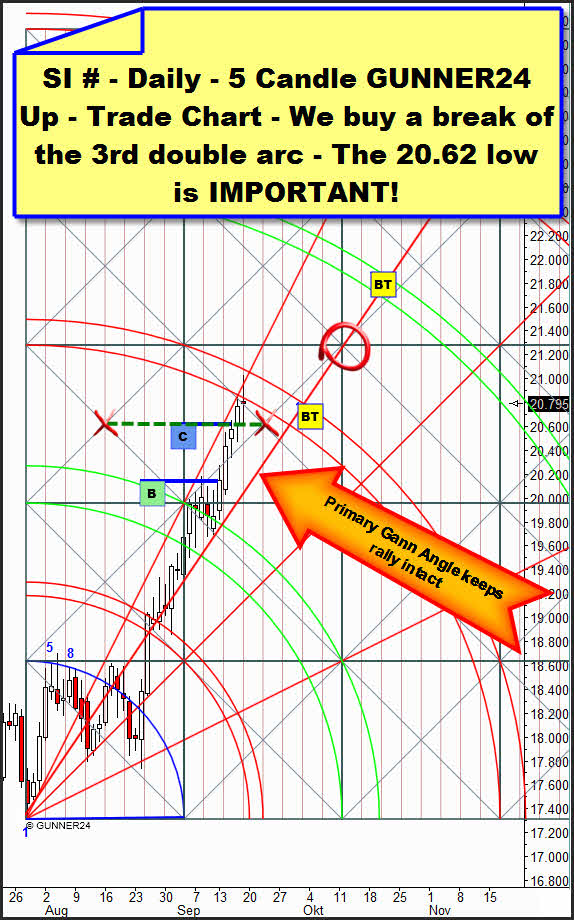
Silver has reached its main target. On Wednesday we covered our longs at 20.60. Unfortunately we missed half the up swing. But the Friday low at 20.62 demonstrates how important those 20.60 are. There, at the setup-anchored green support horizontal silver turned back upwards closing just under the main target. Tactics for next week: A break of the 20.60 would imply a decline onto the primary Gann Angle at about 20.10 to 20.20. That's where we would look for a new long entry using the Gann Angle Retracement Tactics. A break through of the main target would also be used for a long entry with target 21.80.
Gold:
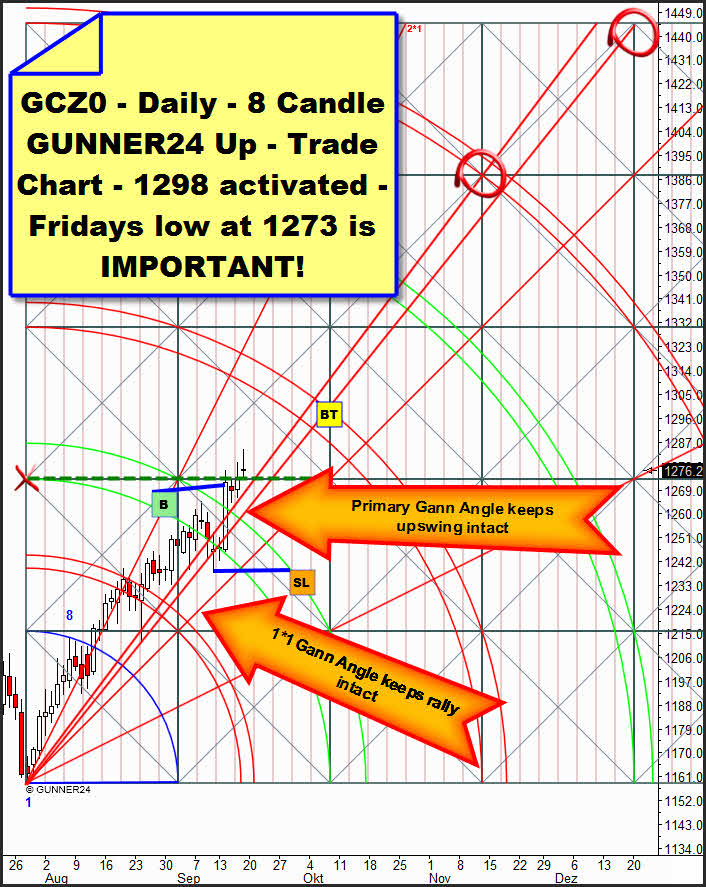
On Tuesday we went long at 1276. SL is 1238. Here again we'll have to give the market some elbow room downwards until the primary Gann Angle at 1265 or the 1*1 at 1255 respectively. After such a rally all the indicators have overheated showing negative divergences above all! Here again the Friday low seems to be very important at first glance. The setup-marked green broken horizontal was a resistance until Friday, with the Friday low it changed its state gradually becoming a support horizontal! On daily and monthly basis (see the break through of the red resistance diagonal, GUNNER24 Forecasts, Issue 09/12/2010) everything is on "go" with target 1298. Also by the weekly candle count we will have to expect a new high next week. It would be the 8th consecutive week! Actually still you may buy new highs on 1 or 4 hour basis without hesitation. SL at 1273 with reverse and double technique!
American stock markets – GUNNER24 is going long on weekly basis.
For today, I'd like to leave the long entries without great comment.
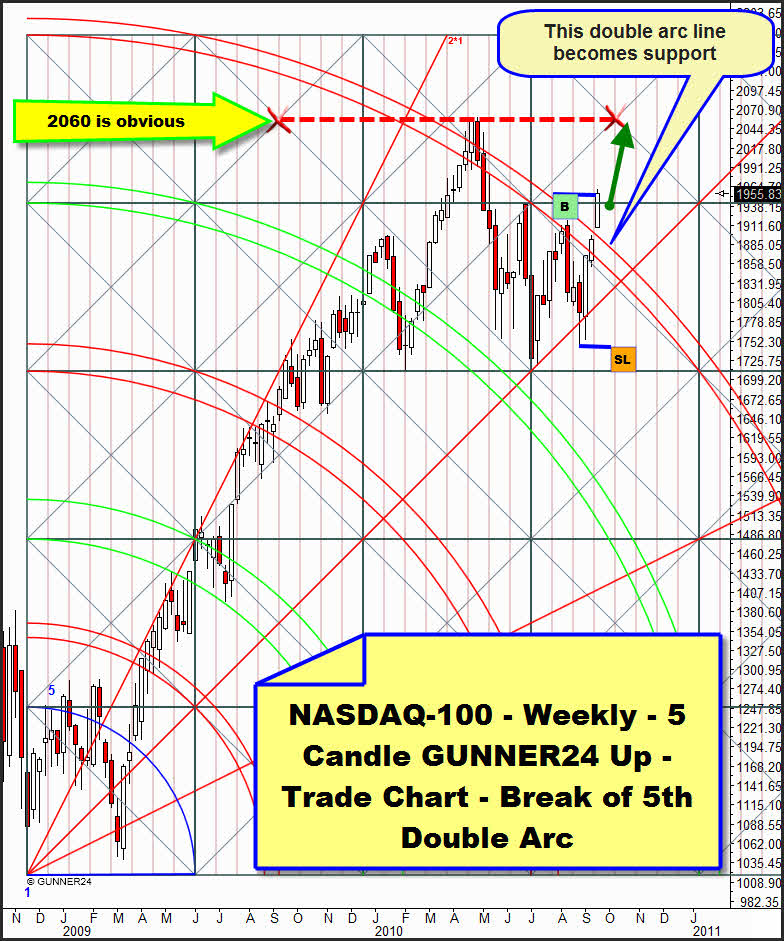
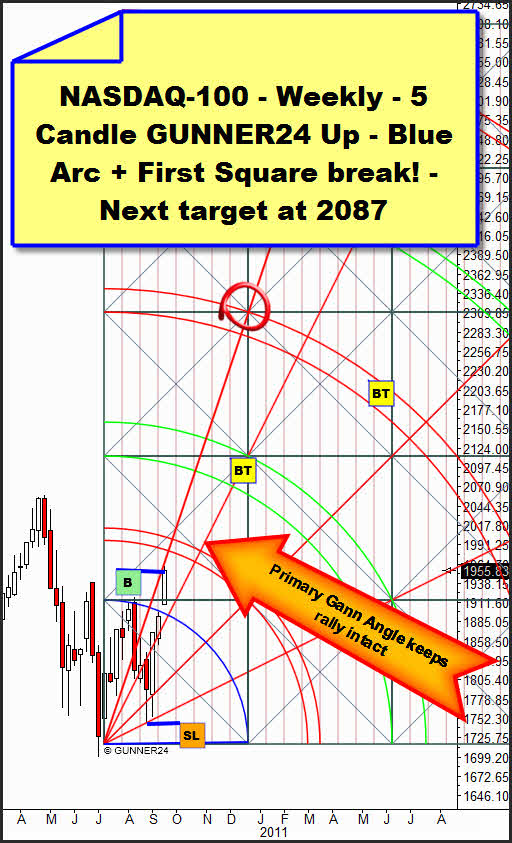
As to the NASDAQ-100, in two GUNNER24 Up Setups we can see a buy signal. Here:
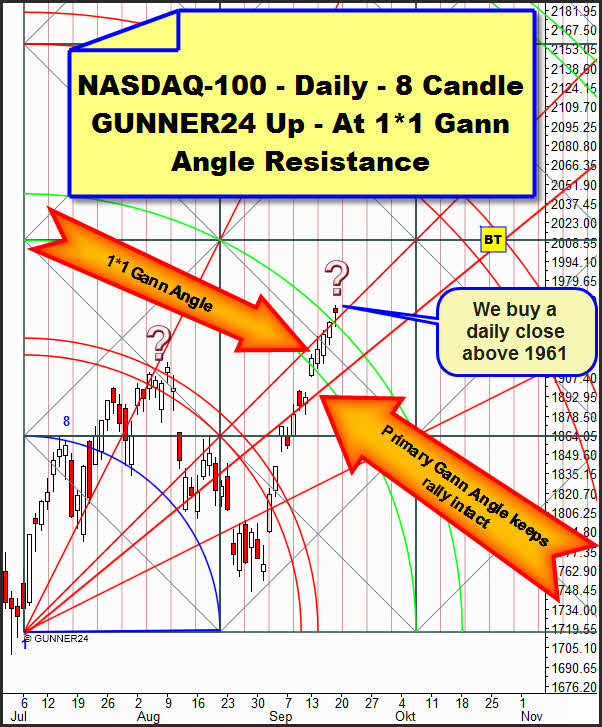
Again, the NASDAQ-100 is taking charge! First target is the first double arc at 1981 to 1990. On daily basis, too, a break of the dominating double arc took place already:
Yes, even a possible break of the 1*1 Gann Angle took place which would be a strong buy signal. This is what is bothering me: The lost motion of the 2nd double arc has not been overcome and the market might behave more or less like at the question mark left....That's why tactics for next week are: We'll buy a daily close above 1961!
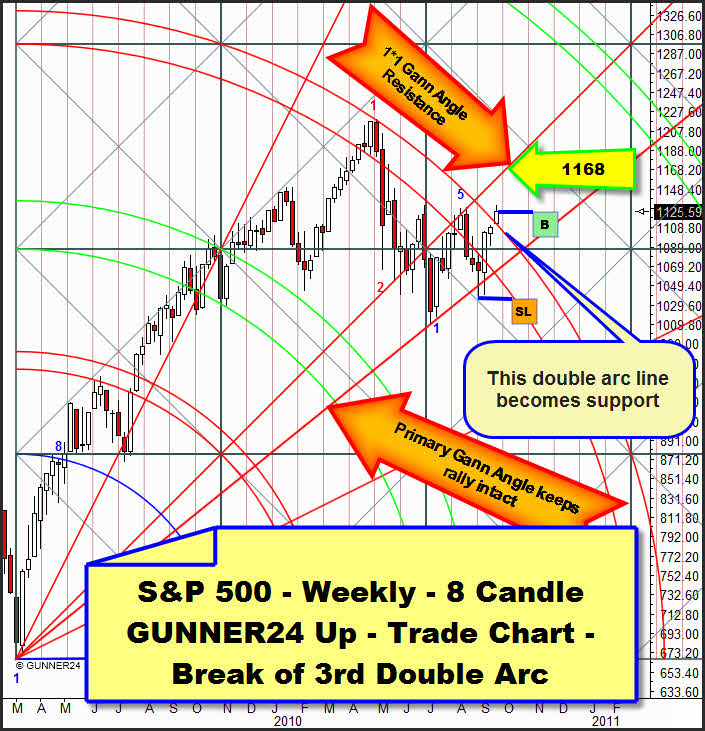
Weekly S&P 500 buy signal:
The 3rd double arc was broken. Target 1168. SL 1039. Reverse and double technique.
Be prepared!
Eduard Altmann

