
Are you feeling alike? During the last weeks, somehow the impacts come closer successively. The analogies with the financial crisis of the autumn 2007 become more and more blatant. Announcement on announcement hailed down to one then: Greece, Lehman, Euro, national bankruptcies etc. One horror story after another occurred at hourly intervals then as well as today.
Then as well, one didn’t really know what was going on, whether one was coming or going… What was going to happen with the Euro, with Greece, the banks, the financial system etc.? Back in those days, the stock markets were overrun and uptight completely. At some time, the barrel overflew, the markets cracked down, pure panic followed everywhere far into the year 2008. Billions were blasted, respectively they migrated into the hands of a few gainers.
This autumn, it’s the matter of: 4 million dead by Ebola, Vulcans, sun eruptions, WW III, Ukraine, sanctions and counter-sanctions, Europe’s gas supply, falling Pound, Yen and Euro, US$ buying panic, incapable politicians aiming for war, Kurds, IS, Gaza, Cyberwars, arms delivery, the construction of a wall, tensions between USA/Europe vs. China/Russia, economic wars, Scotland’s Yes or No vote, civil unrest, worldwide deflation fear and evidence and many other things… If the analogy with 2007 and 2008 continues, a bang will have to happen soon… I can literally smell already the coming panic move.
Nothing will retard gold and silver in that case on their way down into 950$-1000$ resp. 14$ and even lower.
With the negative performance of last week, gold and silver pointed out a lot. Big disaster is looming. Consequently, I have to raise the probability of gold to work off the 950-1000 in 2015 from 70% to far above 80% now!
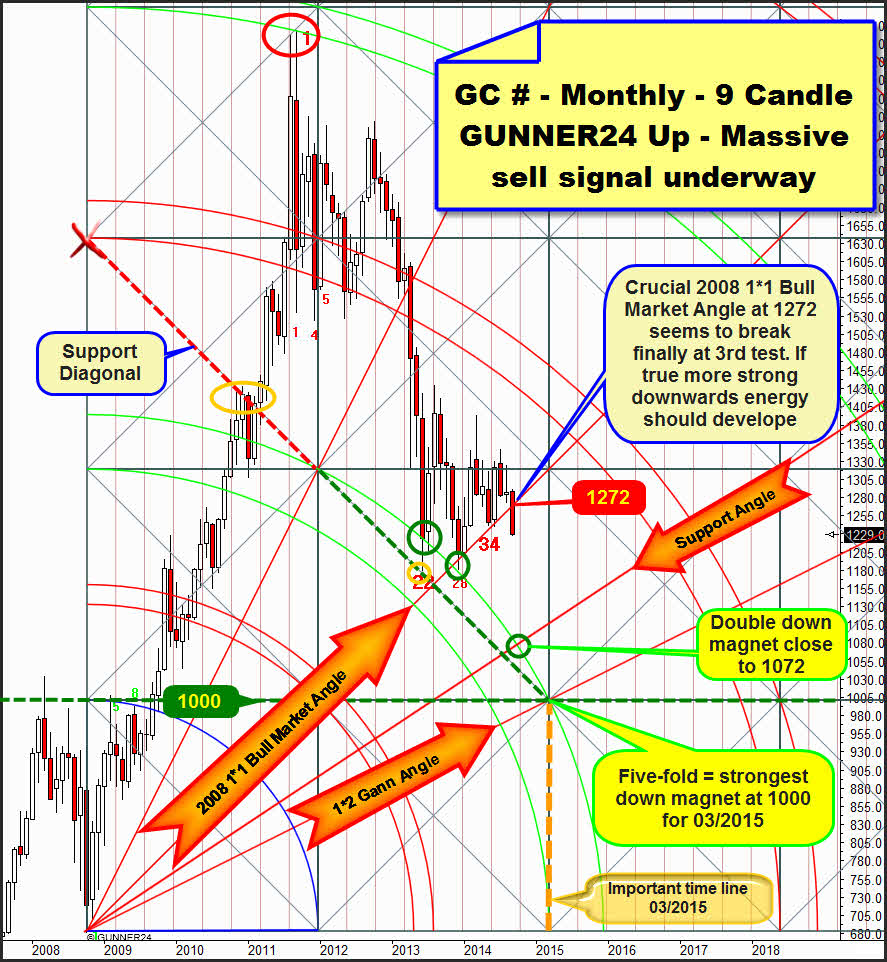
Last week I clarified how important the defense of the 1*1 Bull Market Angle – it takes course at 1269.50 for September 2014 – is on weekly closing base at the third test, that is taking place currently:
Well, for every gold bull last week was the absolute hell. Virtually from the Monday opening at just these 1269.50, each of the last 5 trading days gold fell nearly unchecked and without any resistance of the bulls effectively closing at the weekly low. Weekly low was 1228.10, and weekly close was at 1229. In any case, this augurs a test of the coming important monthly GUNNER24 Support Horizontal at 1222. More on that follows in the next monthly chart.
Before, here’s a brief analysis on the monthly 9 candle up setup above: If September gives up the 1269.50 und thereby the support of the 2008 1*1 Bull Market Angle – that in the end determines the rise in price and time of the bull market since the 2008 lows –…so, if September closes below 1250 we’d have that case, the bull of the last 6 years will officially come to its end! Thus, an important Gann Angle signal would be generated thereby, according to the body of rules, being activated the next lower important Gann Angle as downtarget = 1*2 Gann Angle.
If the 2008 1*1 Bull Market Angle happens to fall finally in September, the 1000 will threaten to be reached pretty fast. Mind on this the most dominating five-fold down magnet in the chart above. It is situated exactly at 1000$ for March 2015 being formed by the first square line support, upper line of the 2nd double arc support, the 1*2 Gann Angle, the next important time line and the confirmed support diagonal. The 1000 are monster support as well as the very strongest visible down magnet. March 2015 is only just 6 months away. Another 20% of loss in 6 months will be most likely to happen if September doesn’t defend the 1250 on closing base.
Is this going to happen? I strongly suppose so. A guarantee isn’t ever there yet, of course. Gold has almost reached the zone now where at any second, any price within the zone A) a consolidation at the current lows = pause in the trend is allowed, B) perhaps followed by a strong rebound in the trend that again tests back the 1270 before from there another strong down-wave is provoked that in the sequel finally breaks the 1180/1172. C) means of course another important – the third – higher monthly low that D) may signify the final end of the entire – as of now – 3 year – correction move. Scenario E) a triple low at 1180 marking the end of the current correction respectively F) evidently – the current double low at 1180 doesn’t hold inevitably resulting in 950-1000.
The very, very strongest gold support area takes course between 1222 and 1172. As soon as it’s reached, gold will be allowed to turn upwards at any price within this support area, at any second. Beneath, i.e. either 3 consecutive daily closings below the 1172 or a weekly close below 1172. Also of course a monthly close below 1172 will activate the 950-1000 downtarget finally:
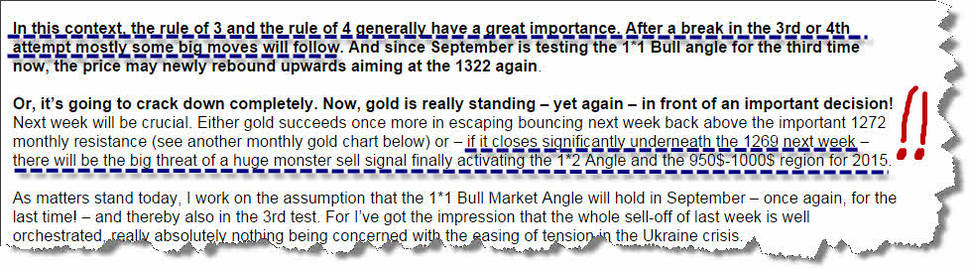
All the important horizontals below the 1522 derive directly from the first correction move out of the all-time high. We measure this first correction move – in the GUNNER24 Terms the Initial Impulse – with the Blue Arc. By this measurement, as a rule, future supports and resistances are defined. In the current case, the current gold correction, gold is sticking persnickety to the GUNNER24 Method guidelines. It reacts completely according to the story book to the supports and resistances that exist exactly at a 50$ interval. Since the September double support magnet fell at 1272, the next lower important support horizontal, the 1222 was activated as target. Thereby, the 1222 is supposed to be worked off early in the coming week.
1222 marks the beginning of the strongest support zone for gold. There is the big threat however that the 1222 doesn’t hold next week either, because a signal in the monthly 4 Candle GUNNER24 Down indeed overlays and dominates everything:
According to the body of rules, since the first double arc was broken downwards finally, the current sell signal is indicating with more than a 75% of probability that the market will have to reach the next lower double arc. In this case, the upper line of the 2nd double arc was activated after the final break of the first square = break of the 1522.
So far, the upper line of the 2nd has not been touched during the 3 year correction thereby not having been worked off. As chance would have it, the upper line of the 2nd takes course at exactly 1180 for September! And for October at 1182!.
I mean, at the moment the magnetic force of the upper line of the 2nd is proven to be drawing the market down seeming likely to be compellingly necessary a new test of both correction lows and the 1180-1172 support region now.
Will the upper line of the 2nd and the 1180 hold again, leading to a rebound upwards respectively to another important low, the possible monthly triple low? I don’t know, I really don’t ==> In a panic down move where gold is perhaps situated – the current break of the 2008 1*1 Bull Angle is signaling that enormously strong downforce presently want respectively have to form! Everything can break therefore. Even the strongest monthly supports may fall like thin twigs. In turn, every break of an important monthly support increases the power of the down force of the movement…
This is a little interim conclusion in respect of the monthly support that is now in reach: At 1222 is now the next lower important monthly horizontal support. If it is broken (two consecutive daily closings below 1220), the 4 candle down signals the 1180 as next target in that case = upper line of the 2nd double arc.
In between there are some more important monthly supports however, the very most important supports of the bull market ==> They are much more decisive for the signaling and the forecast than all the other so far presented magnets and targets of both rather "medium-term" points of view of the developments after the final low of the year 2008 (9 candle up) analyzed above, respectively after the ATH 2011 (4 candle down).
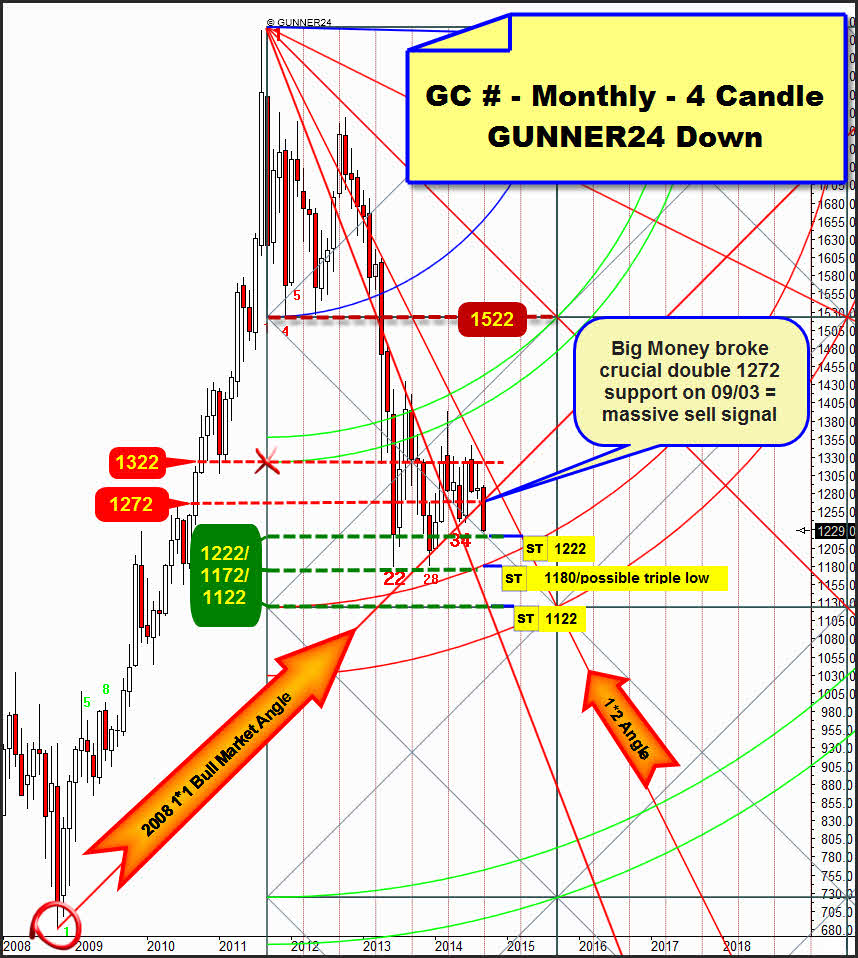
The mentioned most important supports can be derived from the important low of May 2005. With the May 2005 low the currently dominating gold up-cycle began whose 13 candle initial impulse has still the strongest influence to the price development and signaling of the last 3 years:
The 13 candle impulse reached its main target in August and September 2011. The 5th double arc is often the trigger of a larger correction. Really classical is that the all-time high occurs exactly on an important time line. We know that important highs or lows are marked very frequently at important time lines. Often followed by significant turns. For the last 3 years, the resistance of the 5th double arc has been dominating the current correction. Once gold reached the resistance of the 5th gold declined later... The 5th double arc resistance is the strongest resistance for gold. Since its resistance function won’t expire before January/February 2016, perhaps gold will be able/respectively will have to join it downwards until the resistance influence of the 5th double arc will be temporally elapsed.
Merely according to the GUNNER24 Trading Rules, we ascertain that gold shows a close above the upper line of the 5th. Together with all those closings within the lines of the 5th, that leads us to the recognition that at some point the 5th double arc is supposed to be broken upwards significantly. Hence, now and for 3 years, actually we have just been able to experience respectively follow an – admittedly very long – correction in the uptrend. Technically, gold must rise higher long term – even much higher as current alltime-highs!
The last 3 candles, July through September, have newly reached the resistance of the 5th, gold following visibly the resistance of the 5th double arc downwards again.
Thus, gold is approaching again its very strongest and for the current bull most important long-term support, the 2005 1*2 Support Angle. Since May 2005 gold was never allowed to close below that on monthly base! The angle is strong monthly closing base support and next wall of support for the current bull.
A first test of the 2005 1*2 Support Angle took place very early in the year 2005. The second test of the 2005 1*2 Support Angle ensued at the lows of the year 2008… that is where the monthly 9 Candle up started, analyzed at the top.
Contemplating the 2008 low surroundings we realize that in future gold will be allowed to quote very narrowly below the 2005 1*2 Support Angle without breaking that angle finally. So, if gold intends now to test the 2005 1*2 Support Angle – we thoroughly have to work on that assumption – gold may fall exactly onto the 2005 1*2 Support Angle = 1213 for September, but it may quote a little bit beneath – going till 1200 within the scope of the lost motion without endangering the uptrend since 2005. Lower than 1200 now in September and October will be critical. Indeed, even all hell might break loose if the 2005 1*2 Support Angle does not withstand respectively does not lead to a visible bounce.
Interesting is also the fact that also this setup puts out the 1222 as important horizontal support. That is why at 1222 the most important support zone for gold begins! Two different monthly setups put out the same horizontal support!
Below the 1222, the 2005 1*2 Gann Angle comes into play in September = 1213. Since 2005 this one has never been fallen below on monthly closing base. But it is allowed to fall below down to its do far unidentifiable lost motion = 1200. Even down to 1180 it might be penetrated next without loosing its long term support function! There is an important medium-term support there, cemented by the double low and the upper line of the 2nd in the 4 candle down.
Conclusion: For September and October, the following supports and magnets are allowed respectively possible to be headed for: 1222/1213/1200/1180/1172 without endangering the long-term uptrend. At or near one of these supports, at any time the current correction running for three years may be finished finally, respectively a recuperation phase may be rung in because gold wants to rebound from there significantly in order to defend thereby at least the 1180 region till the end of 2014.
==> The big question I really don’t know to answer is: Are all these supports at 1222/1213/1200/1180/1172 going to hold for the next 6 weeks or not?? The persistent and all overruling 5th double arc resistance in the 13 candle up together with the final break of the 1272 are exerting enormous pressure to the gold price now. Perhaps the panic cycle at the monthly supports will already make the thin twigs break.
==> If the market wants to keep being subject to the downwards influence of this ominous 5th double arc until the year 2016, the 1172 will be possible to fall as early as within the next 6 weeks. I.e. either 3 daily consecutive closings below the 1172 or one weekly close below 1172 or one monthly close below 1172 will activate the 950-1000 finally as well.
==> Since the most recent sell signals may prevail at the moment, the supports in the very long term springing from the years 2005 and 2008 may finally fall and break at the next test. At every test they are being softened more and more, after all. At the moment, I expect the final break of the 1222-1172 support region to happen within the next 6 weeks, with a probability of more than an 80%. An approach run to the 950-1000 downtarget would be the inevitable result!
Be prepared!
Eduard Altmann