I’m pretty positive that the FED won’t rise the rates on Thursday. Even if it does, the equity markets should bear that very well! The US stock markets are supposed to fly through the end of September/beginning of October 2015! Till then, the stock markets might nearly attain the current year highs. Perhaps, the current year highs will be downright pulverized until then.
The bullish prospects/signs of the NASDAQ-100 – at least at short sight – are just too unequivocal!
The weekly time frame is to the fore in today’s NASDAQ-100 outlook. It seems to be dominating the present and short-term developments. Let’s start with the market performance since the October low of the YEAR 2013:
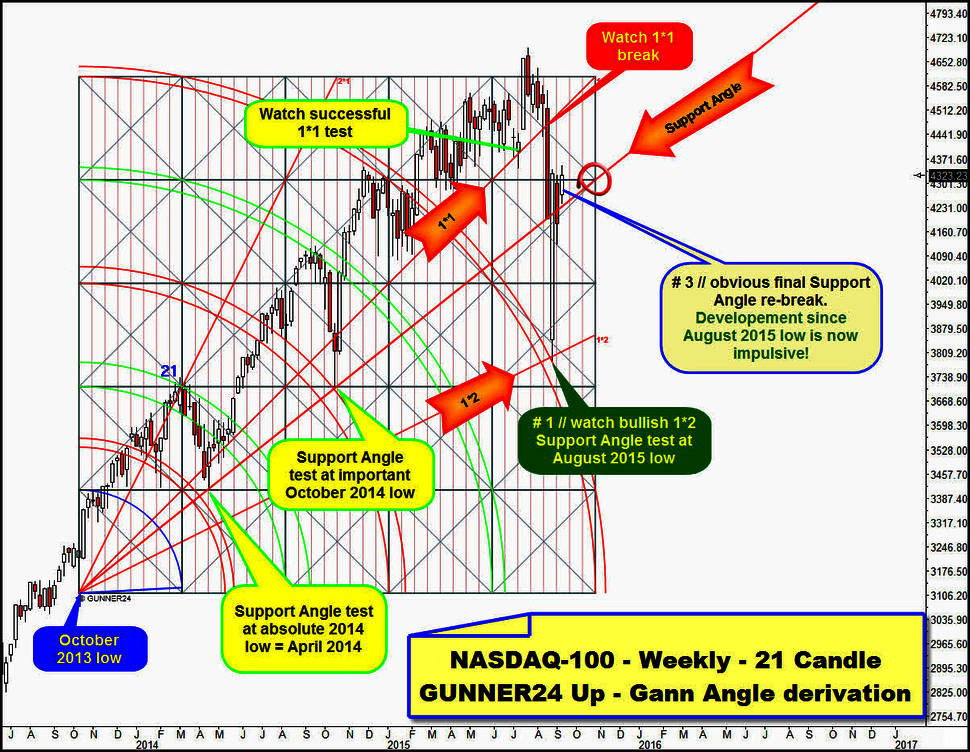
We apply an up setup at the October low 2013, yet pulling it up just high enough to be capable of evaluating the anchorage point of an extremely determining and dominating Support Angle. This Support Angle is the important signaler and important bull market support in the weekly time frame.
The Support Angle can be anchored above at the right margin of the up setup. We realize that this angle has been influenced the bull market for almost two years.
A) It springs from the important October 2013 low. B) it was tested exactly at the absolute low of the year 2014 = April 2014 and C) at the important October 2014 low. D) The Support Angle was broken downwards during the August 2015 sell-off and E) an extremely bullish signal: It was finally re-conquered with the close of last week.
==> This is an important GUNNER24 Buy Signal in the weekly time frame!
The August 2015 low was a spike low from which a strong upwards bounce emerged. That’s why the candle that formed the August 2015 low is the very first candle of a new movement = # 1.
Till the end of last week it wasn’t obvious to me what the upwards move since the August 2015 low was all about. Was it corrective = dead cat bounce respectively consolidation in the current bull market? As now the Support Angle was re-conquered for the second time within the most recent upmove being able to reach a small higher high last week (= # 3) that was higher than the one in week # 1, moreover # 3 closing in the positive realm, the move since the low of # 1 is now to be classified as clearly impulsive.
==> Thus, at the August 2015 low, a new, several month upleg in the bull run seems to have begun. The probability for that is at more than a 90%!
Let’s pull now the up setup above to the high of the 20th candle after the October 2013 low = applying the 21 Candle up appropriately:
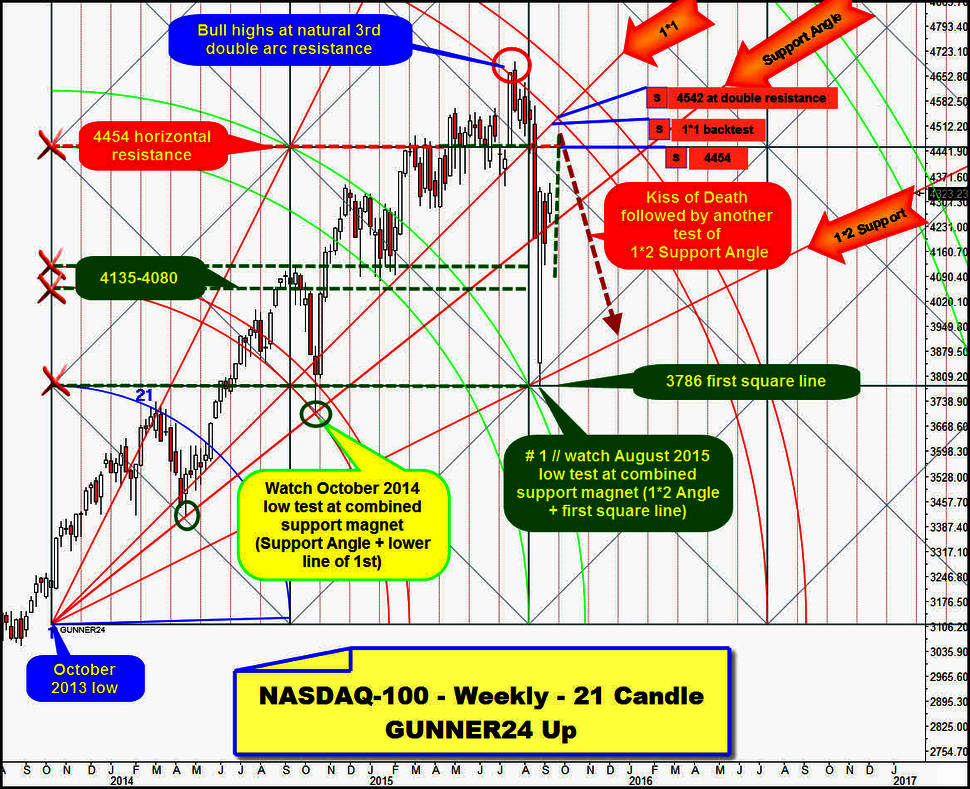
Let’s first consider again both important lows of October 2014 and August 2015 in a more intensive way. Both were not only supported by the mentioned Gann Angles, but in addition some further important GUNNER24 Supports were effective at these lows. At the October 2014 low, besides the market pinpoint met the lower line of the 1st double arc support, and at the August 2015 low, the first square line support was worked off most exactly, at 3786 = tested back, indeed successfully!
==> Both lows were formed because the market reached a weekly double support magnet having to bounce up heftily afterwards (October 2014), respectively this is what it is doing right now (August 2015 low).
==> From the October 2014 low, an 8 week initial up impulse evolved finally ringing in the market’s heading for the lower line of the 3rd double arc resistance.
The resistance of the lower line of the 3rd means the preliminary end of the current several year bull run. That’s where the current 2015 year high was achieved, from there the market sold toughly into the support of the 1*2 Angle and the 3786 first square line after the 1*1 Gann Angle had broken down finally.
From there – low of #1 – as postulated already, a new initial upwards impulse seems to emerge. This one is in week # 4 with the next week candle.
I suppose/think that this new up impulse is going to reach nearterm some very important resistances, so it can/has to be finished only there before the market may respectively should sally forth into 1*2 Support Angle to form there the first higher important weekly low of a new several month upwards leg.
Till the end of September/beginning of October 2015 I expect a Kiss of Death either of the 1*1 Gann Angle to happen in the course of the week after next (week # 5 of the current initial up impulse).
More likely however is a rather clean backtest of the lower line of the 3rd double arc at 4542 till the beginning of October = week # 6 of the current initial up impulse. The lower line of the 3rd – the 2015 high was brought in there after all – is now the very strongest resistance for the rest of 2015 till July/August 2016. Not before that, it will officially lose its resistance influence.
A first close within the lines of the 3rd double arc will be the next strong proof for the final and absolute low of the year 2015 to have been reached in August 2015.
Short-term outlook/short-term swings/timing:
Until the decision on the rates on Thursday of the coming week, technically the market can only reach the 4454-GUNNER24 Horizontal Resistance at most. If this strong horizontal resistance is really reached before the FOMC announcement (Thursday 2pm) it will represent the most optimum short-entry for the down move to be expected THEN, after the rates decision:
==> Trade setups:
A) If 4454 are reached till Thursday 2pm, the market will be supposed to retrace from that point to Friday 18, more probably to Monday 21 through the realm of 4135-4080. Between 4135 and 4080 it should really recover itself starting to turn upwards from there to work off the 4542 main resistance then, within 8 to 13 trading days, i.e. till early October,.
B) If the market remains on its current level until the FOMC on Thursday respectively if it rises just slightly till then, the market will be supposed to decline likewise to the 4135-4080 support area to start rising from there till at the latest Monday, September 21 up to 4542 till early October.
C) However, if the market decreases rather strongly on Monday until the FOMC announcement even violating the 4000 in the course of coming week respectively during the FOMC Thursday – please clutch with both hands on Thursday evening already, after the FOMC announcement. It can only go up in that case!!!
The 4542-early October uptarget ==> At this price, there is the currently strongest upwards magnet and at the same time the strongest resistance magnet in the weekly time frame.
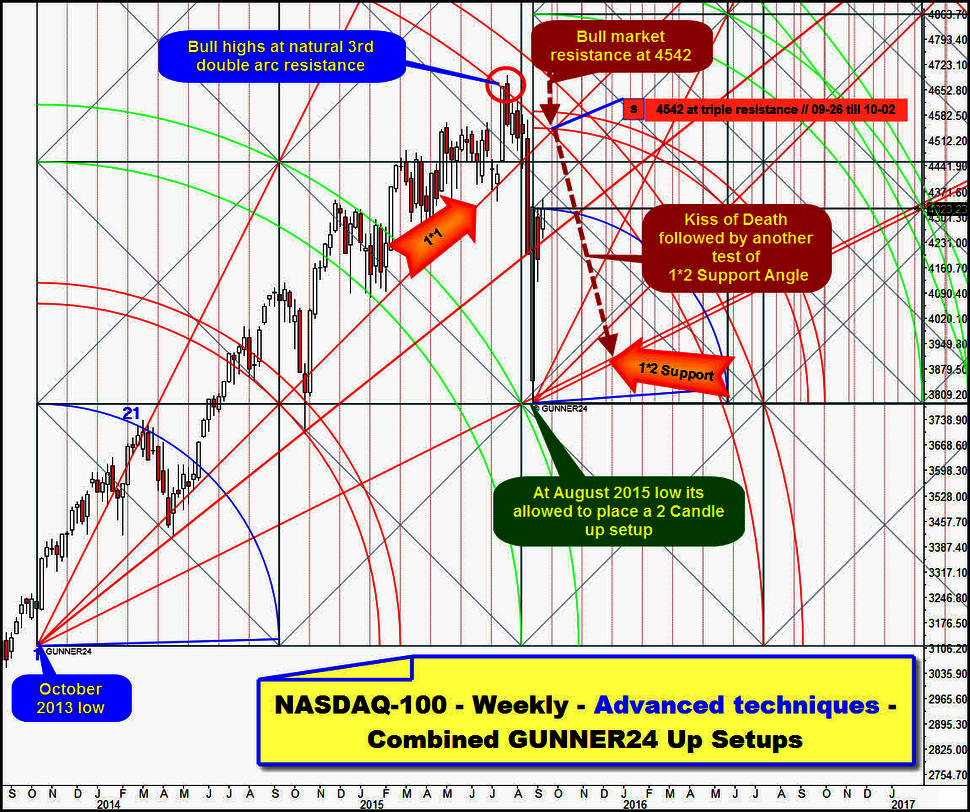
At first a short glance again upwards into the last chart: the 1*1 Angle starting from the absolute low of the year 2013 intersects the lower line of the 3rd double arc resistance at 4542 in the week from September 24 to October 02 forming thereby a double resistance magnet, I mean a strong attraction point for the market.
Applying now in addition another GUNNER24 Up Setup, a 2 Candle up, at the August 2015 low, the following picture arises:
It’s allowed to pull the Blue Arc up to the high of the week # 2, since that’s where a first correction move in the current up impulse began, thereby it represents an important high in the Initial up impulse.
The last candle = # 3 closed pinpoint at the resistance of the first square line. As depicted in detail above, it should go up much higher yet. Thus, the first square line resistance of the 2 Candle up should finally be broken and as a result, the lower line of the 1st double arc of the 2 Candle up becomes the next important uptarget for the market.
For the week of September 28 to October 02, this lower line of the 1st double arc takes its course closely above the 4542, at about 4546 index points. Therefore, there is not only double resistance at 4542, but it is even matter of a, triple resistance magnet in the weekly time frame, rather seldom to be identified!! Thus, it’s also a strong attraction point for the NASDAQ-100, where technically the first important lower high, starting from the year high 2015, should be marked in the weekly time frame.
Likely is there a Kiss of Death that is allowed and perhaps able to lead to the next test of the 1*2 Support Angle till the end of October 2015/beginning of November 2015.
====
Well, every bear should be clear in his mind on what it means and signifies if really the final low of the year 2015 was brought in with the August low. Technically, this likely 2015 final low means that compellingly some new bull highs are to be expected for the next months. This is the important conclusion No. 1! ... Consequently it’s possible that the year 2015 even wants to close with new bull market highs… !!!
Important conclusion No. 2 from the possible final August correction low is that the important resistances are there in order to be taken!! So, a delayed rate hike might lead to a true pulverization of the 3rd double arc resistance in the 21 Candle up setup, in the course of the current initial up impulse!!!
Certainly, the 4542 is a rather simply identifiable triple GUNNER24 Resistance Magnet. However, this doesn’t mean at all, that in a first up impulse that starts from a presumed important year low this resistance will hold forcing the market into the first serious test of the August 2015 lows that is chart-technically usual and actually normal! So take care, dear bears, when the 4542 are being reached! You better monitor first the performance of the leader at this resistance before you act out.
==> A first clear weekly close above the 4542 triple resistance magnet till the end of October 2015 (4570 and higher) will activate 5200 pts. until the year-end 2015!!
|
„As far as I know", the GUNNER24 Forecasting Method is the globally unique and only technical analysis tool that deals intensely with the comportment of the market at support and resistance marks being able to combine that with price predictions. You’ll learn everything on these really "secret" facts in the Complete GUNNER24 Forecasting and Trading Course. Order now!
Be prepared!
Eduard Altmann


