
There are no important corrections in the actual gold and silver run. The monstrous up wave continues running at full power. Nearly day after day we see new highs, the resistances are being broken like crumbly bricks, and the shorties are flitting round the corner like rabbits. It’s a bull’s festival!
Nice to watch, but at the same time a serious warning signal!
You’ll certainly ask why. Isn’t it fascinating to see gold and silver perform as Clint Eastwood used to in the unforgotten 1992 noble western, after long months full of privation first saddling the horses leisurely, then slowly riding into town, observing and eliciting in order to put the smoke stick into the mouth subsequently rising like a phoenix and mercilessly bowling down all the opponents and villains?
It’s nice to watch, but considering all the features and characteristics of a genuine uptrend, generally it doesn’t go like in the Hollywood showdown described above. An uptrend in the classic meaning is rather like a several month battle. Two steps ahead and one backward, fight for supports and resistances. One step ahead, two back, three ahead. Front lines have to be maintained, trenches to be dug and defended. A basis is being formed, then defended and it takes certain time until a storm attack can follow… it’s a tough permanent fight between the bulls and the bears.
A classical uptrend is marked by stair steps. It’s going up by small steps, grueling for the bears.
In contrast to that the precious metal rally of the last 18 days is newly showing the features of a classical bear-market rally. It’s characterized by just these quick and often brutal up-moves where scarcely considerable corrections happen and the resistances are overcome without much fighting. At the end of a countertrend rally the hero uses to be lying on the ground exhausted and powerless and always with a hole in his chest because one more time he has only achieved a lower high.
The actual gold rally of the last 18 days has performed so far as the three important counter-trend bear-market rallies since the all-time high of August 23, 2011 did! It doesn’t show any considerable correction.
Here are the important exhaustion countertrend rallies since the 08/23/2011 all-time highs (1934.60/GCZ2 contract):
08/25/2011-09/06/2011: 8 Days. Low 1718.3 – High 1934.00. 216$ rally. Average rise/day 27$. No daily Fibonacci Retracement.
10/20/2011-11/08/2011: 14 Days. Low 1616.4 – High 1815.00. 199$ rally. Average rise/day 14$. One retracement during whole rally. 3 days of retracement within the 14 day rally, retracement level near 48%.
12/29/2011-02/29/2012: 42 Days. Low 1536 – High 1800.90. 265$ rally. Average rise/day 6.30$. One retracement during the whole rally. 10 days of retracement within the 42 day rally, retracement level near 24%.
Current 08/15/2012-09/07/2012: 18 Days. Low 1592.10 – High 1745.40. 153$ rally. Average rise/day 8.15$. One retracement during whole rally. 5 days of retracement within the 18 day rally, retracement level at 38.2%.
I don’t want to make it rain to no bull’s parade, but we bulls mustn’t be too euphoric. The actual rally is really and truly feeling like a monster up-wave that might easily lead gold to speedy new all-time highs, but it is also showing signs of a countertrend rally. In addition – another warning signal – the commercials don’t have any intention to change ends, at the contrary also last week they increased their short-positions massively in the COMEX. That is also pointing to the chance that the evil sheriff will have gathered his troops soon so he might strike back unexpectedly.
Target for this gold swing was and keeps being the 1*2 Gann Angle in the actually most important GUNNER24 Setup. Weekly time frame, 8 candle down. There are detailed analyses here and here:
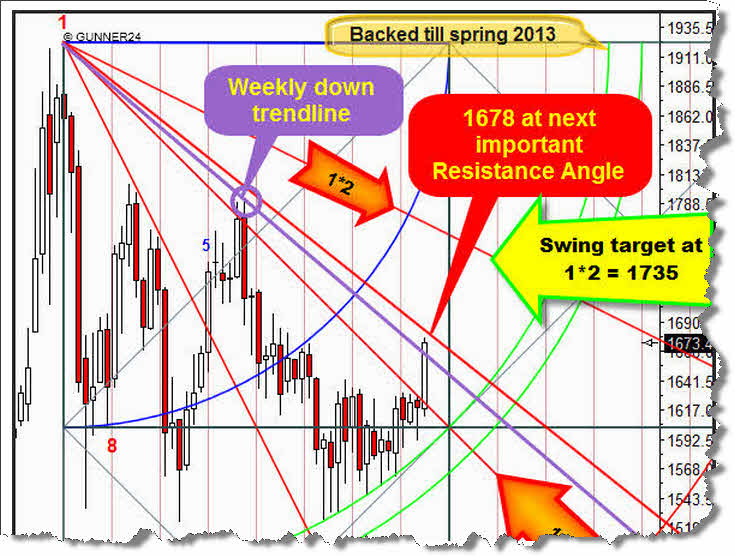
This setup – above you see the chart detail of 08/26 – is showing us that gold is generally supposed to go up until spring 2013. On 08/26 I expected that gold should meet the 1*2 Gann Angle at 1735 by the end of September. The 1*2 is the next higher important Gann Angle having to be headed for after the significant break of the 1*1 angle. It’s simple Gann arithmetic… Two weeks ago I still worked on the assumption of an orderly and civilized rise until the target. But the break of the 1*1 angle accelerated the trend power. The 1*2 is now supposed to be reached earlier.
And that’s what is now increasing the threat of a brutal, an extremely brutal change in trend:
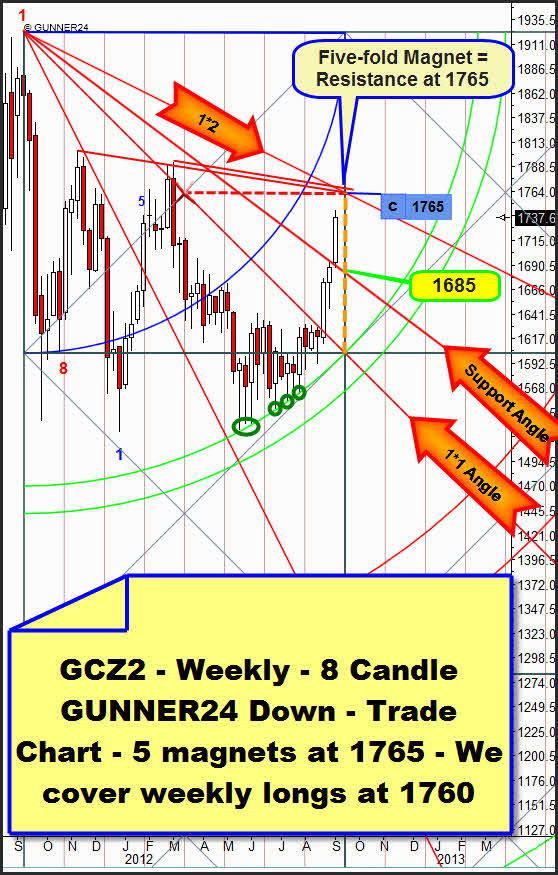
Gold seems to be willing to reach the 1765 unconditionally now. In the weekly setup the next weekly candle is already narrowly lying on an important time line. It’s the transition from one square to another (orange, dotted line). On the important time lines some wild swings use to happen, as well important highs as important lows are produced. At the important time lines resistances and supports are annulled, there is extreme volatility. So maybe next week at first the 1765 want to be headed for or even be overshot extremely, but in the course of the week it’s taken down again trying gold in the further course to reach the actual support angle at 1685. Everything is possible on time lines, even the contrary that at first the 1685 are targeted trying afterwards to be reached the 1765, but this is just a theoretical chance…
As many as 5 Gann magnets are going to meet next week in one price. On the one hand it’s the important time line, the 1*2 Gann Angle and there are still two important Gann Angles coming from important highs. And we have to mention the important horizontal that comes from the center of the just passed square.
For the time being we’ll have to work on the assumption that these 5 magnets should provide considerable resistance having to lead to a change in trend normally. That means gold wouldn’t succeed in closing above 1766 within the next one or two weeks. But if gold does I’ll be able to analyze new all-time highs, far above the 2000, for the entire rally until spring 2013.
If a change in trend happens at 1765 there’d be the big threat that the correction following in that case will not be finished at the first double arc. This one is technically supposed to be fallen short in the course of a correction newly being there the threat of +1500! The reason is this: 5 Gann magnets bundled in one price normally produce so much rebound energy that even very strong supports may break like thin twigs.
But if the 1765 are taken the 5 magnets will be supposed to go on accelerating the uptrend. Instead of the downwards energy there’ll be another upwards energy phase. The 2000 would certainly be unavoidable.
We’ll cover our weekly long-position at 1760$ MIT. It’s useless to thrash out the up target maximally or to hope for a fast lasting break of the 1765. The probably very strong resistances at 1765 and the risk that gold maybe just produces a countertrend bear-market rally would be too high.
Every weekly close above 1775 next week or the week after next will lead to the re-entry since in that case the uptrend is supposed to go on accelerating.
We know the same magnet in different time frames has got a special signification. Not only in the weekly but also in the monthly time frame gold has to fight with the 1765. Another reason to expect a strong change at 1765 is this:
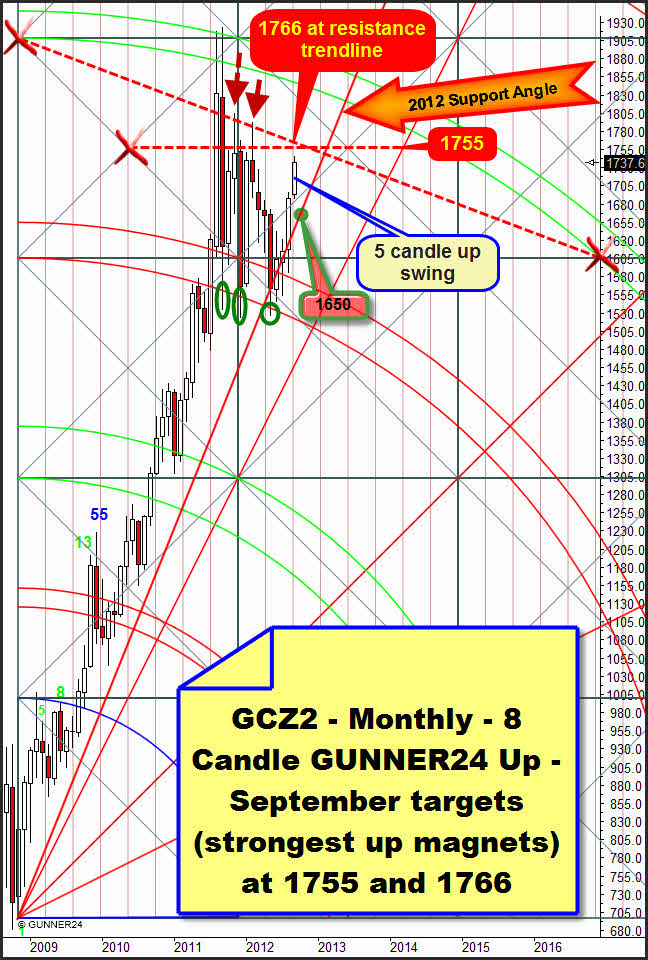
Every trader wouldn’t be in his right mind who doesn’t expect a new counter reaction at the monthly resistance diagonal. This one was already responsible for the end of two countertrend bear-market rallies. Red arrows! At 1755, the horizontal resistance the first strong monthly September magnet is lying. That’s where we’ll cover a monthly long-position. MIT.
Not before a monthly close above 1775 gold will be ready to target again the 4th double arc. I really expect that for this run as well, but the critical point right now is the "short-term" performance between 1755 and 1766. September may thoroughly take in one go as well the 1755 as the 1766. But caution is the mother of wisdom. September is the fifth month of the current impulse. 5 is a Fibonacci figure being predestinated for a significant high with a subsequent retracement.
We’ll go long again with a monthly position if September closes above 1775.
A correction at 1766 would facilitate at least 1650 for October, down to the important 2012 support Gann Angle. Dips below the 2012 Support Gann Angle are allowed and to be expected, as the May-August candles reveal.
|

The GUNNER24 Gold Trader will provide you with the critical knowledge you need to forecast and analyse the precious metals with the GUNNER24 Forecasting Method. All the GUNNER24 Trading Signals you receive real-time are based on the actual Gold and Silver Future. The NEW GUNNER24 Gold Trader is a must for every actively working investor and trader who wants to trade successfully in everyday trading. The insights you receive from the head trader Eduard Altmann (and discoverer of the GUNNER24 Forecasting Method) are truly amazing sometimes. I promise!
Click the button below and order the GUNNER24 Gold Trader - $39.90 US a month. For 201 members and up - $49.90 US a month.
 |
Be prepared!
Eduard Altmann