
Are the lows reached now for the correction or aren’t they, are the lows approaching another test or going even deeper? Are the stock markets situated now in a crash-, bear-, correction-mode or still in their bull mode? During the last days, things came thick and fast. The opinions on the situation by thoroughly esteemed analyst colleagues, mostly of the Elliott Wave front, are arriving in dribs and drabs over the tickers. It’s only natural that those concepts about the current and expected wave structures generally seem confused and doubtful.
With my today’s contribution, I’m trying to unravel the situation in the Gann sight which is not at all easy either. Yet I think I should make available to you the third side of the coin – a completely different angle than the Elliott Wave and the chart-pattern analysts/professionals whose site is mostly in the US respectively who actually always orient themselves by the US stock markets.
During the past decades I formed the habit ever to consider the respective leading stock indexes east and west of the pond together when things become complicated and hectic. On the one hand it’s matter of the NASDAQ-100 whose performance – as to my observations– the other important US stock markets are often/mostly oriented by… it is so since the mid-90s in the course of the dotcom bubble. On the other hand, the DAX is undoubtedly one of if not THE EU stock markets leading index.
The interesting aspect is that the NASDAQ-100 and the DAX have also been mutually dependent for decades. One of them orients itself by the other. Sometimes the DAX joins the NASDAQ-100 concerning signaling, sometimes vice versa. Both correlate closely. Mostly, they do better than for instance the NASDAQ-100 with the Dow Jones.
I’m asking you now first a very crucial question that should encourage your opinion-forming:
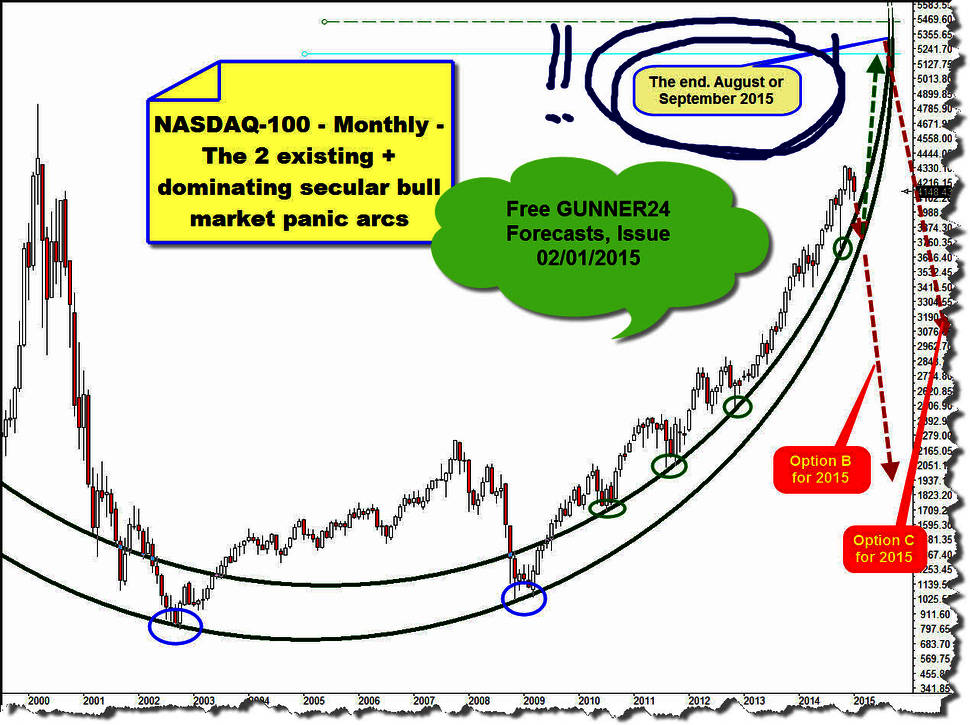
(see above, at the beginning of the year I expected - free forecasts of 02/01/2015 – most likely to happen the end of the NASDAQ-100 bull run in August/September 2015, a new all-time high respectively by all means a genuine serious test of the all-time high…)
??? How is it that the S&P 500 as well as the Dow Jones, the Dow Transport, Russell 2000, NASDAQ Composite + DAX and many other EU stock indexes including China reached higher highs than in 2000 in the course of this bull market whereas the leader NASDAQ-100 did not achieve them ???
==> Either it is an indication for the NASDAQ-100 to have lost something of its importance mutating from leader to sissy, or it is the answer to my question:
==> This bull market is not finished yet, simply because the NASDAQ-100 isn’t finished!
The consequence of this answer is unambiguous: ==> If the NASDAQ-100 has to go up again to test seriously for the first time and probably exceed its 2000 high (as all the other mentioned stock indexes have to…), each of the latter, too, will have to go up once more to still higher bull market highs!
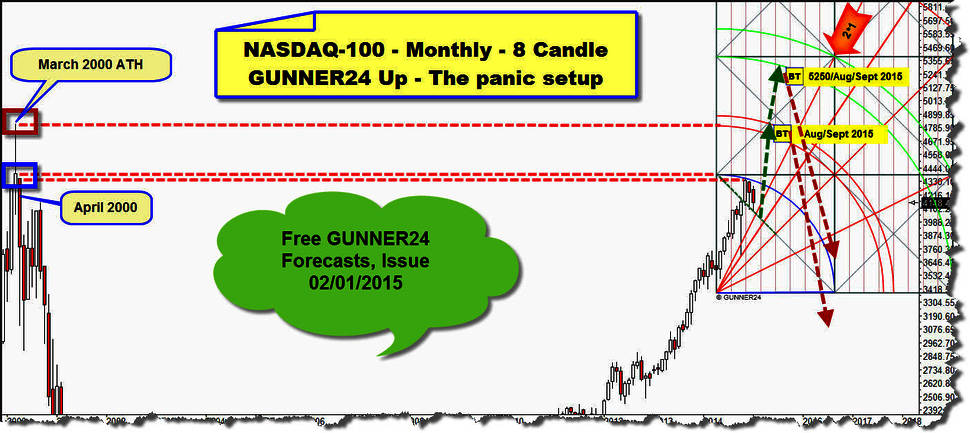
(see above: at the beginning of the year I expected – free forecasts of 02/01/2015 – most likely to happen the end of the NASDAQ-100 bull run in August/September 2015. The important top of the bull run that was to release the deep correction was classed either among A) at the upper line of the 1st double arc = about 4820 (all-time high is at 4816 pts) - or among B) at the lower line of the 2nd double arc in the 8 candle panic setup at 5250…)
Ergo: ==> Everything that is happening now is just only a correction in the bull market. No matter how deep it may go – another bull market leg is coming that will bring higher bull market highs.
==> Ergo, if this correction draws to an end respectively with the first serious indications of the end to have come, an incredibly profitable buying opportunity will appear!
Ultimately, the leader topped and turned at 4694.13 at the July high (20th). The lower line of the 1st double arc in the 8 candle panic setup was finally the decretory resistance:
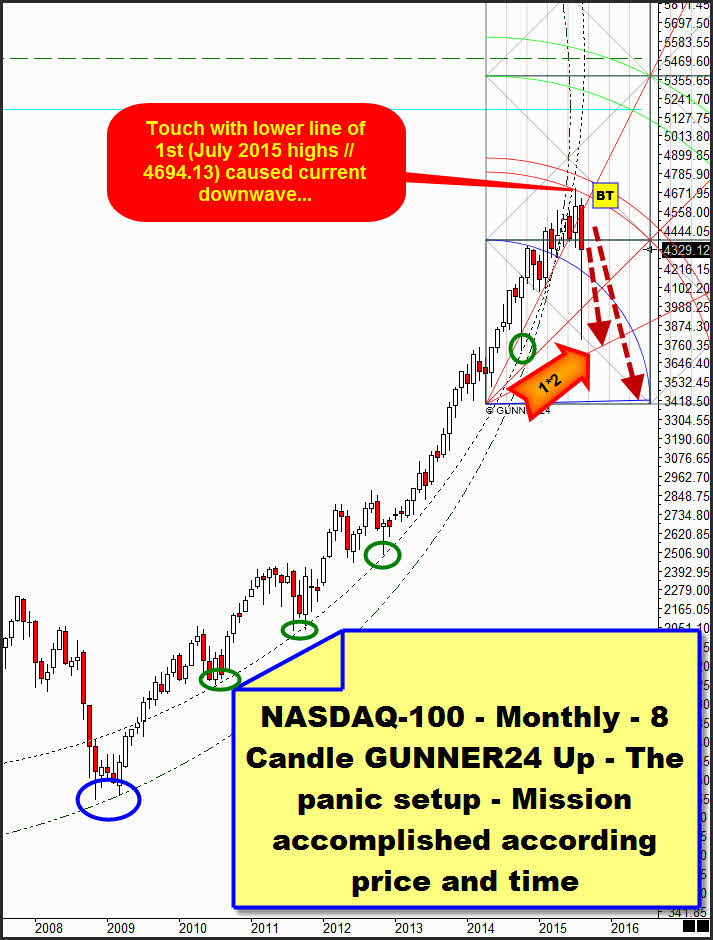
It was at the July 2015 high where the current correction started = July is correction month # 1. Thus, with the present month of August, the correction is in its SECOND MONTH. September will be the third month.
Corrections in such strong bull markets may last either 1 or 2 or 3 respectively up to 5 months!
Normally, the final low occurs in the 3rd, 4th, or 5th month of the correction.
So, the final low of the correction is to be expected for August, September, October or November. Hence, there is a good chance for the correction of having come to an end already with the current 4015.91 August low!!! …being newly underway a rare V-reversal respectively a V-bottom. The last V-bottom we experienced was in October 2014. It came unexpectedly.
What speaks for a V-bottom development is on the one hand that the fear-index, the VIX, reached a 40-year high last week, I mean the fear was brutal, so is the bearish sentiment in the USA in the extreme realm. What additionally speaks for the V-bottom is the performance of the DAX that seems to be through with its correction! More about this item in a bit below…
Before that, I’m showing you two important up setups in the monthly time frame of the NASDAQ-100, in order to evaluate possible correction lows in terms of price and time, but also for presenting a beautiful short-entry – since we have also to take into consideration a small lower low respectively even a panic low for September or October 2015. All these options are just on the table now. I don’t see different means of interpretation! Sometimes, the markets are just difficult to predict…
Both setups start at the final bear-low of the year 2002.
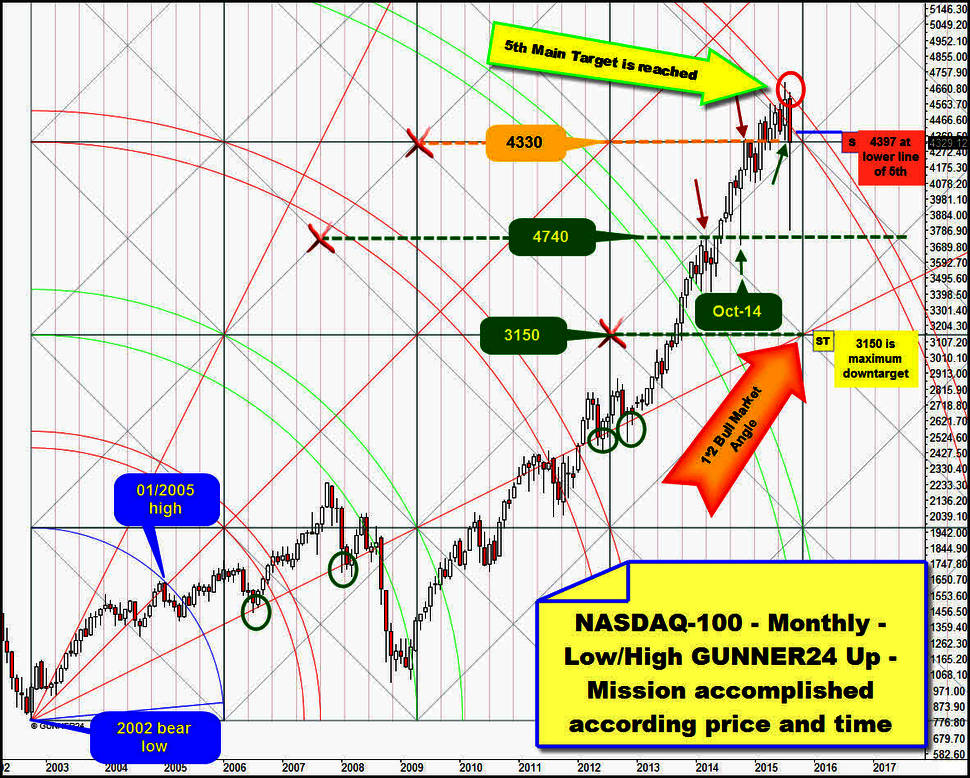
This one ranges from the bear low 2002 to a very important high – January high – of the year 2005. It shows that the July 2015 as well as the August 2015 high exceeded concisely the upper line of the 5th double arc resistances. The correction started at upper line of 5th resistance, spiking nearly down to the 4750-GUNNER24 Horizontal Support at current correction lows.
This setup shows a monthly close – July 2015 – within the lines of the 5th double arc. Such a comportment is pro-bullish since a close within the lines of a double arc uses to prepare the final break of the resp. double arc in trend direction
==> Correspondingly, this setup also states that market should go higher and bull market has to continue.
Just compare now the October 2014 spike candle and all the other monthly candles above with the current August 2015 spike candle. August is showing the very longest lower wick of all the candles present in the chart. The October 2014 has got the second longest wick of all the candles.
==> Ergo: A next V-bottom is truly not to be ruled out!
Yet with lethal certainty August will close in the reds. And it’s most likely to produce a monthly reversal candle. This suggests that most probably the lows of August will be tested once more most seriously and thereby fallen below! That’s why a backtest at the lower line of the 5th double arc resistance at 4397 for September 2015 will be a very good short-entry for the allowed and likely backtest of currrent correction lows.
==> Maximum downtarget of the correction – in case it really extends more – is the 1*2 Bull-Market Angle that supports the whole bull market = 3150 till November 2015!
The next GUNNER24 Monthly Up Setup signals that the low of this correction is either made already or due for September 2015, at the very latest for October 2015:
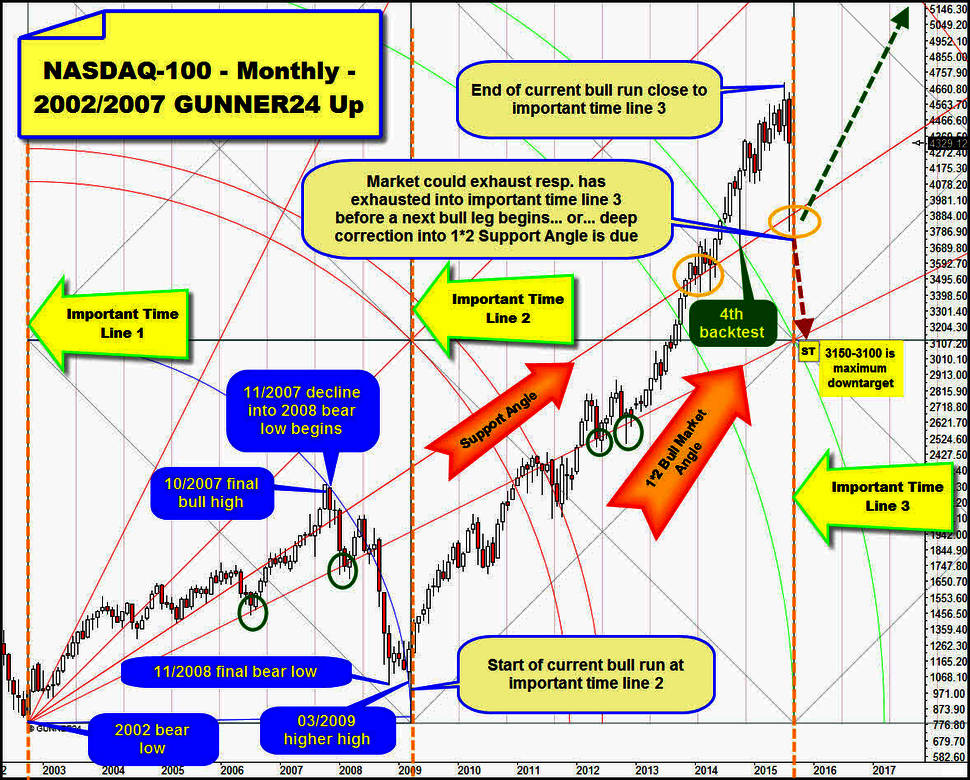
This setup is extremely interesting respecting the extremes attained since 2002.
At the 2002 bear low there was certainly an extrema, downward exhaustion of the last bear market. Thus, a transition happened and therefore an important time line = 1 is defined.
If we draw up the Blue Arc from there to the next important extrema of the bull, the 11/2007 high, we realize that shortly before the important time line 2 the low (03/2009 higher high) was marked that kicked off the current bull run. The current bull run topped now shortly before the important time line 3. So, the leader seems to decline now into the important time line 3, briefly and heftily! Since August 2015 is quoting narrowly before the important time line 3 – just like the 03/2009 higher high – there is thoroughly the strong possibility that the August 2015 low was the extrema already = V-bottom scenario.
Since September 2015 is quoting exactly on the important time line, it is likewise possible that this month = month # 3 or October 2015 = month # 4 of the correction will bring the next extrema! November 2015 = # 5 of correction is behind time line 3, so its more likely that correction month 2, 3 or 4 will deliver the correction low!
Alright, if the August 2015 low falls, another crash move may come bottoming either B) in September or C) in October. Maximum downtarget thrown out by this setup is ditto the 3150 region!!
DAX/FDAX monthly time frame:
What clearly speaks for the V-bottom scenario to happen – I mean the correction lows are prepared – is the performance of the DAX. It corrected exactly 5 months from the April 2015 alltime high (ATH). It also corrected for exactly 21 weeks reaching a super strong DECADE bull-support at the 9318 low on Monday. For now FDAX has corrected 25% since ATH. A normal correction within a bull market is defined by a 10 to 30% decline from high to low. For now NASDAQ-100 shows a 14.4% correction leg from April 2015 highs to Monday lows... For the analysis I’m using the DAX Future contract = FDAX:
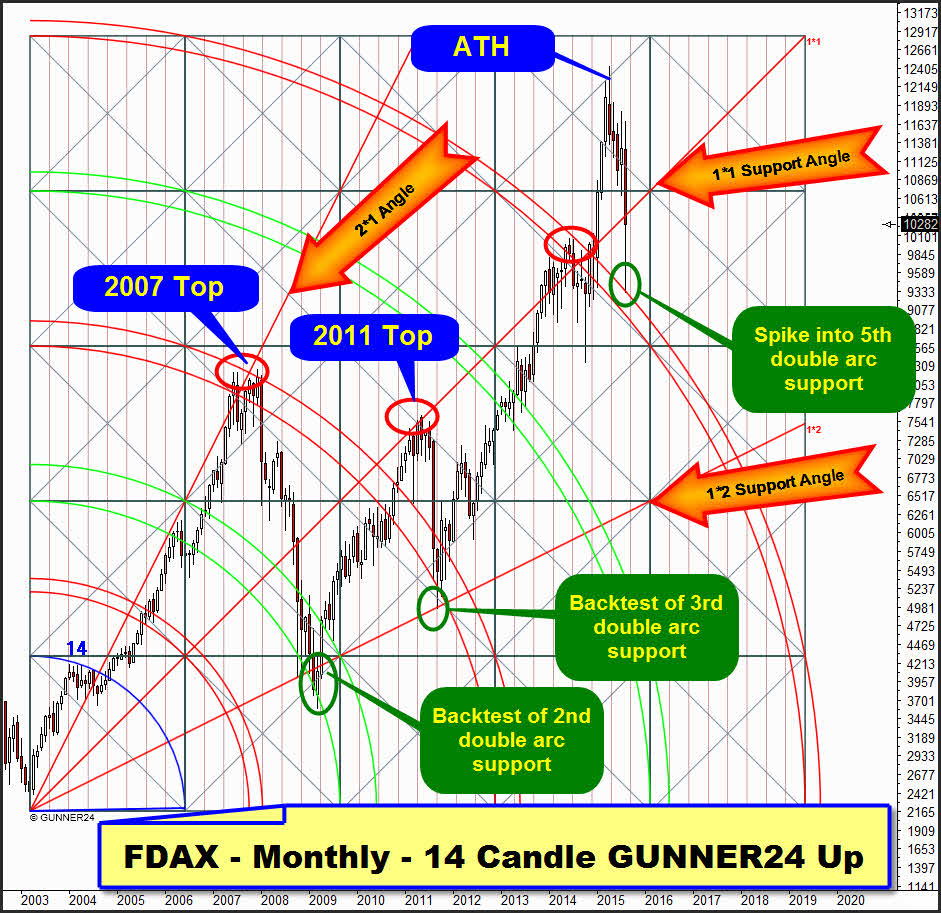
On Monday, it spiked exactly into the upper line of the 5th double arc support of the ruling 14 candle up that starts at the final 2003 bear low.
==> !!!Being reached/worked off this support – a decade support - pinpoint at the time when monthly and weekly Fib numbers count together implying a price extrema = important correction low is a strong indication that the DAX has finished its correction on Monday!!!
So FDAX/Dax usually should aim now the upper price end of this setup for the year 2016:
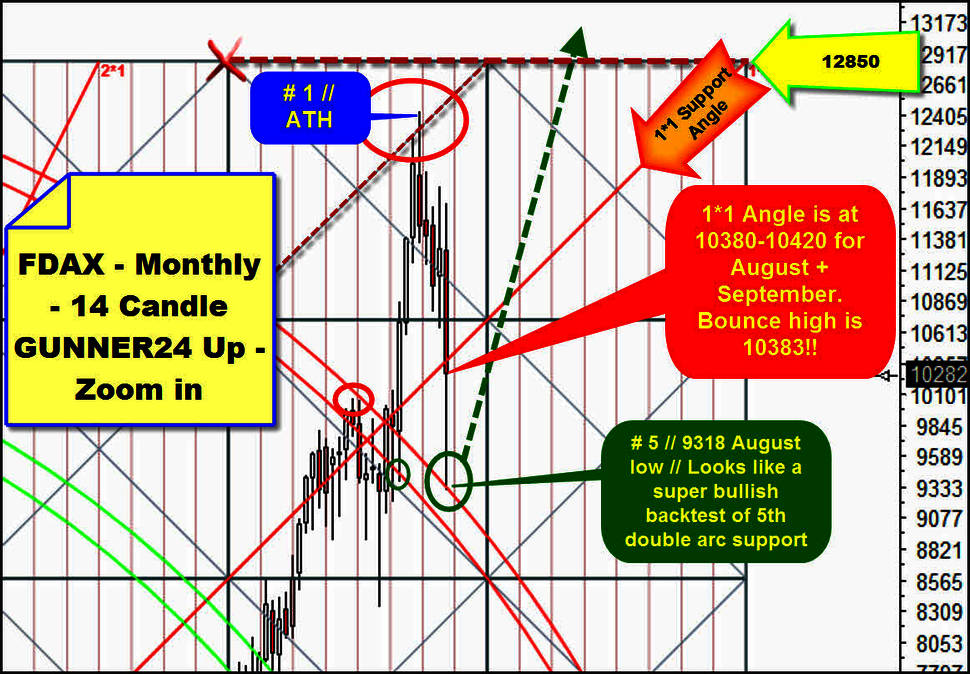
I think a first positive backtest of an important support cannot turn out clearer. Depending on the August 2015 close, some shortterm scenarios come into consideration now:
A) The FDAX succeeds in closing the month above the 1*1 Angle (10380 for August 2015) - swing starting at 9318 lows topped on Thursday at 10383, thus confirming the 1*1 Support Angle as strong August 2015 resistance now -, then it will be expected to correct till 9600 at most in September before the V-bottom goes on. In case of such an August close, September may thoroughly test as much as 11000 to 11300!
B) The FDAX does not succeed in closing above the 1*1 Support Angle, then it will be supposed to correct at least to 9400 in September. 2015. In that case it will also be allowed to deliver a further but just a small lower low in September 2015 – newly at the upper line of the 5th = about 9200-9250 before the bull market sallies forth to work off the price end of the setup at 12850-13000 in the year 2016!
Be a part of our exclusive sworn GUNNER24 Trader Community – now... I try to protect your wealth!
- with daily trades – quick, safe and profitable…
- in well-chosen precious metals, commodities, indexes, currencies and in the best stocks worldwide...
- in both rising and falling markets…
- with little use of capital…

Click the button below and order the GUNNER24 Trade of the Day - $49.90 US a month.
 |
Be prepared!
Eduard Altmann