
US stock markets are overbought. The S&P 500 has been rising for as many as six consecutive days, an event not seen for nearly two years. Some important weekly resistances are reached now and a down-turn is due. As analyzed in the last free Sunday issue, on Wednesday we opened a weekly short-position at 1402 index points. Now we’re waiting for delivery:
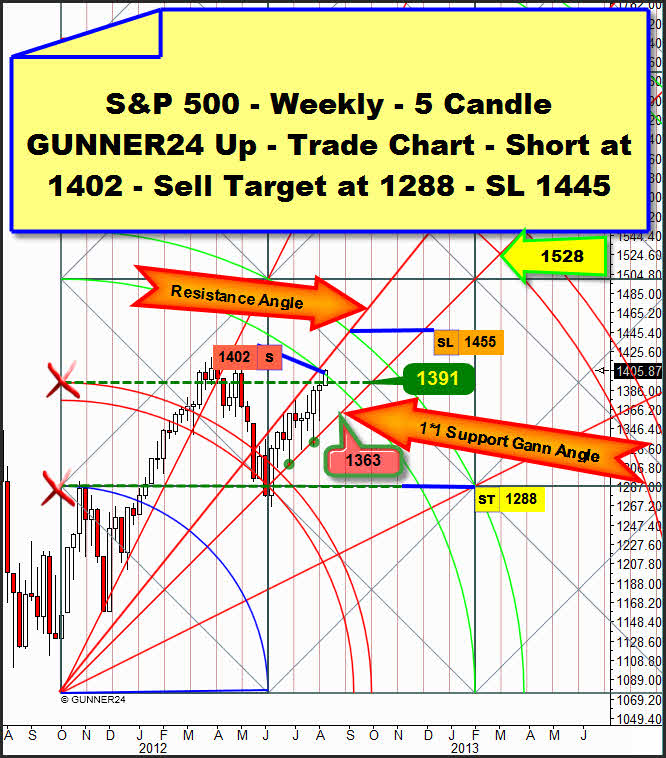
The weekly close above our short-trigger – the lower line of the 2nd double arc at 1402 – is another indication that after the correction that we expect now lasting at least 3 weeks but rather 5-6 weeks the 2nd double arc is supposed to be taken and overcome in the course of autumn and winter. The prospective target for this uptrend is the surrounding of the 3rd at 1528 until March 2013. Thus, also in the weekly time frame the market will confirm the 1528 long-term target in the monthly time frame. Please pay attention about that to the S&P 500 chart with the monthly 3 Candle GUNNER24 Up Setup published here:
http://www.gunner24.com/newsletter-archive/june-2012/03062012/
For the moment, the milestone in terms of price for the now expected correction is the weekly close below 1391 – expected for next week – then the 1*1 angle at about 1363 will be the next start-up point being supposed to be headed for within week # 3 of the correction. And after a new rebound from the 1*1 and a brief consolidation above the 1*1, after the first week close below the 1*1 angle the 1288 are supposed to be reached pretty fast. There, in the 1288 surrounding the market is expected to mark an important higher low going up then rather trouble-free to 1528 during the following six months.
In case the market makes no move to turn down or to reach the 1391 next week we might have a very strong indication that the expected correction is likely to last only three to four weeks going maximally down to the 1*1 after an important top that is supposed to be made within the lines of the 2nd double arc. But it’s still too early to think about such a correction course.
NASDAQ-100 – is likewise at an important weekly resistance:
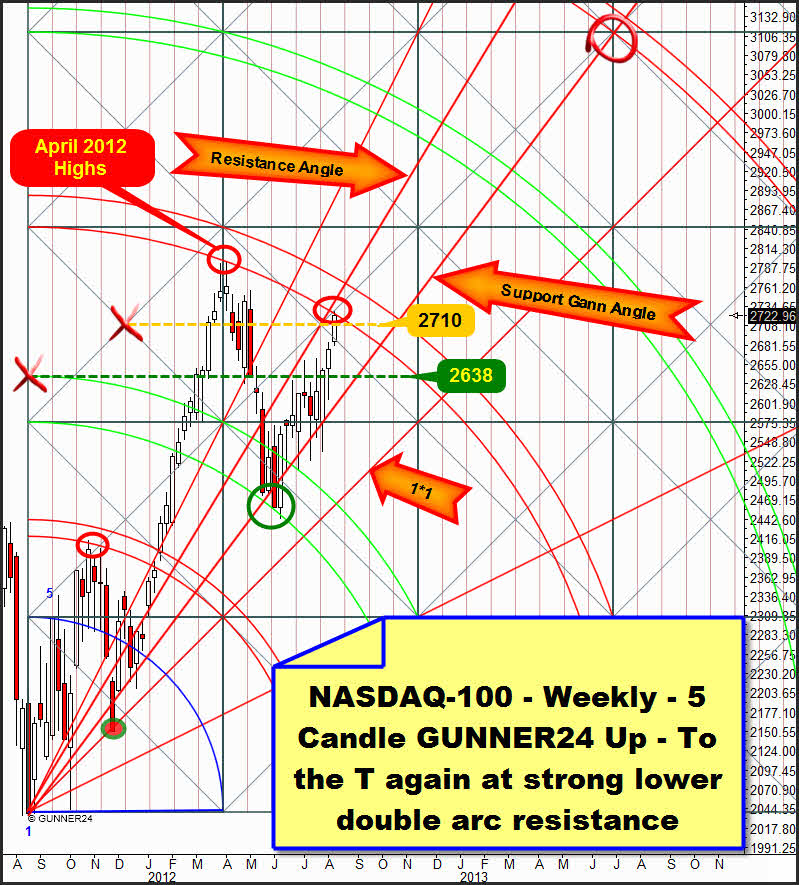
Here’s the actual weekly 5 Candle GUNNER24 Up. Here again we see that a natural weekly resistance area is newly reached. The lower line of the 3rd double arc brought the market to its knee as early as by the end of March/beginning of April 2012. Thus, both important markets, SP500 /NQ100 arrived simultaneously at important natural resistances.
So to speak they are walking synchronously reaching the resistances simultaneously. For us traders this is an important realization because now we can draw two markets simultaneously for our trading decisions, we can compare both markets thus being able to assess the situation in a better way.
Let’s see for instance the actual weekly candle. Considering this one we find that it doesn’t show a long upper wick compared with both weekly candles that reached the lower line of the 3rd in March/April. The March/April candles spiked away from the lower line of the 3rd. The actual candle doesn’t. That’s a sign that the resistance of the lower line of the 3rd is not so strong as it still was in March/April. So to speak the resistance was weakened which is a clear indication that the lower line of the 3rd is supposed to be overcome sometime, to fall. And this in turn points to the fact that any decline can only be a question of a correction in the actual trend – no matter whether it starts next week or the week after next. That again means that any short-position has to be monitored extremely because it just retraces a countertrend that in turn may end very quickly at some important supports/magnets.
Another synchronicity feature: The S&P 500 closed within the lines of the weekly 2nd double arc already. If the NASDAQ-100, too, succeeds in closing within the lines of the weekly 3rd we’d have the indirect confirmation that also this market is supposed to finally overcome its currently most important weekly resistance area, the 3rd double arc.
The most important target to go for the expected correction is for the moment the support Gann Angle in the weekly 5 Candle GUNNER24 Up above. A weekly close below 2638 activates the strong 1*1 support Gann Angle as the maximum down-target of the correction in this setup. At the latest after reaching the 1*1 angle the NASDAQ-100 would have to end there any correction forcing/chasing the market up until spring 2013.
After going intensely into silver in the long-term chart last week, today I’d like to take care of gold again. The yellow metal is still babbling to itself, summer doldrums. The doldrums are nearing their end, the traders/dealers/producers are returning from their vacations step by step, and in the analyst woodland you can actually hear the murmur that due to the seasonality the rally was either started already being in its kindergarten stadium so to speak or the actual resistance area between 1620 and 1640 should have to be overcome soon signaling then the 2000$ again.
In the process, again and again we are referred to the virtually "historically" low short-positions of the commercials, to the possible collapse of the Euro and the Greece default or to a Big Whale that has been physically absorbing everything below 1600$ or to the extremely bullish triangle in the long-term gold chart. Hmm…
Let me analyze at first the doldrums sideways shoving. That is best to be done with the daily up setup since the May lows:
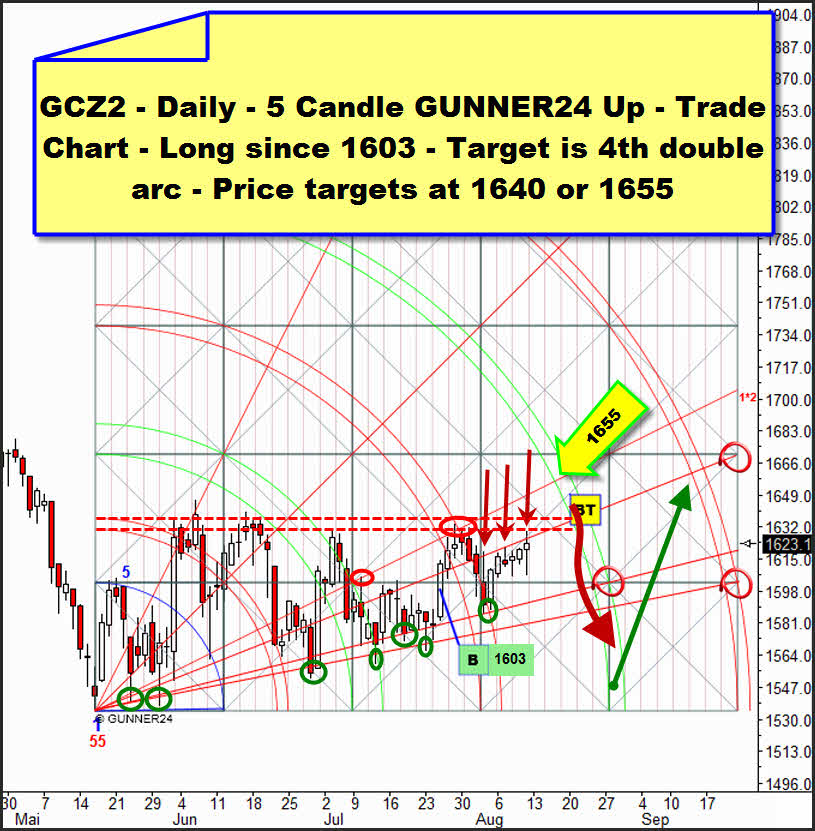
Gold is long within daily time frame. There’s no question about. We, too, have been long since 1603. Both support Gann Angles anchored on the right of the setup which have been responsible for the higher lows are clearly to be identified. But the main problem is that we cannot make out any initial impulse at all that might have led just once to a definite and lasting break of a double arc.
That means until now there is no genuine impulse that might be the trigger button for an imminent strong rally towards 2000$!! From below the support angles are backing, from above we are seeing the double arc resistances that have been prevented higher daily highs so far. Well, since an initial impulse cannot be made out it will have to be formed at first. But that would take a severe decline again before. Before an intense visible uptrend can develop, an important low must happen again… Logical, isn’t it?
As the next time window for an important low the beginning of September is offering itself. It is where the 4th double arc is ending at the x-axis. Well, as a reversing conclusion the next important high cannot form before the touch with the 4th double arc – possibly at 1640, maybe at the 1655 magnet where the 1*2 resistance Gann Angle intersects the 4th double arc. At any rate we’ll cover our daily long-position at the first touch with the 4th double arc. The touch is supposed to occur between the 08/18 and 24.
The daily setup above won’t expire before the end of September. That means on the one hand that gold is probably going to be in an uptrend until the end of September – be it as narrow-chested as it may… and then it will have to fall harshly.
Or – if we want to see things positively – perhaps not before the end of September the rally we are all waiting for that yearningly will be able to start. Interpreting the setup above as a groundwork setup or a sideways-trend setup we can suppose this outcome to be likely.
Monthly view:
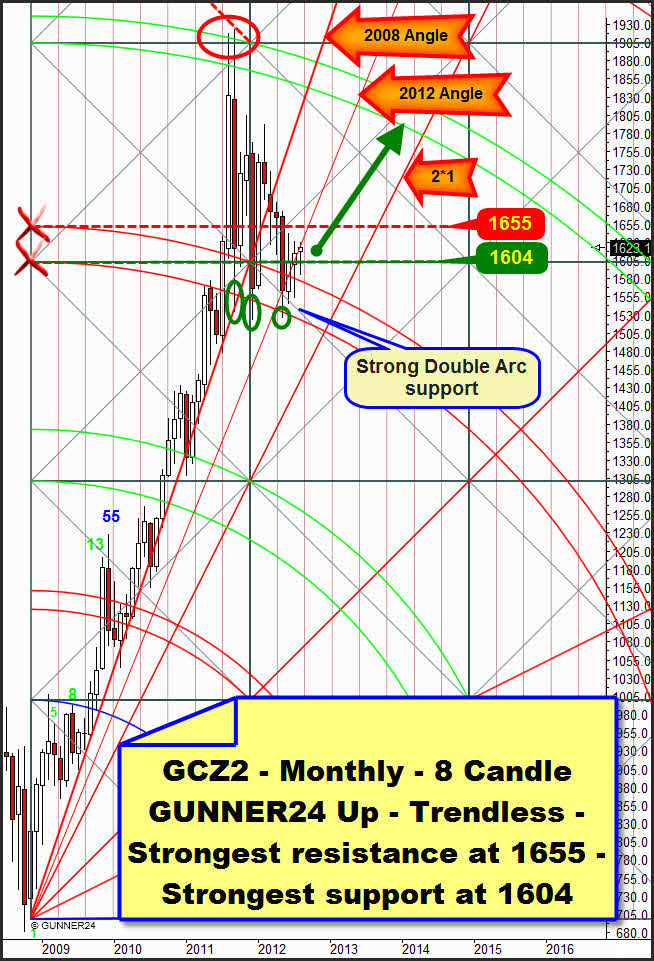
Technically the actual monthly 8 candle up would allow the heading for the 4th double arc. Thus I absolutely opine with many other gold analysts that the rally will come. For me it’s but a question of the timing of the rally, when will it start off, whether we’ll have to see a significant low again before… see above…
The 3rd double arc resists it has been tested several times successfully. July closed above the extremely important 1604 support. By the way, this one is very extremely important. It concerns a support we cannot only identify as a strong Gann magnet in two different monthly setups but also in the daily and various weekly setups.
Officially the starting signal for the rally can only be triggered with a monthly close above 1655. Before that happens in the extreme case gold may really retest again extensively the 3rd double arc for as many as 5-6 months!!! Maybe it will first take a touch with the 2*1 support Gann Angle before we can expect a clear up-impulse. That would mean 8 (!) more months of correction with new lower monthly lows.
The most important angle now is the "2012" Gann Angle anchored in the chart above:
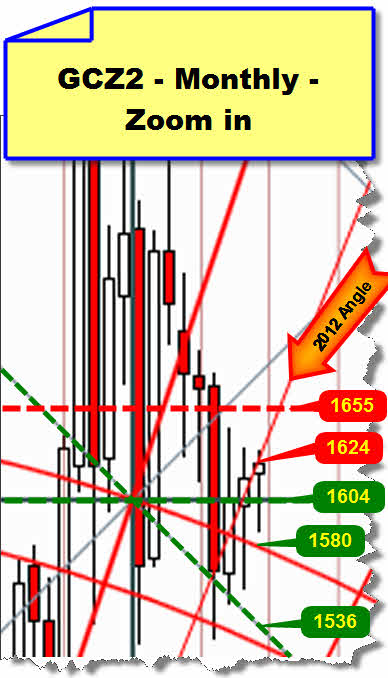
We see that May closed exactly on the 2012. So did June and July. Thus the 2012 angle is giving the gradient rate of the actual upmove in price and time now. The 2012 angle is a magnet gold hasn’t been able to get loose from. Its condition has changed between support and resistance during the last months not permitting any new lower low, but higher daily highs either. That’s why we have rather experienced the last months as a sideways move with a positive tendency.
The resistance chains cannot get loose before gold concludes above the important 1655 in August or September. In that case the 2012 angle would change its condition from being a hybrid to become a clear and important monthly support angle! From the GUNNER24 point of view the rally would be on. Before that it’s possible that the 2012 angle and also the horizontal 1655 resistance force gold to a new test of the 3rd double arc.
This month the 2012 angle is exercising mainly its resistance function. Just have a look to the actual August candle. The August highs are at 1633.3, the Friday close is 1$ below the angle. Because of this angle it’s so difficult for gold to get above the 1640 and the 1630 in August.
In case gold rebounds from either 1655 or 1640 or 1630 one of the next days, newly turning down the most important monthly supports are recorded in the zoom in chart above…
You best register with our GUNNER24 Gold Trader now. That’s where we oversee the optimal entries and exits for you. Especially in the difficult market situations where many factors have to be considered the Gold Trader is backed by the additional GUNNER24 Signals based on the combined 1, 4 and 8 hour setups to catch the optimum entries and exits.
|

The GUNNER24 Gold Trader will provide you with the critical knowledge you need to forecast and analyse the precious metals with the GUNNER24 Forecasting Method. All the GUNNER24 Trading Signals you receive real-time are based on the actual Gold and Silver Future. The NEW GUNNER24 Gold Trader is a must for every actively working investor and trader who wants to trade successfully in everyday trading. The insights you receive from the head trader Eduard Altmann (and discoverer of the GUNNER24 Forecasting Method) are truly amazing sometimes. I promise!
Click the button below and order the GUNNER24 Gold Trader - $39.90 US a month. For 201 members and up - $49.90 US a month.
 |
Be prepared!
Eduard Altmann