
On Friday 07/24/2015, the current bear low was delivered to gold. The most active gold future contract reached 1072.30$ at the new bear low.
This 1072.30 bear low has got the potential of having marked a rather persistent bottom, because the 1072.30 low = yearly horizontal support can be derived directly from the 1923.70 all-time high of the year 2011.
Thereby, this low might even succeed in balking the present deflation sell-off move for 5 to 15 more days before gold shall finally break it order to tackle in succession the test of the round 1000$ mark. The test of the 1000$ magnet may be expected to occur in October 2015 – at the latest. Why the test of the 1000$ magnet is to be expected compellingly, please read it up in the free GUNNER24 Forecasts, issue 07/19/2015.
The gold bull topped finally at 1923.70 in September 2011.
The very first impulse down from the bull high bottomed in December 2011 at 1523.90, see the orange circle in the following monthly chart.
==> Thus, as very first reaction, gold corrected its all-time high by pretty exactly 400$ = from 1923.70 to 1523.90. A several month consolidation above the 1523.90 support horizontal followed:
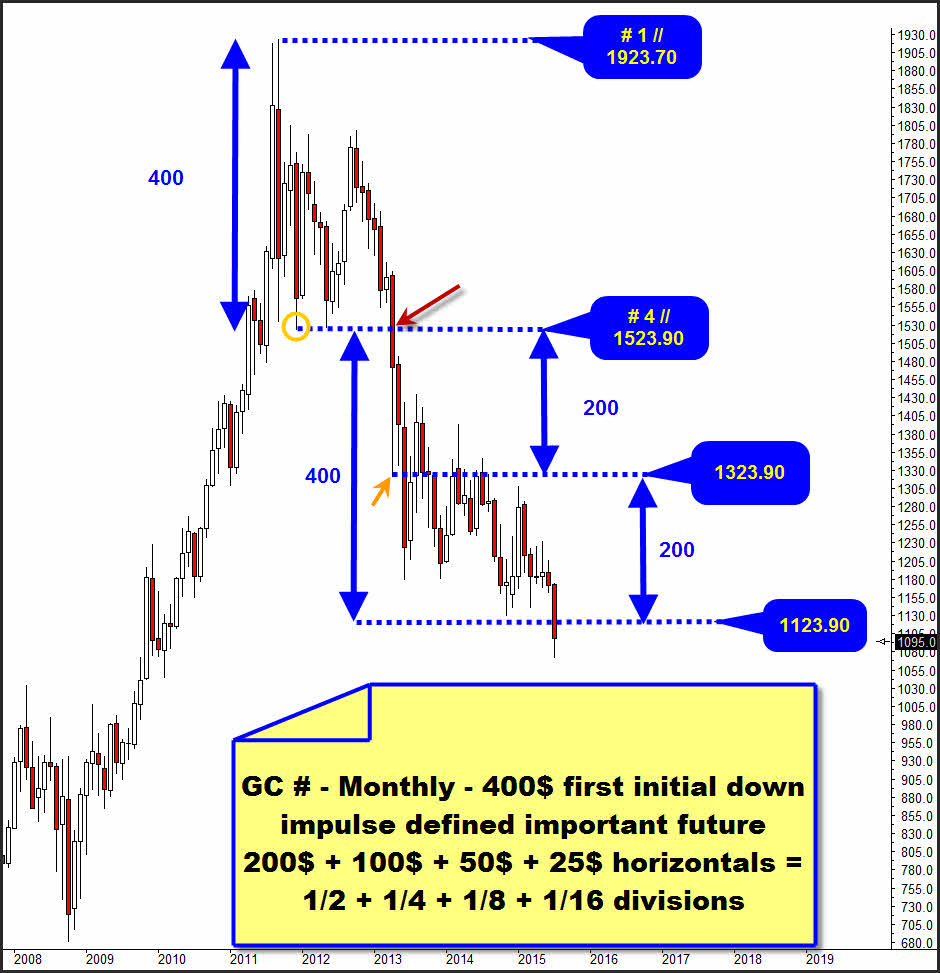
From this very first 400$ initial down impulse – as became apparent – some horizontals are derived that for the gold price are meaningful in the time to come. These horizontals have magnet function as well = pivot function for the future gold price in the current bear market.
==> These horizontals are based on the 1/2 + 1/4 + 1/8 + 1/16 divisions of this very first 400$ down impulse. I.e., they all are located respectively present lower by 400$/2 = 200$, 400$/4 = 100$, 400$/8 = 50$ and even 400$/16 = 25$.
Proof for this assumption:
In hindsight we can recognize that the first important stopping point of the new down move came in with the spike low (1321.90 at the arrange arrow, namely most exactly at the 1/2 division of the very first 400$ initial down impulse after the very first important horizontal support had been left downwards at 1523.90 – watch red arrow. 400$/2 = 200$. 1523.90-200 = 1323.90
Let’s trace our line of argument a little deeper now in detail and into the daily chart where we want to evaluate the theory that the intervals of 200$, 100$, 50$, 25$, starting from the 1923.70 all-time high, are all present:
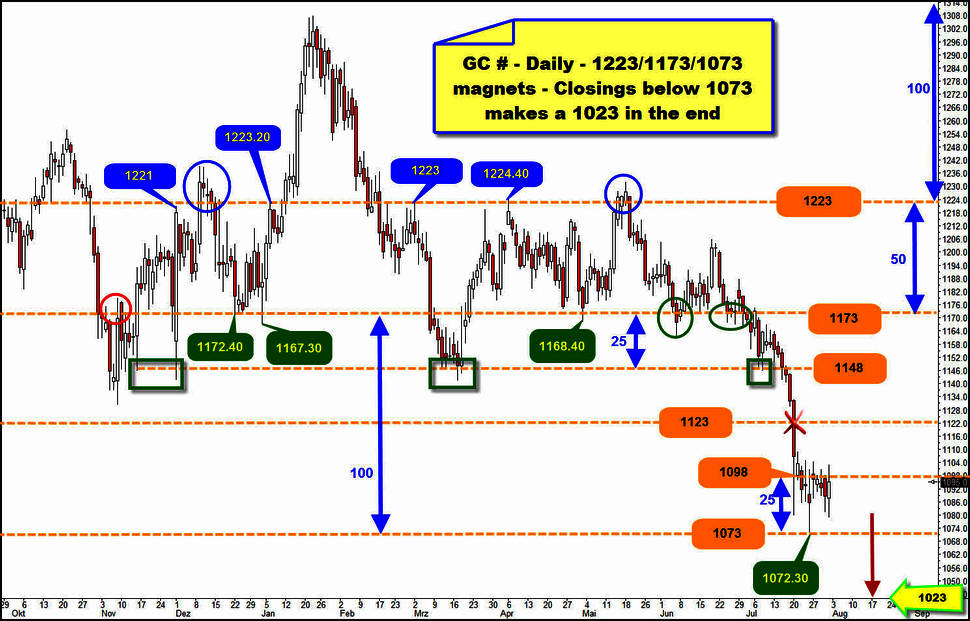
After the 1523.90 support horizontal was broken finally and vehemently, the first important spike low = important horizontal is at 1321.90.
The 1223 horizontal takes its course exactly by 100$ lower (rounded off a little for better comprehension). From September 2014 on, this one was important pivot = magnet for gold. In the daily above, we recognize 4 – rather pinpoint - important highs (blue notes) and backtests at the 1223 and at the blue ovals some very important swing high areas that certainly exceeded the 1223 at times, in the end not being able however to overcome the resistance of the 1223 sustainably.
==> All in all, we can record that from September 2014 the 1223 represented super important and strong resistance horizontal, gold not being able to overcome it permanently = 1223 is the most important confirmed resistance for the year 2015 and beyond!
By 50$ below the 1223, the 1173 is situated that from the end of 2014 till now has had the same meaning for the gold price as the 1223. After the Nov-2014 bear low, the 1173 was re-conquered at first, then being tested as important supports many times. Mind on this the green important-low notes and both green ovals.
By 25$ below the 1173, the 1148 horizontal is situated. As it were, from Nov-2014 into the the whole year 2015 it was the last bull support before 1100… please watch all the very important 1148 tests marked by the green rectangles.
After at first the 1173 had been given up at the beginning of July 2015, the definite fall of the 1148 horizontal led the price to slip swiftly through A) the 1123, and moreover, unbraked it went B) through the 1098 horizontal. This one is now - i.e. by virtue of the developments of the last couple of days – confirmed daily+weekly closing base resistance and thereby currently most important and next higher resistance on daily+weekly closing base.
By 25$ below the 1098, 50$ below the 1123, 150$ below the 1223, 250$ below the 1321.90, 450$ below the 1523.90 and 850$ below the 1823.70 all-time high is where the 1073 horizontal takes its course. The current bear low is at 1072.30.
==> If the current 1072.30 bear low is fallen short, the next stops for the current deflation sell-off move will be supposed to be found initially at 1073-25 = 1048 and 1073-50 = 1023!
Importance of the 1123
The attentive reader might ask himself now what’s it all about with the 1123?! It’s a pivot that Altmann hasn’t mentioned at all, respectively it was simply smashed by gold without being taken into consideration as important mark so far…!!? All the same, it has got enormous signification for the future development of gold, imho.
First initial down impulse starting from the all-time high was 400$. 2 x 400$ deducted out of the all-time high of 1923.70 makes 1123, rounded.
==> Technically, 1123 should have been extremely important and natural horizontal support for the metal!!! Yet, since this support/magnet was smashed completely and vehemently, the day of its smashing it released further enormous downforces.
Just pay attention to the length of the daily candle where the 1123 was finally smashed (red X). Even optically, for the whole year 2015 this candle is the longest from the daily high to the daily low we can identify. From the high to the low, the candle of 07/20/2015 comprised 52.50$! The break of the 1123 triggered off enormous downforces that cannot come to an end before the 1023 being reached, so most likely not before the test of the 1000$ magnet!
==> The 1123 is now and into 2016 most important horizontal resistance for gold.
==> Thus, that’s where the best – because safest – short-entry into the current sell-off wave is!
In case the 1123 is tested back in the course of the coming days ==> Short the 1123 like hell!
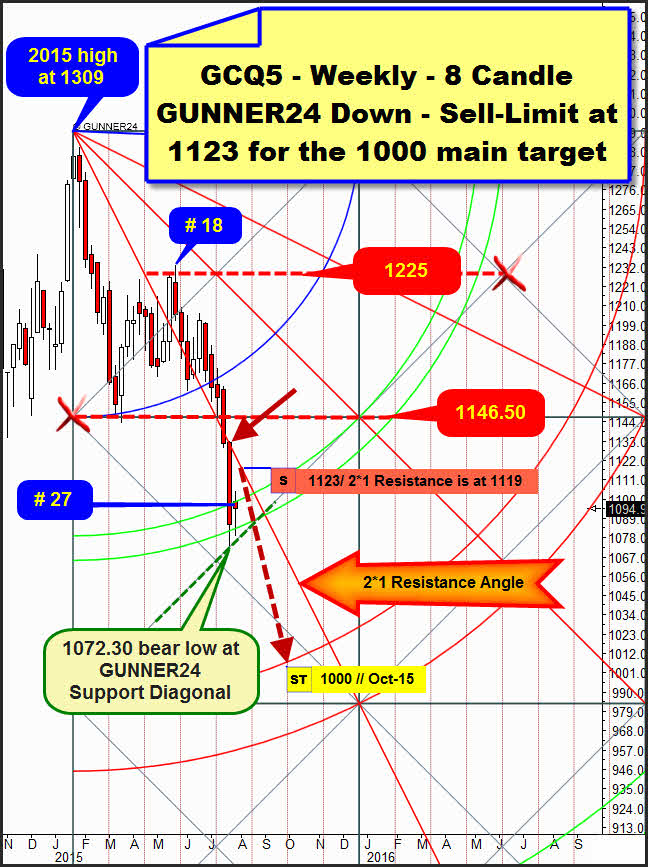
In conclusion of today’s issue another briefing on the currently valid down setup on weekly base. With its signal status it clarifies best the awkward situation/the present trend state. The weekly down setup starts at the 2015 highs measuring a first initial down impulse of 8 weeks. The current sell-off wave began with the backtest of the 1225 horizontal of the first square at the high of the weeks # 17 respectively # 18. The all-time high of 1923.70 - (7 x 100$) = 1223$.
At the latest after the first square line at 1146.50 was smashed ==> corresponding to the 1148 – last bull-horizontal before 1100, see above – it was for sure that at least the "round" 1100 had to be reached as part of the sell-off wave. After the fall of the 1146.50 – first square line, the next official downtarget was the upper line of the 1st double arc.
This downtarget was worked off the week before last and – bad for all the bulls – fallen below. The week before last bottomed at the new 1072.30 bear low. The week candle before last as well as the last candle closed within the lines of the 1st double arc. The last candle opened exactly at the upper line of the 1st producing a red body. That confirms now the upper line of the 1st as to be the first important = strong weekly closing base resistance. The upper line of the 1st is at 1098 for the coming week...!
Both last weekly closings within the lines of the 1st double arc use to mean more harm to come for all the bulls, as a rule! Technically, these closings prepare the final downside break of the 1st double arc support environment area.
Certainly, the 1st is still stabilizing on weekly closing base, but supposed to fall soon: Since the high of the year 2015 as many as 27 weeks have passed. Week # 27 markekd the current bear low, far away from the next possible turning point according to the Fib count, the 34! Thereby, gold is supposed to keep on being weak for 6 more weeks - perhaps even longer.
Consequently, the 1072.30 is not supposed to hold either! Thus, the test of the round 1000$ magnet would be confirmed as next important downtarget of this deflation sell-off wave also in the weekly time frame, because the upper line of the 2nd double arc takes its course nearby from September to October 2015. If the 1st double arc on weekly closing base is fallen below, the sell-off will tighten ONCE MORE being reached the 1000$ pretty fast!
The obvious weekly resistance (watch dark red arrow) of the 2*1 Resistance Angle is where the optimal short-entry for next week is. The 2*1 Resistance Angle is at 1119 for the next 5 trading days, not far away from the presently strong 2015 resistance horizontal 1123 whose backtest should be shortened obligatory!
Be prepared!
Eduard Altmann