
By all means, US Copper and the linked Copper Stocks were clearly high-ranking within the hottest sectors in 2017. By the beginning of 2018, however, this market also slowed down together with the Dow Jones and S&P 500, and has traded mostly sideways, only to start its first really tenacious correction in the current running multi-year bull market cycle at the June 2018 annual high that has arrived at 3.32$.
Today’s issue replies to the question how long the actual copper bull market correction might continue, which lows it should have to reach normally and at the maximum resp. from which support/s the copper bull market is expected to resume:
Almost 11 months have passed since my last copper forecast. The last time that happened within the free GUNNER24 Newsletter was in September 10th 2017.
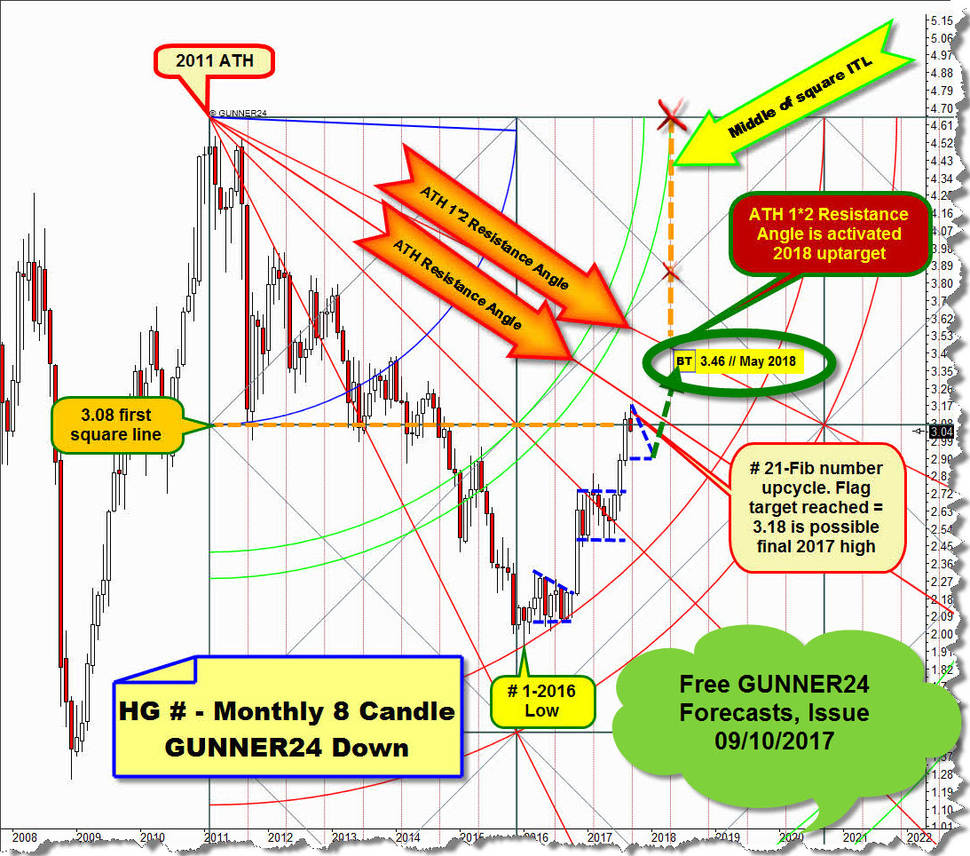
At that time, in September 2017 inter alia I presented above main GUNNER24 Forecast, based on the monthly graph and the 8 Candle GUNNER24 Down Setup applied at year 2011 ATH. Copper quoted at 3.04$ then, because of existing price/time signals in the monthly chart being predetermined to test ATH 1*2 Resistance Angle out of 2011 ATH (alltime-high) at 3.46$ in course of May 2018, with prospect to print important bull market high then and there.
As mentioned above, it topped finally at 3.32$ June 2018 extreme into current 2018 High. 1 month later and a bit lower than expected. However, without touching or working off the ATH 1*2 Resistance Angle at 2018 highs. And this circumstance offers an important indication of what we can expect for US Copper in further course of 2018 towards the beginning of 2019.
That's why we now come to the current course of the correction and its possible targets in terms of price and time, continue with my new medium-term copper forecast and start it at received bull market highs:
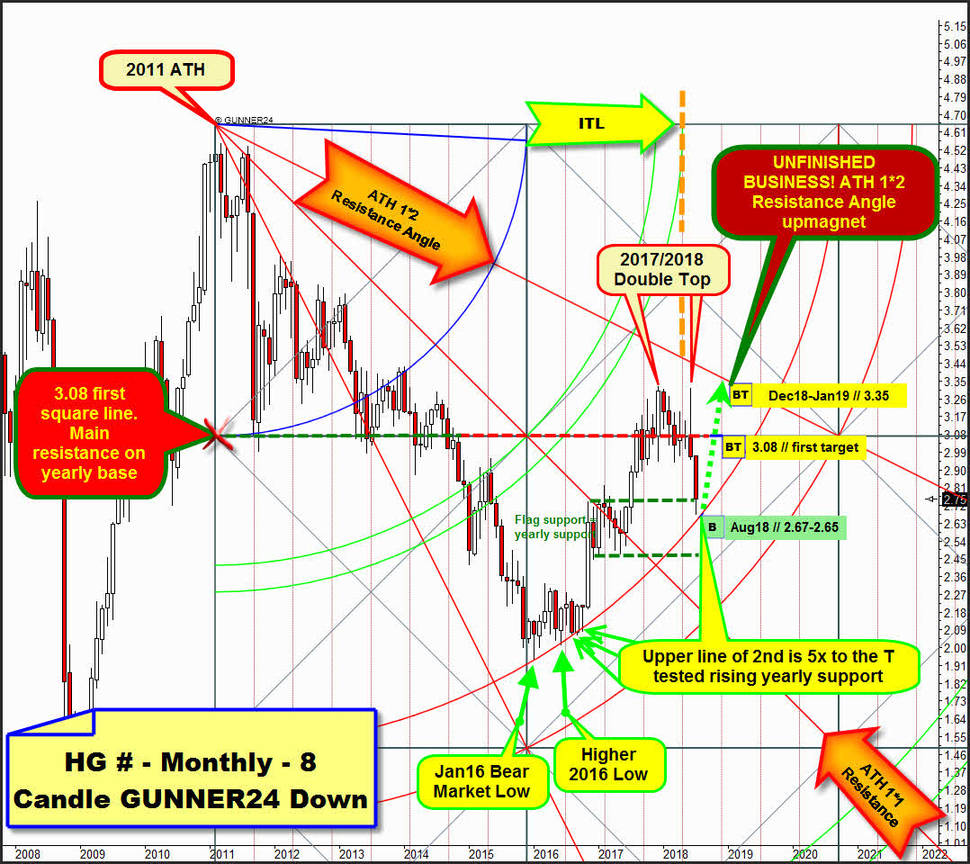
Both, final year 2017 high made in course of December as current 2018 high made in course of June are at 3.32$, thus copper shows a double top pattern in both the monthly and the yearly chart. As a general rule double tops are always sold, thats why strongest correction in overall bull market cycle has begun. Watch that June 2018 candle has a prominent upper tail, this is sign of total bullish exhaustion and bears have control actually.
Highlighted fat orange-dotted vertical is middle of square line, so important time line (ITL), at or close to GUNNER24 ITLs any market tends to print important tops or bottoms.
==> The signals of the GUNNER24 Method together with conventional chart technology explain why the market at June 2018 top was allowed to turn downwards and start a strong correction.
On Thursday, the correction bottomed into current correction low which stands 2.67$. The week close for copper has defended upper support line of a bull market continuation Flag pattern that developed over late 2016 - early 2017. Flag was halfway bull market pattern. Thus the underway copper correction dipped into overall monthly and yearly Flag support. It found 2.73$-2.47$ yearly Flag support range at week lows!
This month candle low occured VERY CLOSE TO MOST IMPORTANT rising bull market support which is upper line of 2nd double arc.
==> Since the bear market bottom, a series of some important higher monthly lows can be noted. Each is caused by the upper line of the 2nd double arc support magnet, so the upper line of the 2nd above is the dominating bull market support since prior bear market has finally bottomed at Jan16 Bear Market Low. Upper line of 2nd is accurately and 5 times very successfully tested bull market support and BIG correction downmagnet. Cause of this US Copper has a 99% odd of testing upper line of 2nd double arc within this correction!
==> This correction needs a next touch with upper line of 2nd double arc bull market support, I suppose and I expect that market will test - AND DEFEND!! - that bull market rail sometimes in course of August 2018 at 2.67$-2.65$.
IF copper defends 2.67$-2.65$ bull market arc on weekly closing base into end of August 2018 the copper is expected to test back 3.08$ which is first square line, actually most strongest backtest upmagnet in the monthly time frame.
I advise to go long US Copper at 2.67$-2.65$ for a 3.08$ first uptarget! Suppose upper line of 2nd test will come true early August, followed by a sharp snap-back bounce into 3.08$ that could be worked off until end of September!
But note this! - market has unfinished business with ATH 1*2 Resistance Angle that is activated 2018 main uptarget resp. most important = most imminent bull market uptarget. Late 2016 - early 2017 bullish Flag pattern fought 6 to 7 month candles in finally overcoming the ATH 1*1 Angle, prior most important bear market resistance, now another yearly support.
It succeeded finally, thus automatically the next higher important Gann Angle, the 1*2, became next most important bull market uptarget. Odds for reaching/testing or working off the ATH 1*2 Reistance Angle within running multi-year bull market is at about +80%.
==> GUNNER24 still points to a ATH 1*2 Resistance Angle test. Bull market should continue!
==> ATH 1*2 Resistance Angle could be tested at possible final 2018 high/early 2019 highs near 3.35$:
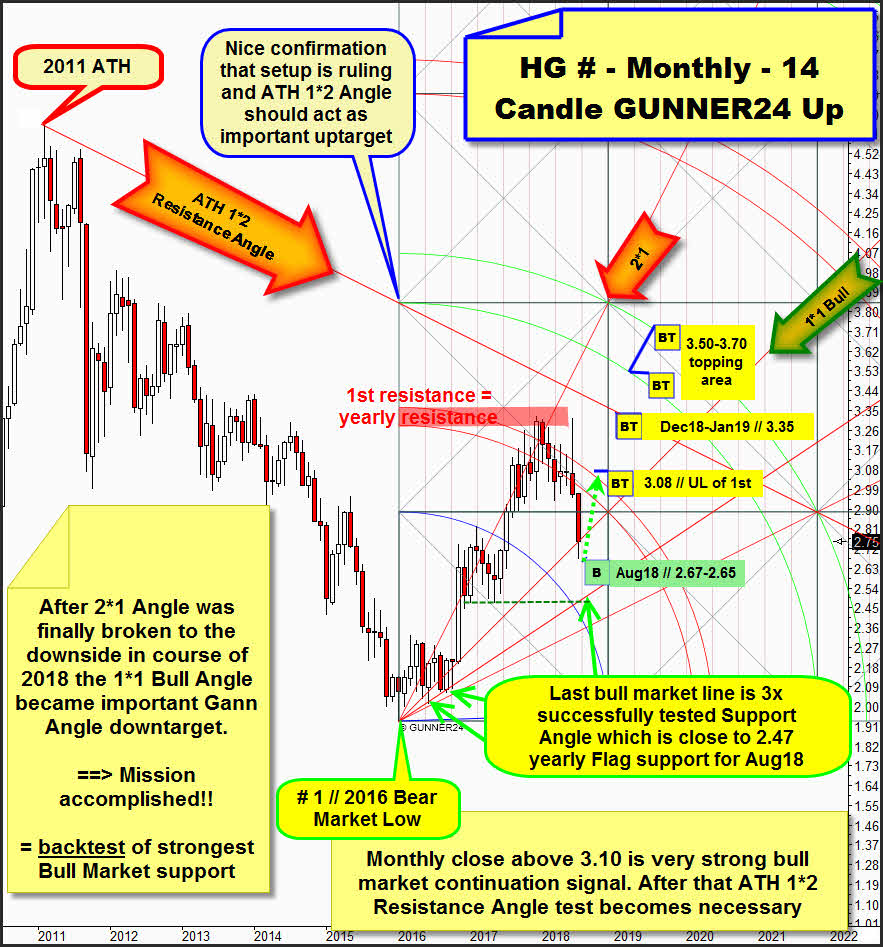
For concluding this important, cause game-changing commodity forecast, let’s still have a look at the bull market that began at the # 1 // 2016 Bear Market Low. I think, at present the 14 Candle GUNNER24 Up Setup positioned in the monthly chart above nails down the copper bull market best…
2016 to 2017 bull market rise was oriented to the rising 2*1 Angle. With the December 2017 close, the first monthly close above 1st double arc main resistance ensued and that close has activated lower line of 2nd double arc as next most important uptarget in the current bull trend to be reached. Lower line of 2nd main bull market uptarget could be tested in course of spring 2019 at 3.50$ surroundings.
Although we observe one decisive month close above the 1st resistance double arc that rail is obvious and well-negative resistance for entire 2018. Year 2017 and year 2018 double top resistance!
The final negative test of 1st double arc resistance environment is seen at June 2018 annual spike high where the current correction leg began.
After 2*1 Bull Market Angle early 2018 on monthly closing base was finally broken to the downside the next lower important Gann Angle which is 1*1 Bull Market Angle became natural downtarget according W.D. Gann`s important Gann Angle trading rules.
You observe that this quite normal bull market "backtest/correction" downtarget is now worked off with July 2018 candle developments and actual correction lows. Take a close look at 2.75$ week close which has defended 1*1 Bull Angle support to the T from above.
This means that correction actually is testing most strongest bull market support out of # 1 // 2016 Bear Market Low and usually this normally mega strong initial bull market support has high odd to hold and end running correction.
==> Overall 1*1 Bull Market Angle support within 14 Candle up and most strongest bull market support of upper line of 2nd double arc within 8 Candle down should lead to a strong bounce which should test back the upper line (UL) of 1st double arc resistance at 3.08$ until end of September 2018.
For this expected outcome watch light-green dotted arrow path above.
Please remember from above that the 3.08$ is also very important horizontal main resistance in the yearly time frame! Thus 3.08$ is most nearest important resistance magnet above current quotations. And IF the US Copper delivers a next monthly close above 3.10$ at September and/or October and/or November 2018 close market would have fired next BIG bull market continuation signal, just to work off ATH 1*2 Resistance Angle upmagnet near 3.35$ within weeks and maybe within December 2018 - January 2019 time frame.
A first future monthly close above 3.38$ = above ATH 1*2 Resistance Angle indirectly confirms that copper should reach a 3.50$ to 3.70$ in further course of 2019.
A 3.50$ up to 3.70$ until mid of 2019 could end this multi-year bull market.
IF US copper next slips through 2.67$-2.65$ initial bull market main support on weekly and/or July 2018 closing base, the then unfolding correction should reach combined lower yearly Flag support horizontal and light-green emphasized Support Angle near 2.47$ in course of August 2018 before correction should bottom there and then, followed by a 3 to 5 weeks lasting knee-jerk reaction into 2.90$ 1st double arc main resistance, maybe even "Big Round" 3$.
Be prepared!
Eduard