What does a topping process look like? There’s a significant high. The S&P 500 reached it last Thursday. After reaching such a significant high the market uses to have three options.
A: The market turns immediately after reaching the high falling severely in the further course without testing the high again, rudimentarily at least.
B: After the high the market is consolidating/retracing for one to three days then going up again in order to test newly the significant high. In case of a volume above average this test fails being produced a lower high, or it reaches the surroundings of the first high again respectively, turning down again subsequently – finally forming the slightly higher high or the double top respectively.
C: The market overshoots again the first high after the one to three day correction of the first high, and after overcoming the first significant high the market being pushed up by a volume above average, and subsequently exhaustion in price and volume takes place. A durable fall cannot happen before the market is completely exhausted because there won’t be any buyers left and the short sellers get into a superior position.
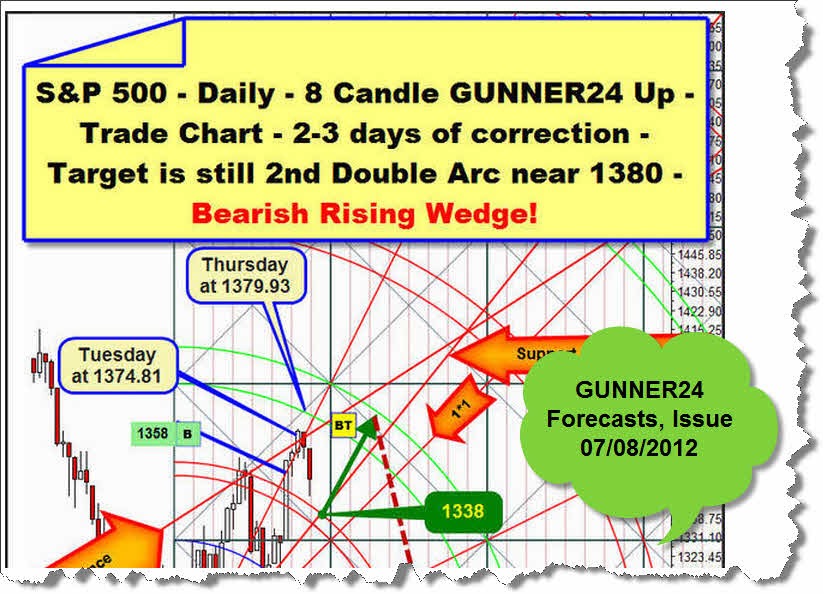
The way the S&P 500 is looking at present suggests that we have to reckon with the options B or C. Shortly we’ll consider more about that. But I’d like to start with the key chart of my last S&P 500 analysis. Here’s the S&P 500 in its daily 8 Candle GUNNER24 Up Setup of 07/08:
I’d say: Bingo – regarding as well the expected rebound from the first double double arc at 1338 as reaching the target at 1380. Everything was met almost perfectly. If you followed our recommendation to cover your long positions at the first daily close within the 2nd double arc you only stood to gain perfectly by the forecast market moves – without wetting your pants:
You see, by covering at 1374 we precisely escaped from the threat that is to be seen with the last day-candle on Friday, a tough daily reversal candle, you see, the kind that most frequently appears with significant tops, simply because the markets may like to turn rapidly and brutally with significant highs.
GUNNER24 always shows us perfectly the significant high/low surroundings by its double arcs, and the double arcs are where we have to reckon with turns of whichever nature at any time.
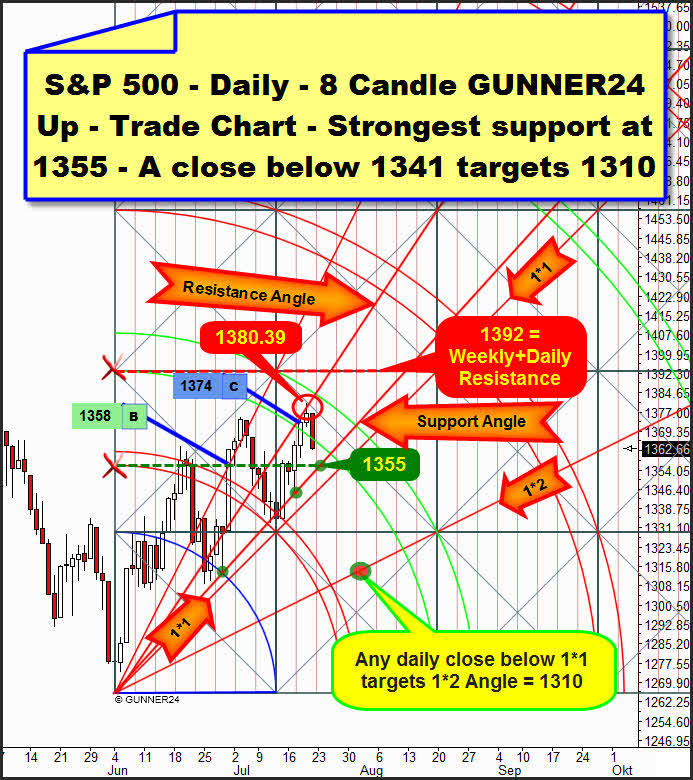
Well, how is this significant high to be interpreted? At first, we see a daily close within the 2nd double arc. As mentioned, we see a daily reversal candle but no candle that indicates even rudimentarily exhaustion in price, a so-called spike candle. Such is rather an infallible sign that the high is due to be tested at least once more. So it’s the B option – lower high (1378), double high (1380), small higher high (1382). To follow this course ideally the market mustn’t correct much lower than to the 1355 support magnet until Tuesday in order to target newly the 2nd afterwards.
A daily close below 1352 and the 1341 are the next target. That is the very strongest weekly support (see more about that in the following chart). A daily close below 1341 next week and 1310 are to be expected as the first daily down target.
The C option described in the introduction, overshooting of the actual 1380.39 high, cannot be excluded. On the one hand we can’t observe a volume spike at the ES future of Thursday and Friday. On the other hand the AAPL will report on Tuesday after market close. That might firstly end the correction after the highs and secondly lead to the price and volume exhaustion until 07/27. A possible exhaustion target is at 1392, the resistance that starts from the intersection point of the upper line of the 2nd with the beginning of the setup. A daily close above 1380 within the next 5 days would activate this target.
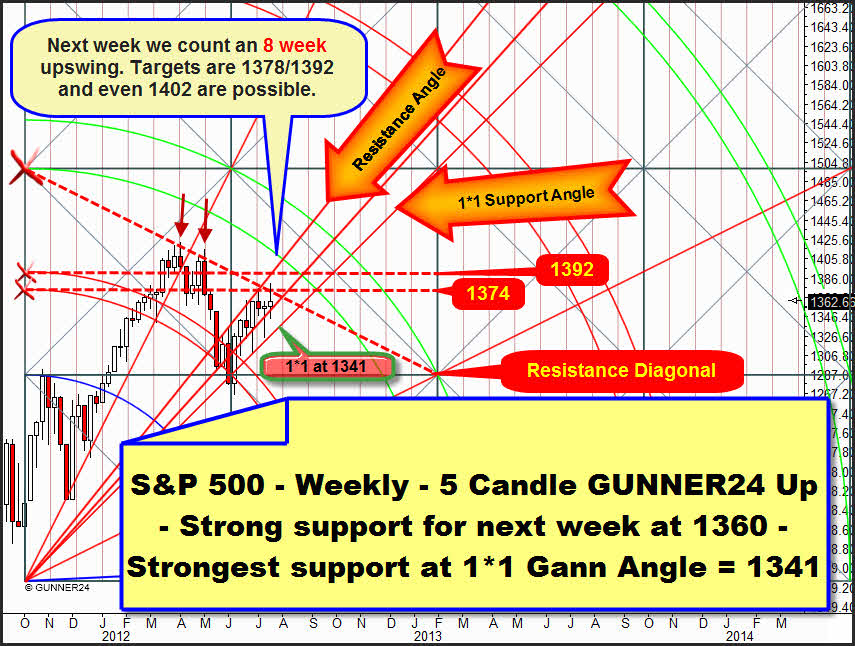
The 1392 can also be made out in the actual weekly 5 Candle GUNNER24 Up Setup. Here, too, the resistance of an upper line rises. The same GUNNER24 Magnet in two different time frames makes a test of this magnet become likely (C option).
The absolutely highest exhaustion target for next week is the lower line of the 2nd double arc at 1402. We enter a weekly short-position there – with target 1280.
We also see the way the long-term dominating resistance diagonal is working. Its resistance function has clearly been followed by the market in the weekly time frame. As early as in March and April its resistance leaded to some severe down swings. That’s why the rebound energy of last Friday was so strong. Naturally it may continue now without even once allowing a try to test the Thursday highs (A option)…
But, as mentioned above: I rather expect the B or the C options. The reason: The actual weekly upswing has lasted as many as seven weeks. Next week will be week # 8 of the upswing. The ideal moment for a significant turn is always rather the 8th than the 7th week. That’s simply the natural rhythm…
For the entry we’ll have to wait for a safe, free-of-risk daily short position for next week. Because not before that we can bring home and dry the outcome of the topping process pretty safely.
In Gold the elliptical resistance keeps on dominating
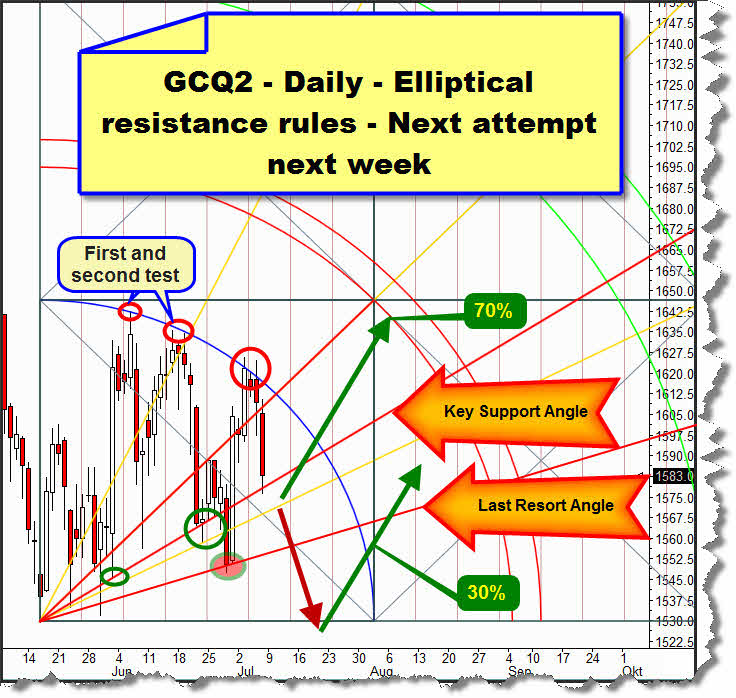
Here’s the daily chart of two weeks ago:
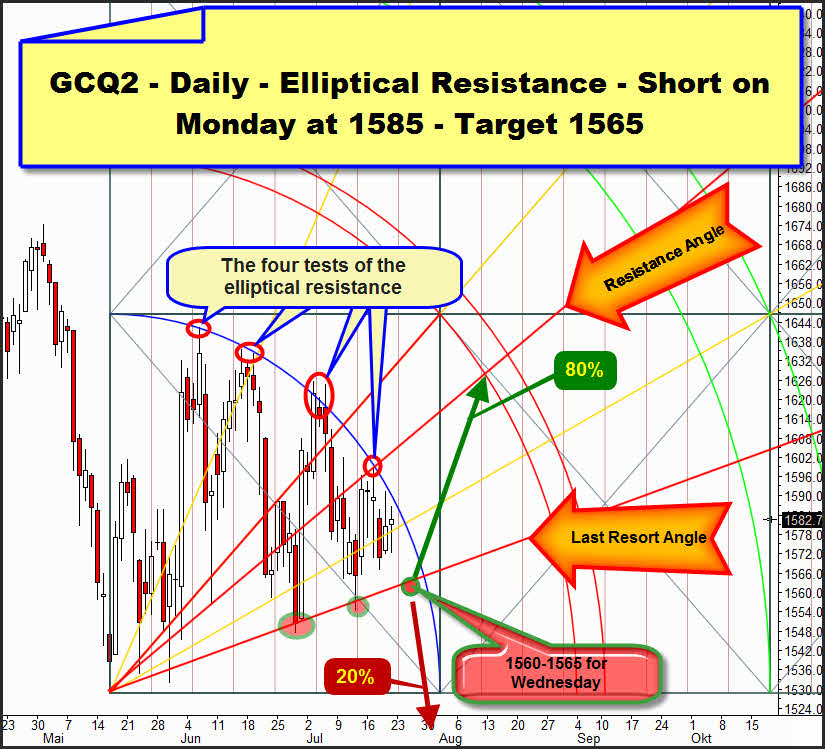
We have been observing for a fairly long time that the elliptical resistance is dominating the narrow gold market. Two weeks ago I expressed my expectation that technically gold should have broken it until today. I’m afraid the break of the resistance turned into an adjourned game:
In the meantime the resistance was headed for as many as four times. The fourth test was dismissed negatively as well. Certainly the fourth test leaded to a pretty weak decline in terms of price. That means in my opinion that the power of the bears begins to dwindle. Tomorrow the fifth test of the resistance will take place, and technically this time the resistance is supposed to be retraced as well and gold heading for the "Last Resort Angle" until Tuesday/Wednesday.
From there the next higher daily low is expected to be done and the daily elliptical resistance being definitely broken upwards. A daily close above 1590 as early as Monday or Tuesday should finally overcome the resistance. Target in that case would rather be the1640 instead of the 1630 suggested above (green arrow). At any rate we’ll go long in case of a daily close above the elliptical resistance! This is where you may always trace our gold entries:
http://www.gunner24.com/performance/
If gold closes on daily basis below the "Last Resort Angle" next week, the 20% probability of a new test of the 1530 and possible lower lows will be due until 08/03 because the temporal influence of the elliptical resistance is not going to end before that finally.
Register with our GUNNER24 Gold Trader now. That’s where we oversee the optimal entries and exits for you. Especially in market situations where many factors have to be considered the Gold Trader is backed by the additional GUNNER24 Signals based on the combined 1,4,8 hour and daily setups to catch the optimum entries and exits.
The GUNNER24 Gold Trader will provide you with the critical knowledge you need to forecast and analyse the precious metals with the GUNNER24 Forecasting Method. All the GUNNER24 Trading Signals you receive real-time are based on the actual Gold and Silver Future. The NEW GUNNER24 Gold Trader is a must for every actively working investor and trader who wants to trade successfully in everyday trading. The insights you receive from the head trader Eduard Altmann (and discoverer of the GUNNER24 Forecasting Method) are truly amazing sometimes. I promise!
Click the button below and order the GUNNER24 Gold Trader - $39.90 US a month. For 201 members and up - $49.90 US a month.
Be prepared!
Eduard Altmann

