
Seasonal aspects are pointing to an important interim top in the US stock markets soon. The average course of the Dow Jones in post-election years considered over 1897 to 2009 shows the absolute year-high for the beginning of August.
The absolute year-high in the post-election years with continuation in office is likewise marked at the beginning of August.
Both cycles have in common that by the beginning of August the market uses to top out, turning subsequently and falling through November before from there a strong year-end rally starts that tops out at the beginning of the succeeding year.
http://www.seasonalcharts.com/zyklen_wahl_dowjones4j.html
The important GUNNER24 Double Arc Resistances in the daily + weekly + monthly time frames are also pointing to the now beginning topping process. That’s why we’re now preparing for a short-engagement in the S&P 500:
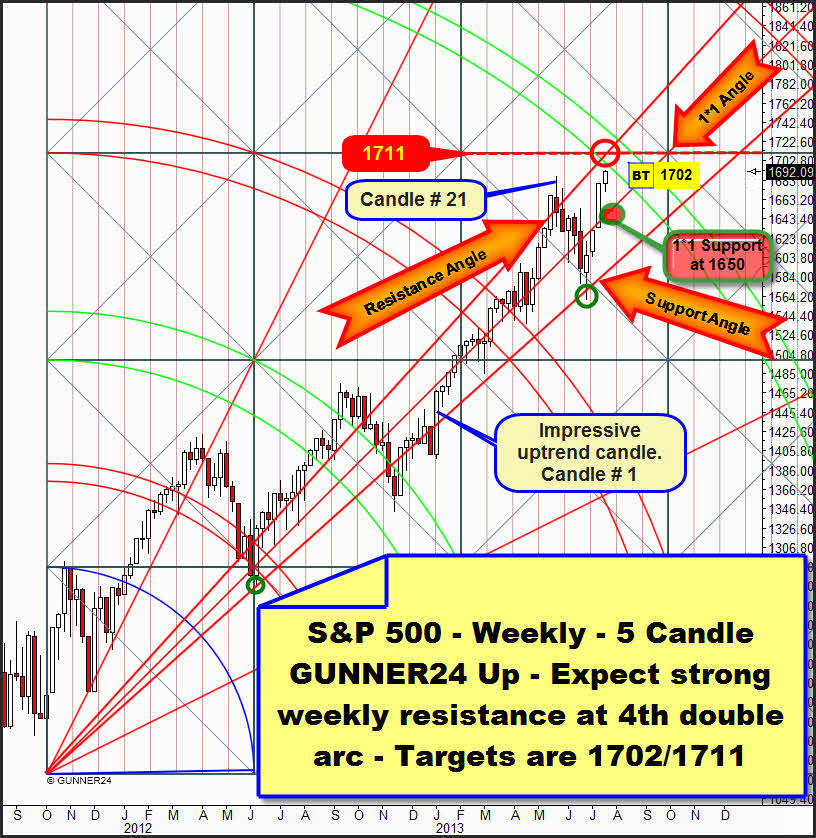
The weekly chart is approaching the resistance of the 4th double arc now. By reaching the 4th double arc some short-trades will suggest themselves. The 4th double arc is a natural resistance, so technically the market won’t be able to turn before reaching or at least touching the 4th. For next week the lower line of the 4th is passing at 1693 index points which is the current all-time high. An important horizontal resistance within the lines of the 4th is the 1711. For the beginning of August the upper line of the 4th is passing at 1722 – a possible final year-high in terms of time, see Dow Jones seasonals.
Since the market will open tomorrow near 1693 index points, the resistance of the 4th double arc is reached. The topping process begins tomorrow. "When price meets time, a change is imminent", W. D. Gann. Thus, at 1693/1702/1711 or 1722 is where the possible turns starts. 1693 is the least likely point of change. 1702-1711 is the area where I expect the top of this swing to happen.
The fine-tuning is taken over for us by the 13 Candle GUNNER24 Up Setup in the daily time frame:
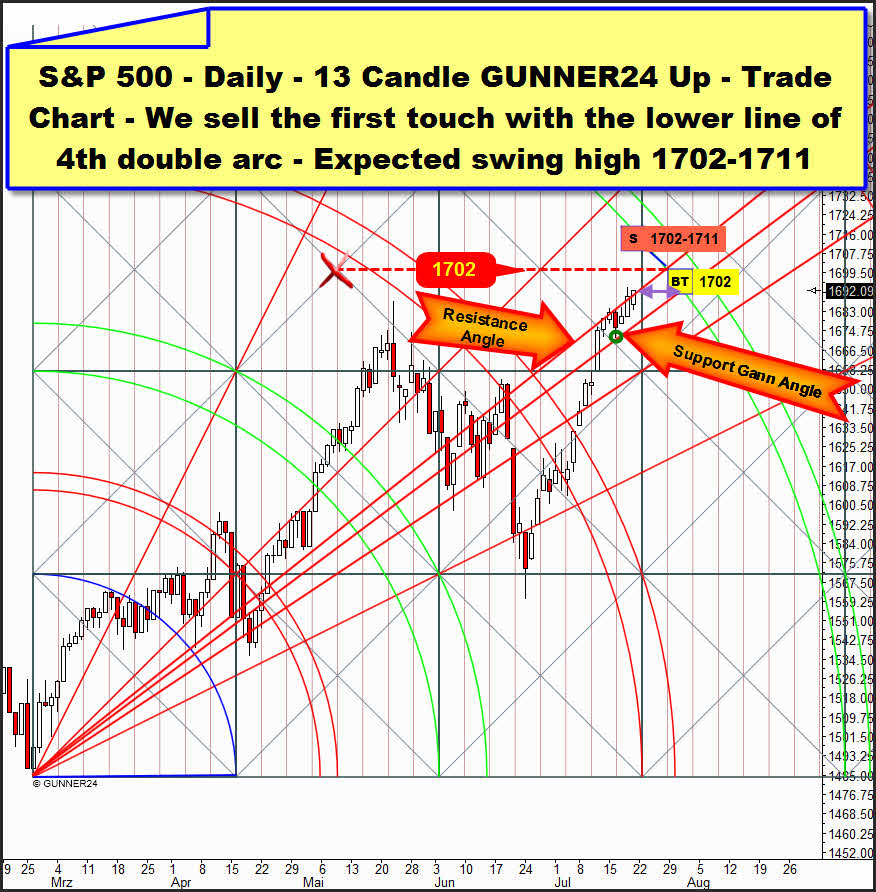
Since the re-conquest of the support Gann Angle on Thursday before last the market has been striving upwards in a strictly defined Gann Angle corridor. Above the Resistance Angle is limiting the corridor, and from underneath the support Gann Angle is backing. The hoped-for setback to 1648 index points we had intended to use for a long-entry – see GUNNER24 Forecast of last Sunday – failed to appear. It just sufficed for a successful test of the currently most important Support Gann Angle.
It’s a sign of strength that last week a more profound correction stayed out in spite of the clearly over-bought indicator situation. Another signal of strength is the performance at the Resistance Angle. The last days tried to take that one upwards. The last two daily closings are even a little bit above the Resistance Angle. Such an inner strength is genereally only to be made out within a Wave 3 or Wave 5 (the final wave of a swing)… Please count off roughly the wave structure in the daily chart above, and you’ll realize that the market can only be situated in the final Wave 5 now…
All in all the S&P 500 is marching straightly up to the next higher natural resistance on daily base now – the 4th double arc. The swing can’t come to an end finally turning the market before that point. This cognition is giving us clues to the timing, i.e. we spot when the top can be reached. At the moment the market is still 7-8 trading days away from the 4th double arc on the time axis. Mind the purple double arrow. The 8th trading day from now on will be July 31. The weak period in the post-election years uses to start on August 1st!
If the market consolidates on its actual level during the next 8 trading days, the price would meet its most important resistance on July 31 – purple double arrow. The next FOMC meeting will take place on July 30 and 31! It’s a willingly accepted occasion for tops and turns!
But if the price keeps on rising – as expected – it will meet its most important natural resistance sooner. The S&P 500 is likely to meet the 4th double arc as early as next week - somewhere between 1702 and 1711 index points. This first touch with the 4th double arc will be sold by us – daily position, no SL for the moment, first target 1620. This order will be valid till 07/31/2013.
As usual, in the free area you may re-enact our trades here, always topically:
http://www.gunner24.com/trading-performance-us-stock-markets/
Gold: Just a brief glance to gold – No change of the analysis assessment!
After the thoroughly phenomenal rise of the gold price we saw the week before last, last week passed rather boring. The gold future rose narrowly by 1% in the weekly comparison.
Therefore I didn’t go to the trouble of actualizing the weekly setup of last week. The analysis of last week continues valid: Gold may rise next week up to the area of 1344-1347 before it will be likely to fall from there through the middle of August:
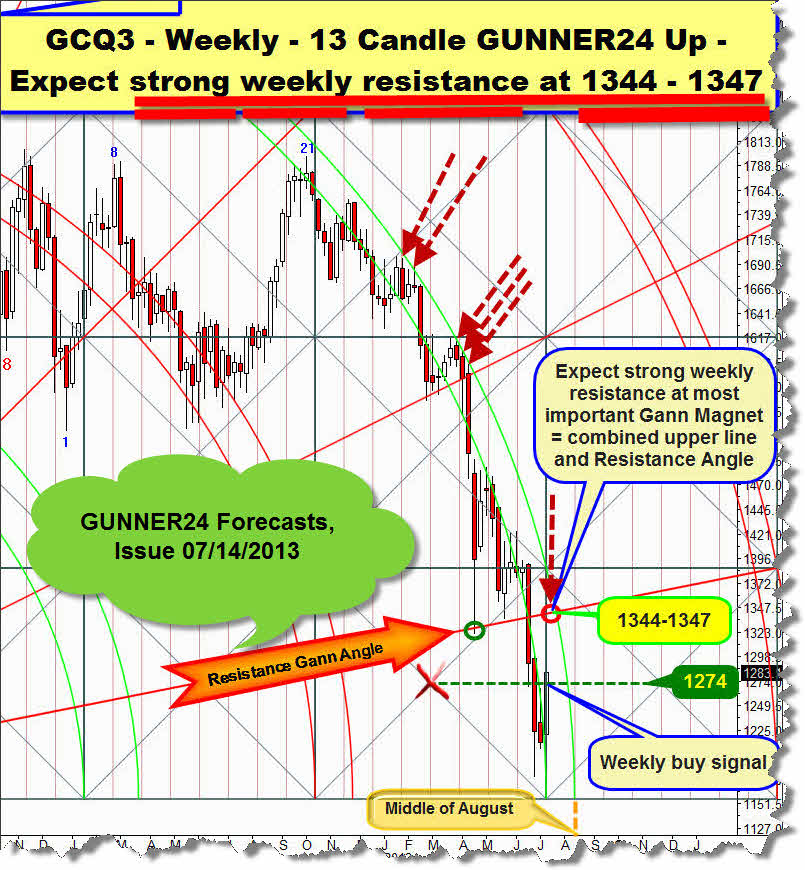
Accordingly some new correction lows at 1172/1140/1122 will keep on being expected till the middle of August. This judgment may only change if gold succeeds in closing significantly above its next higher natural resistance - the upper line of the 4th in the weekly 13 Candle GUNNER24 Up.
By and large both possible targets for this countertrend swing (1345/1330) were newly confirmed by the behaviour of the last 5 trading days. The actually valid daily 3 Candle GUNNER24 Up is presenting itself this way now:
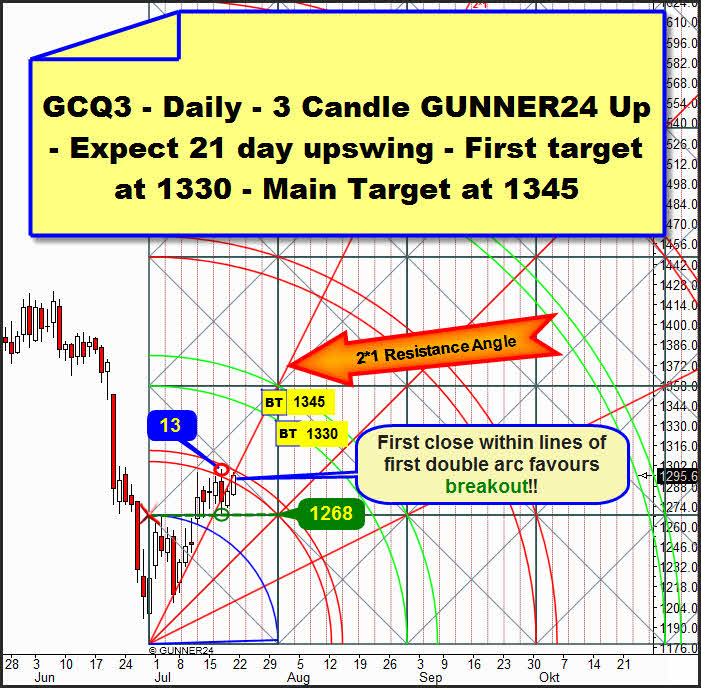
Gold moved in a pretty narrow trading range during the last 7 days. Above it is limited by the resistance of the first double arc, and below supported by the upper line of the first square (1268). After gold topped at the 13th day of the upswing at 1299.70 last Wednesday it retraced rapidly down to the 1268-1272 support area – red and green circles. From the Wednesday low on it has been rising again. Let’s remember this: The 1272 is an important monthly mark, the monthly support confirmed now. See here:
The 1272 were first re-conquered and last Wednesday successfully tested. Now the 1272 is a strong monthly support for July. Two things can be derived from that: First, a daily close below the 1272 (about 1266) should be a powerful sell signal. And secondly: Even though the countertrend swing topped at the 13th day there’s the great chance that this swing is going to keep up 21 days since the 1272 were defended well. I.e. the next important top of this swing is still due!
The Friday close within the lines of the first double arc reaffirms this hypothesis. Closings within the lines of a double arc in a setup mostly prepare the final break of this double arc! The overcoming of this resistance is never confirmed before the final break of a double arc on closing base. I.e. in this case at a daily close above 1302! If for instance gold closes above the 1302 on Monday or Tuesday the 2nd double arc will be finally activated as the next target in trend direction. First target will be 1330, main target 1345. The probability of those uptargets to be reached subsequently is over a 75%.
The probability of the 1345 to be reached in case of a daily close above 1302 is near a 90% in my opinion!
The gold market has been consolidating its last up-move for as many as 6-7 trading days at the highs. It’s a strong consolidation formation with a narrow range. A considerable breakout potential is building up there = energy!!
In these whipsaw markets of the last weeks that might confuse any trader thus leading mercilessly to burning the trading account the professional signals have got their special importance. You get them in the GUNNER24 Gold Trader!
You best register with our GUNNER24 Gold Trader now. That’s where we oversee the optimal entries and exits for you. Especially in the difficult market situations where many factors have to be considered the Gold Trader is backed by the additional GUNNER24 Signals based on the combined 1, 4 and 8 hour setups to catch the optimum entries and exits.
|

The GUNNER24 Gold Trader will provide you with the critical knowledge you need to forecast and analyse the precious metals with the GUNNER24 Forecasting Method. All the GUNNER24 Trading Signals you receive real-time are based on the actual Gold and Silver Future. The NEW GUNNER24 Gold Trader is a must for every actively working investor and trader who wants to trade successfully in everyday trading. The insights you receive from the head trader Eduard Altmann (and discoverer of the GUNNER24 Forecasting Method) are truly amazing sometimes. I promise!
Click the button below and order the GUNNER24 Gold Trader - $39.90 US a month. For 201 members and up - $49.90 US a month.
 |
Be prepared!
Eduard Altmann