
The stock markets formed a perfect GUNNER24 Initial Impulse
Starting point of the initial impulse was the low of 07/06, and the Thursday high marked its end. Its perfection is because the vector of the blue arc is formed from the low until the highs of the candles 6, 7 and 8. The three upper limiting points show that here we are dealing with an initial impulse that shall define the turning points and targets to come for the next weeks and months in a nearly ideal way.
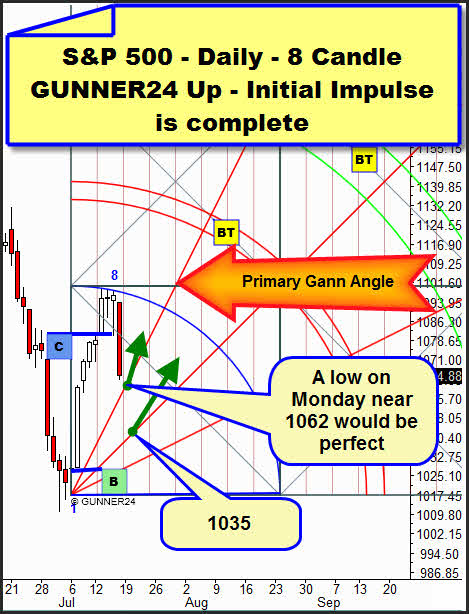
Last week's trading plan worked almost optimally. Really, for Monday we had expected a retracement (5 candle initial impulse), and in case of reaching the previous day low we would have covered our long positions. That's what we had not to do before Thursday opening when the Tuesday low was reached. With the violent Friday sell off we have almost reached the point again where we may dare a new long entry per Gann Angle Retracement. (2*1).
As early as Monday we'll see how strong the new rally really is. Friday performance already showd us that it doesn't seem to be optimum. It is consolidating/retracing much more than a normal healthy rally uses to do. Since on retracement it quickly falls back onto one of the important Gann Angles (2*1). A really optimal rally would form a bullish pennant below or at the blue arc, you see... On Monday, we'll see whether there is a rebound from the 2*1 Gann Angle and if so, how strong it will be. Anyway, a long at 1062-1058 will be lucrative in day trading. All the same: If the price next week remains firm above the 2*1 working its way up to the blue arc or even reaching or breaking the upper line of the first square respectively we will still be able to call it a strong rally. In case the first square or the blue arc breaks we'll go long. Though a relapse to the 1*1 or even to the 1*2 Gann Angle in the further course of the week would be normal. Please work with the Gann Angle Retracement for your long entry (rule 18.3 to 18.5).
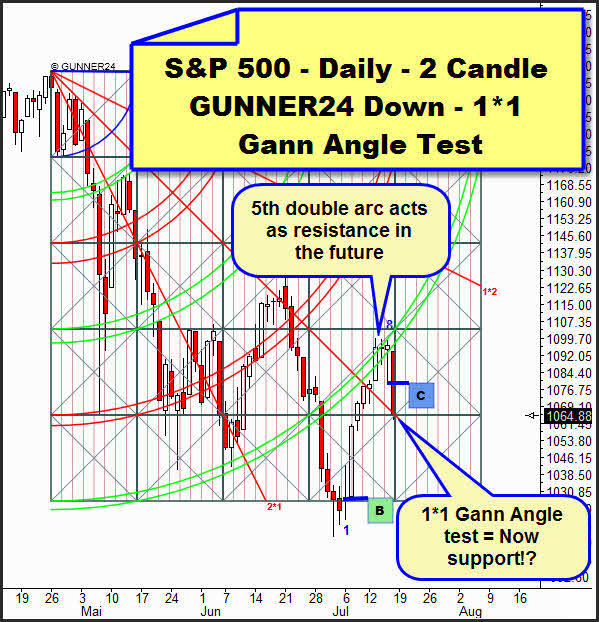
Please pay attention to all the forecasts of the last issue where we showed all the important resistances on monthly and weekly basis for the S&P 500 and its future contract. In the upper 2 Candle GUNNER24 Down Setup again we recognize well the resistances on daily basis. First the 5th double arc. Actually it should NEVER be overcome significantly, maximally the price should work its way in it or go upwards below it. It's really interesting that the 1*1 Gann Angle was tested back as early as on Friday. As I said, a low is allowed that on Monday is a little lower than it was on Friday, then the price must go up to keep the rally running. A relapse back to the bearish half of the down setup on Monday would have to be considered very negatively.
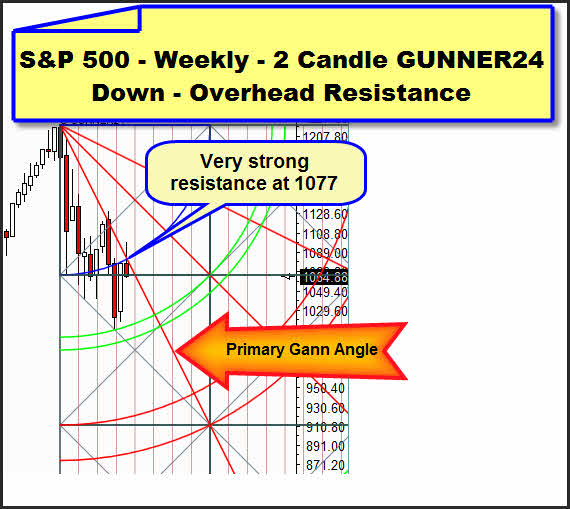
Because in that case the cross resistance at 1077 (blue arc/2*1 Gann Angle) would be too strong making possible a new test of the 07/01 low. In the upper weekly setup we recognize: It's true that the price has tried well to re-conquer the 2*1 Gann Angle and the blue arc. But it was clear that such is not easy. But maybe the lower line of the first square gives us that much support so we rise rapidly. Anyway, next week is going to be interesting because the closing price in the second passed square points to a test of the 07/01 lows, at any rate.
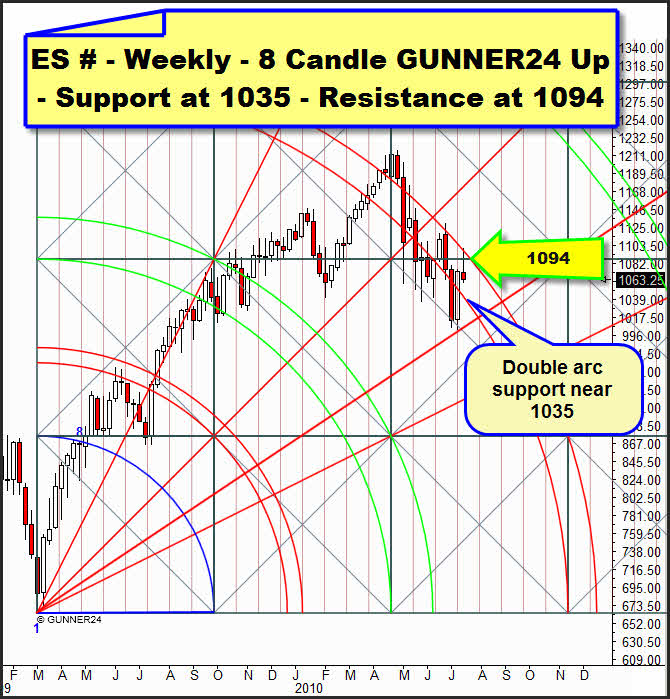
A quick glance to the actual 8 Candle GUNNER24 Setup of the S&P 500 Continuous Contract illustrates again the analysis we've done. Exactly at the upper line of the 3rd double arc the market turned downwards again. If we go on moving downwards within the 3rd double arc the 1035 will form support and the 1094 powerful resistance. If next week closes significantly above the 1094 we'll go long on weekly basis. If we see the 1035 next week we'll go long as well because that's where in the actual daily 8 Candle GUNNER24 Up the 1*1 Gann Angle is proceeding.


Talking of Gold: Have we got a Flag or a Megaphone?
Day in, day out we have to make many important decisions while trading. If we do without thinking and without the right analysis we'll loose money. With the conventional chart technique, analysis is often done on account of the prevailing chart formations, without considering yet the time factor.
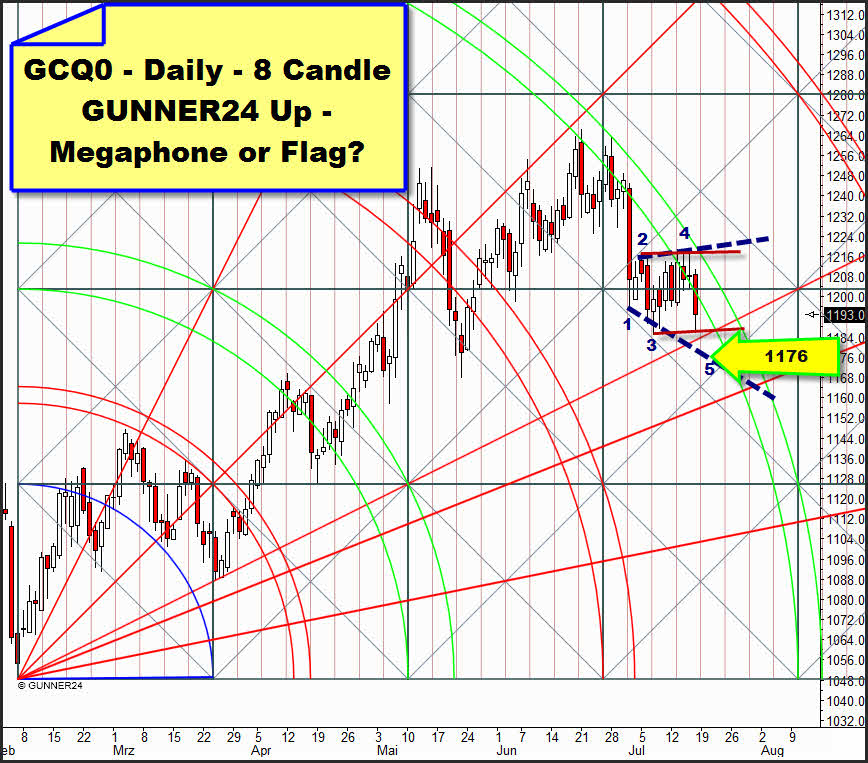
The situation: In the daily 8 Candle GUNNER24 Up Setup gold is working its way down, along the 4th double arc. Actually the 4th double arc forms a resistance that is usually much easier to overcome than the 3rd or the 5th double arc which represent the main targets for a GUNNER24 Setup, you know. But gold tends to change the trend at the 4th double arc, that is why just now the actual chart pattern is to be considered. Because, if some chart patterns are formed at or close to a double arc we will be able to link the disintegration of the chart pattern with the time.
I've got to say that I'm not quite sure about the emerging pattern. My feeling is that there's a Megaphone. I marked it with the blue dotted lines. At the Megaphone we could expect the low on Wednesday/Thursday at point 5 at about 1176. In the further course the 4th double arc shall be broken upwards which would be the next long signal. In case of a Flag it would be a bearish sign. The break of the Flag downwards has to take place with a stronger volume than the formation of the Flag did. On Friday, we had the highest volume of the recent trading days. If there is a Flag indeed gold will tank through August 9. Target 1110. That's where the temporal influence of the 4th double arc ends.
But why is such an important chart formation forming just right now?
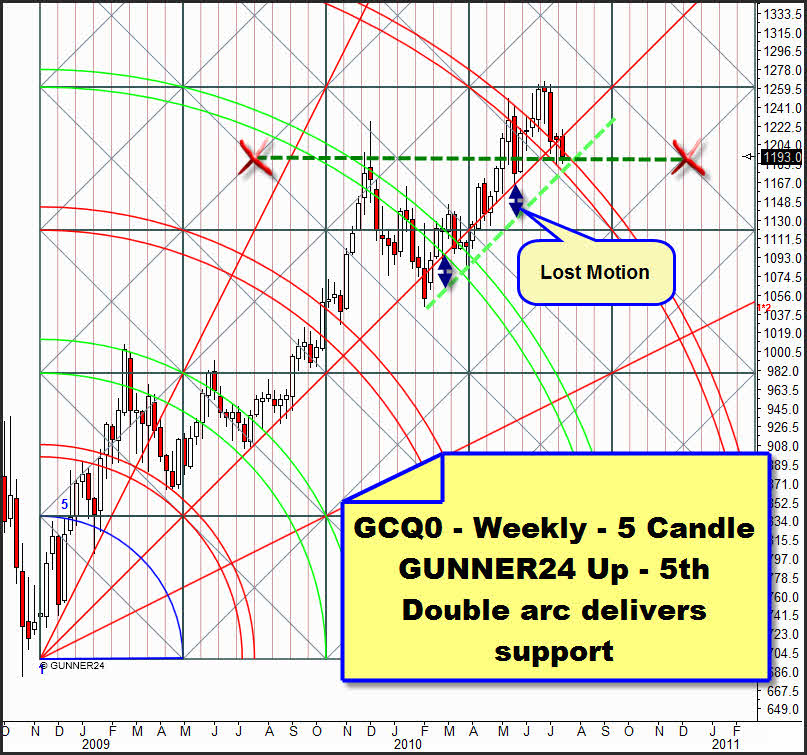
In this weekly setup – never shown before – we have overcome the 5th double arc already, and the price is testing back the 5th double arc. Together with the horizontal dotted dark green line the price is lying on a cross support, you might say. And that's the explication why gold was not able/willing to be sold off and why the Flag or the Megaphone respectively has formed. Next week is going to be interesting. The cross support will meet the light green dotted support which really should produce the price and time magnet to rev up again. That support concerns the parallel shifting of the 1*1 Gann Angle which has been tested only twice so far. That's why the test should result in a new rebound upwards next week.
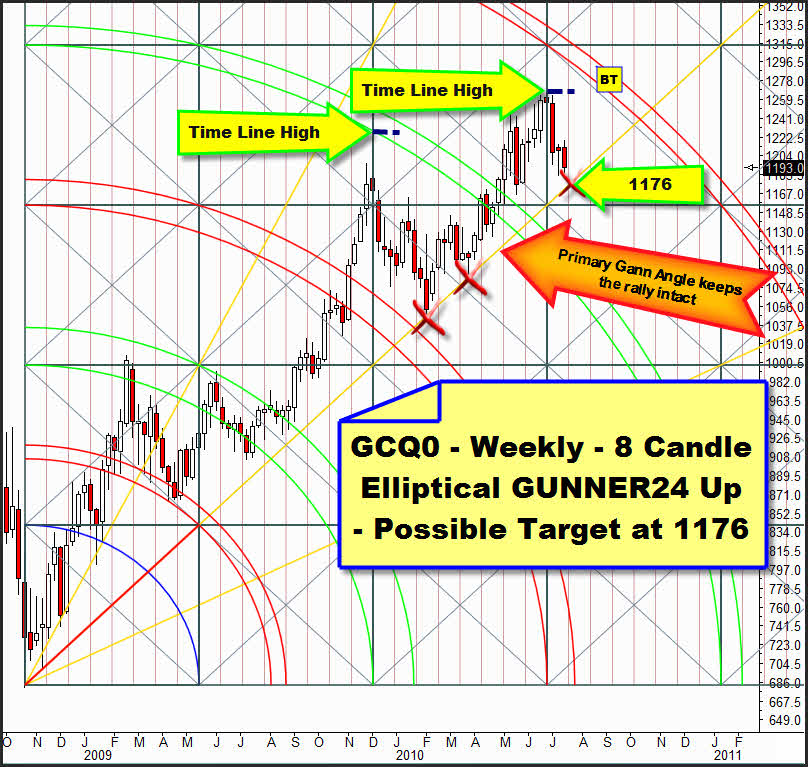
In the weekly 8 Candle Elliptical Setup the primary Gann Angle is lying at 1176. Here, too, it should resist and a rise should follow since it will only be the third test.
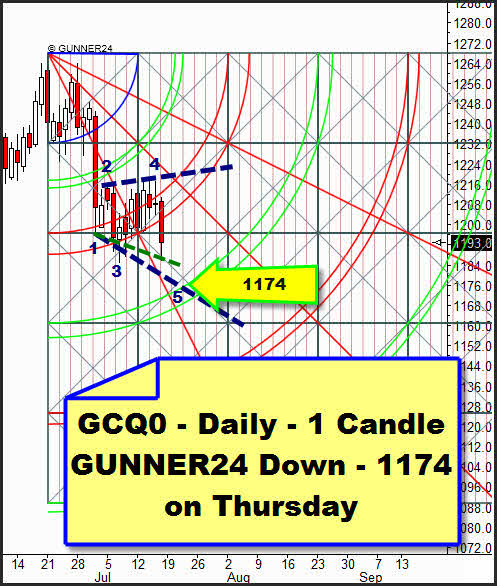
In the actual 1 Candle GUNNER24 Down Setup on daily basis on Friday gold broke the second double arc significantly. Target now is the 3rd double arc. That is the main target for the down move. If the 3rd double arc breaks – depending on the price performance - the 1110 will be possible. (Disintegration of the Flag scenario downwards). If the Megaphone proves to be true the price would have to creep down during the next days until on Thursday the 1174 will be reached and at the 3rd double arc a violent rebound should take place. There's a third alternative: By Friday point 5 of the Megaphone was reached already. In the upper setup, I drew that with the finer green dotted line. A long entry will be on the agenda in case of the break of the last high (point 4).
Be prepared!
Eduard Altmann
