
Some important month supports have been reached - all the stock markets are mature for a new rally
As prognosticated in the GUNNER24 Forecasts, Issue 04/25/2010 in May the US stock markets began their correction of the upwards trend. Furthermore, the GUNNER24 Forecasting Method prognosticated falling prices through July 2010 (GUNNER24 Forecasts, Issue 05/30/2010) which should undercut the May 2010 lows. Even though July is still very young, during the first two trading days of July the stock markets right down the line reached some important supports in the monthly GUNNER24 Up Setups thus being prepared for the first leg of the year end rally that should take us to some new year highs in December 2010.
In this issue of the GUNNER24 Forecasts, I would like to concentrate on the question how the actual lows are to be assessed, whether or not they resist or how deep they can extend without endangering the general upwards trend, respectively.
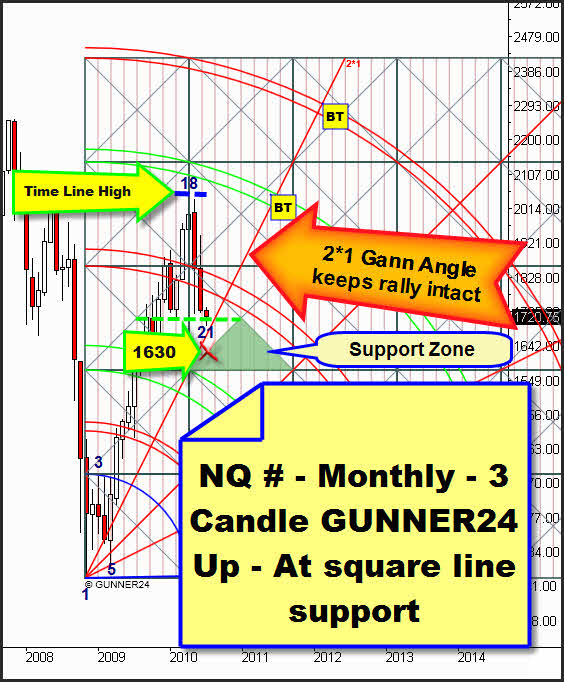
In the upper 3 Candle GUNNER24 Up Setup of the NASDAQ-100 Continuous Contract we recognize that the April 2010 high was marked exactly on an important time line, but the 4th double arc being an important buy target has not been reached yet. By June the 3rd double arc was pushed through. Such a conduct normally means a significant sell signal on monthly basis but it is just preparing the necessary test of the 2*1 Gann Angle where the stock markets will have to rebound from in order to assure a definite resume of the upwards trend. I'm unable to say now whether the 2*1 Gann Angle is going to be reached now in July or not before August. For July, that Gann Angle is at 1683. A possible sell off should have to rebound from the 2*1 Gann Angle, but not after the 1630 being the strong support zone. July 2010 is the 21st month of the upwards trend. A significant low is really offering itself due to the candle count.
But why are the lows likely to have passed already? Please, pay attention to the green support horizontal marked dotted in the setup which is lying in the middle of the just passed square actually being to offer strong support to the price.
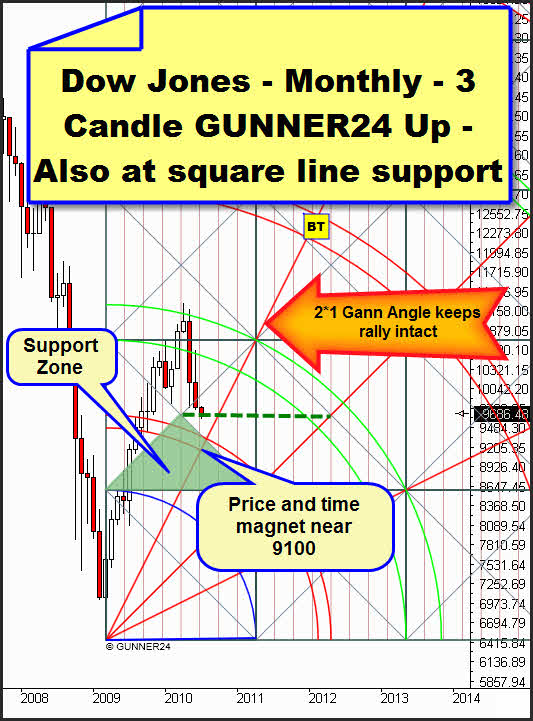
It's interesting to see the Dow Jones in its equivalent monthly GUNNER24 Up Setup parking on that horizontal square line, as well. If that support horizontal breaks the significant price and time magnet will be at 9100 in July.
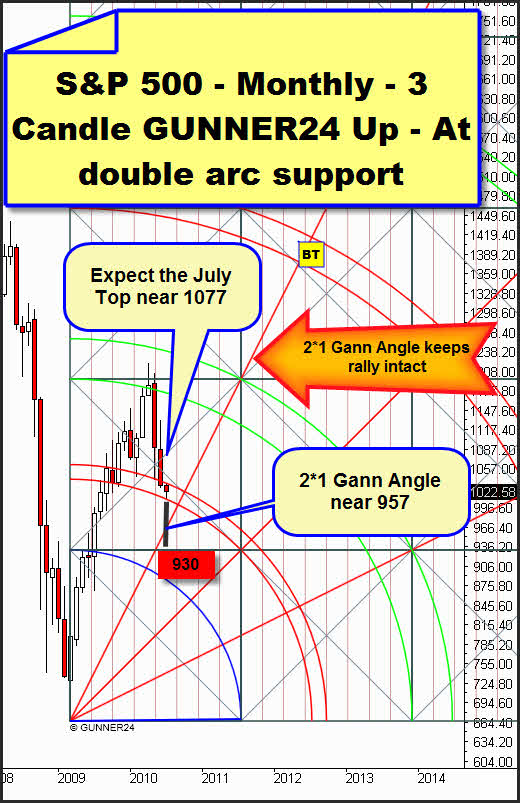
In case of the S&P 500 the GUNNER24 Up Setup is looking a little different, and we recognize the importance of the first double arc for that market. In the past, the upper lines s well as the lower ones have given important supports or resistances, respectively. July 2010 is being locked up between both lines. Correspondingly, as early as for next week, a landmark breakout signal can be deduced. It will be up, probably.
Because:
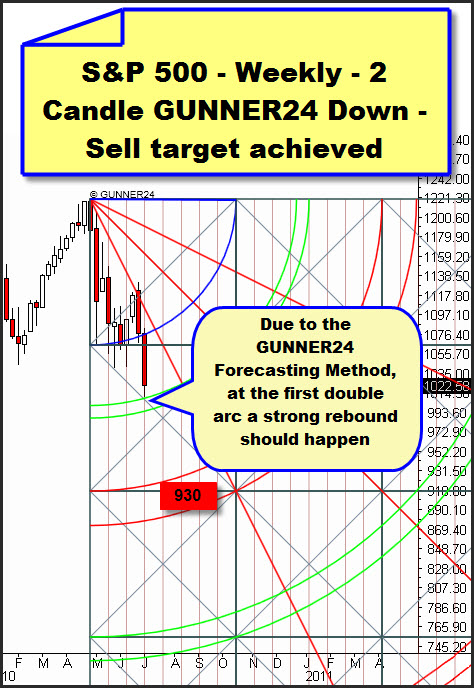
...in our actual weekly 2 Candle GUNNER24 Down Setup the sell target was reached that had been prognosticated for a pretty long time and frequently. 1010. Exactly on the time line, exactly on a price and time magnet, the week low was marked. It cannot be better. We should have/be to turn upwards now. The next week candle ought to confirm that. One thing is for sure: If we break the first double arc downwards next week on the agenda will be shorts.
In each of the three stock markets we will have to wait for a daily reversal candle. Then, we will look for the long entry on daily basis. The Thursday low will be the SL. Pay attention to the reverse and double techniques.

Going with the situation in the stock markets, gold is presenting itself. Either it is going to turn next trading week or an extensive sell is going to happen. As well in the stock markets as in gold the important supports and possibly other targets for further lows are to be made out well!
To describe the situation of gold I'd like to go through two scenarios. I give each of both a probability rate of a fifty percent!!
Scenario I – Gold turns next week:
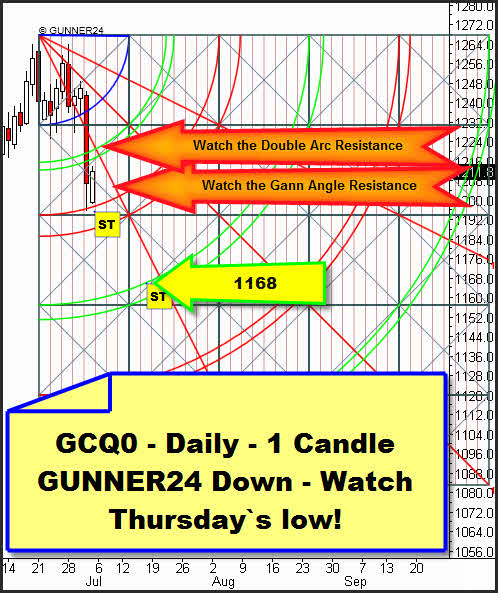
This 1 Candle GUNNER24 Down Setup is going with it. At 07/01 the important 1*1 Gann Angle we had mentioned in the last issue being within the Candle GUNNER24 Up Setup broke. Thursday was a violent down day bringing us losses on daily basis. On weekly basis we were stopped out as well at 1225. That brought us a little profit. Looking at the 1 Candle GUNNER24 Down we ascertain that the maximum sell target was reached as early as Thursday to make sure the daily upwards trend was not threatened. The 2nd double arc is the last saving anchor that points to a fast resume of the original trend if it resists. However, the Thursday candle for itself offers a dangerous and not very frequent triple sell signal. First, break of the blue arc. Second break of the first square and third, break of the first double arc. If the 2nd double arc breaks the next down target will be 1168. First positive signs of the upwards trend to resume would be to overcome both resistances marked in the setup.
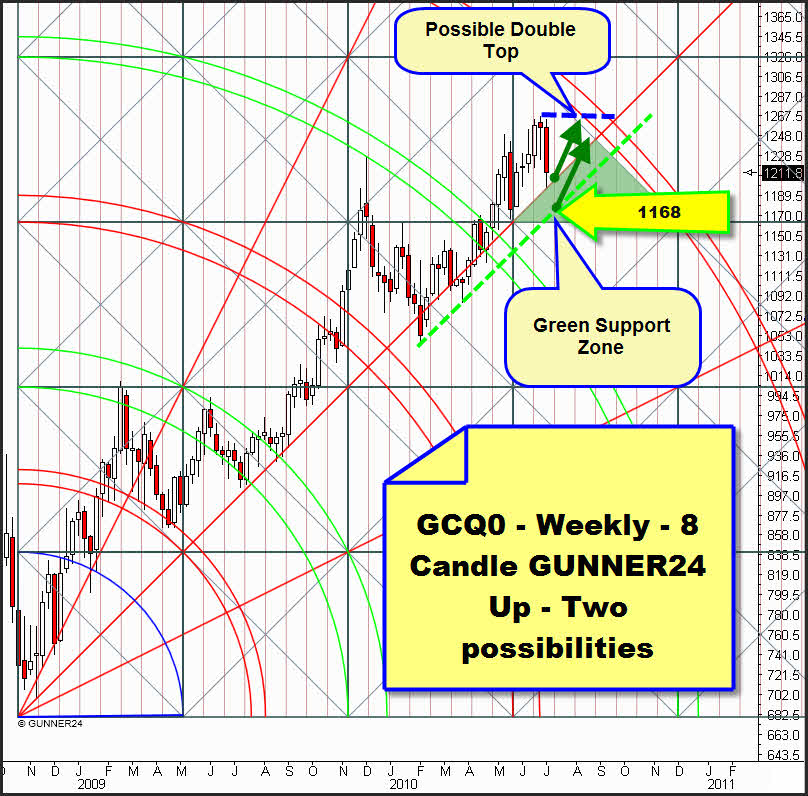
As early as next week, gold may turn upwards again because in the weekly setup above last week rebounded from the very important 1*1 Gann Angle repeatedly. For almost two years, that angle has been determining price and time of the upwards trend. It is strong and powerful. Also gold is ranking above the support area that theoretically offers strong support.
Scenario II – Gold continues falling at short term:
However, shifting the Gann Angle a little bit parallel down (green dotted angle) we will see that the 1168 low of the daily setup also in the weekly time frame seems to be possible being a logical target. That parallel shifting represents the lost motion which the gold upwards trend has got.
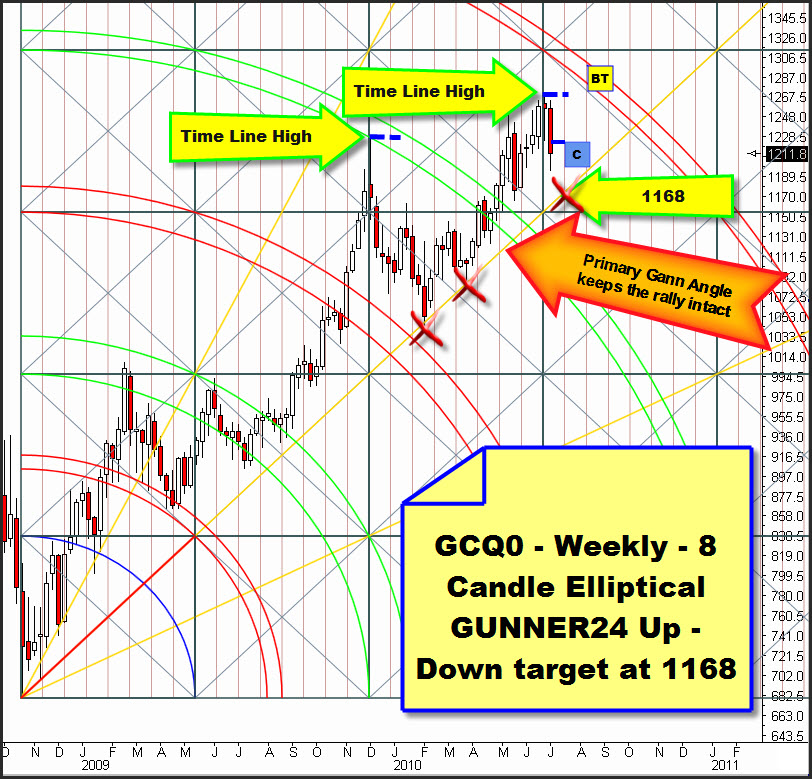
Looking now at the corresponding elliptical setup we discover otherwise that the high of the week before last is lying on the important time line as well as the high of December 2009 and that a return onto the Primary Gann Angle seems to be logical. The week after next is offering itself for that. That would be the third test of that Gann Angle. A violent rebound from it should follow because the main target which is the 5th double arc has not been reached yet.
Conclusion: Successful trading includes analysis, rules, the courage to make decisions and the assessment of probabilities. All the markets presented in this edition are sitting on important supports. That's no coincidence. Supports like those either break or resist. If we combine all those signals in the four analysed markets recording for ourselves that the markets are very likely to turn upwards again all we have got to do is comply with the rules.
In case of the NASDAQ-100, the Dow Jones, the S&P 500 and also the gold, that means next week we are going to wait for a daily reversal candle which might give us the sign for a long entry of several weeks. The lows of 07/01 are the SL. Please work with the reverse and double techniques. If the lows of 07/01 are fallen short of next week in day trading we will keep on being adapted to short until the important 2*1 Gann Angles in the monthly GUNNER24 Setups on the stock markets will be reached or on gold the 1168, respectively. I.e. we will sell any rally in the 4 and 8 hour time frames.
Be prepared!
Eduard Altmann