
Taking the seasonals into account DAX/FDAX is poised for seriously lower. Even is in real danger now, I suppose.
DAX/FDAX has a very secured history of delivering important seasonal highs in the course of April to May,
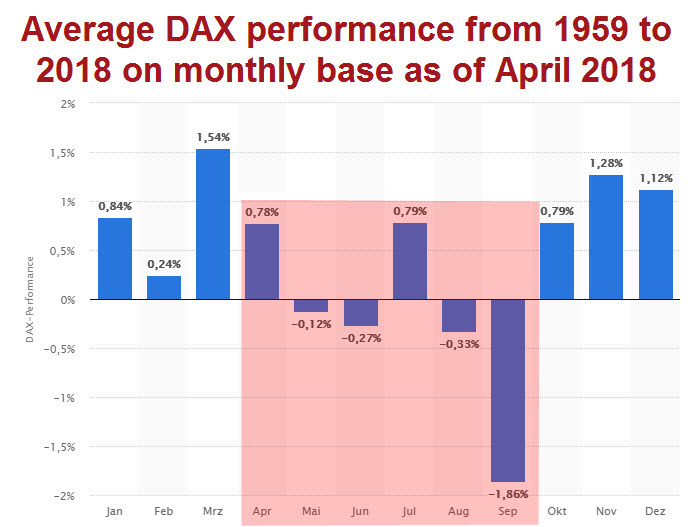
only to plunge thereafter ALWAYS!! into September/October.
Source: https://de.statista.com/statistik/daten/studie/248717/umfrage/durchschnittliche-performance-des-dax-auf-monatsbasis/
The above statistic of the last 60 years is trivializing somehow what could come to investors over the next few months.
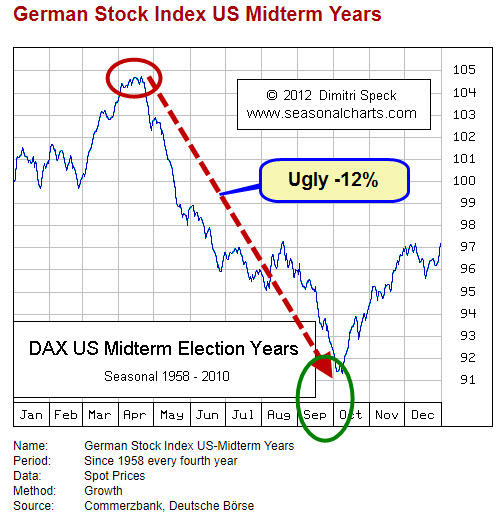
Source: www.seasonalcharts.com/zyklen_wahl_dax_midterm.html
Since in US midterm election years, this market tends to decline by an AVARAGE of around -12% from April to September.
Well, for the coming months until September, a -10% correction can be expected. At least that`s what the GUNNER24 predicts!
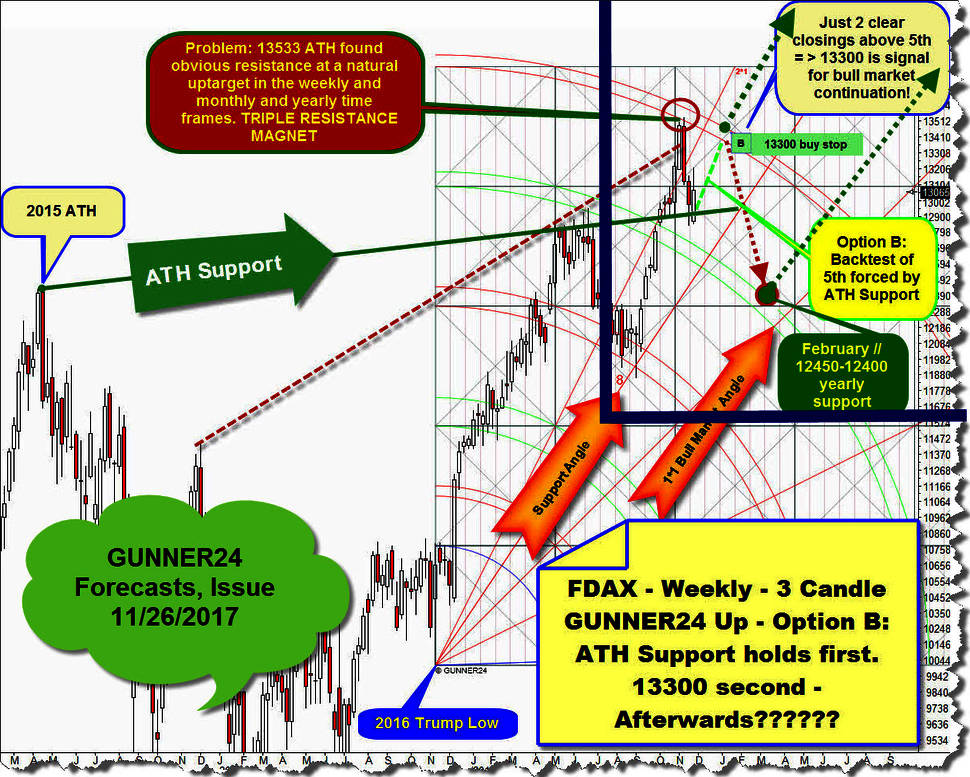
Like always, for my DAX analysis, I refer to charts of the DAX future contract FDAX. For the very first time, I have explained the composition of the currently most pioneering setup which is weekly 3 Candle up out of 2016 Trump Low above in the FDAX forecast of September 24, 2017 "Soon there are new FDAX highs - January 2018 target is 13500".
Last we used this eye opener in November "Europe, I recognize a problem. A DAX Problem" for the possible future development of the market. At that time - see above - there was a high probability that the FDAX had to backtest its existing falling weekly 5th double arc alltime-high (ATH) resistance environment in course of January 2018 only to correct deeply into February and a yearly support existing between 12450 and 12400.
And that`s about how it happened:
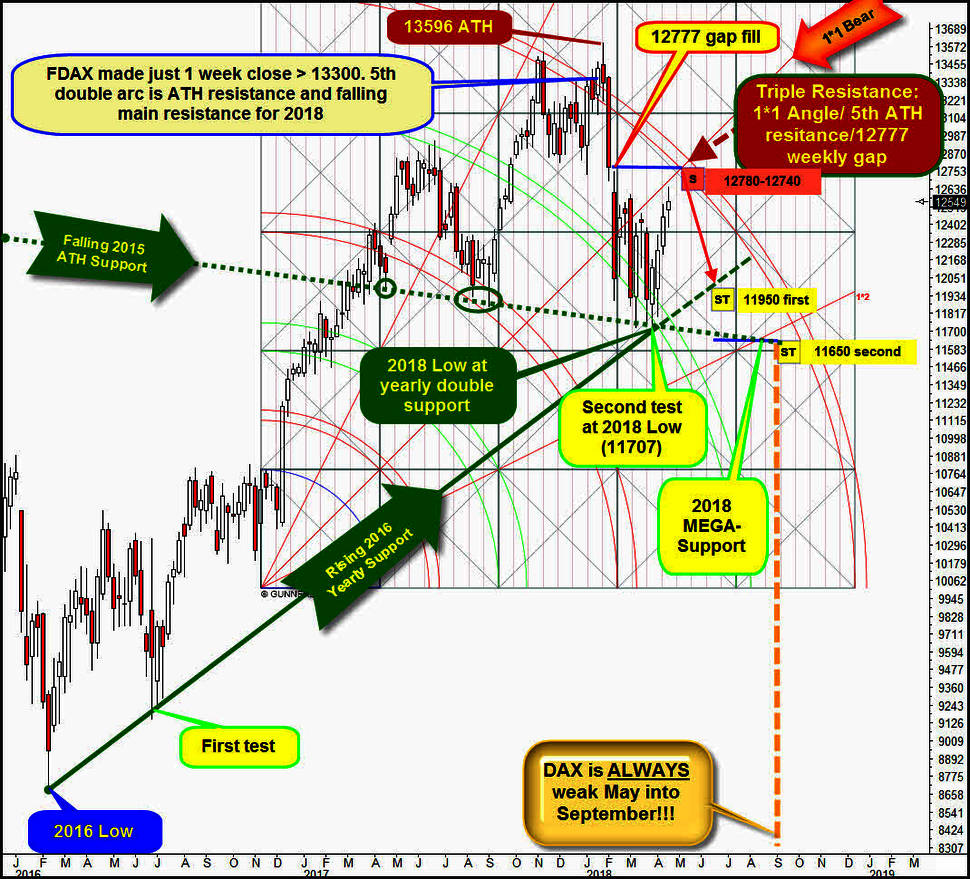
In January, it was again possible to reach a small higher ATH which is at 13596. Thus, GUNNER24 Price/Time forecast = important bull market highs at 13500 in course of January 2018 is worked off.
However, the necessary bull market continuation signal could not be fired, as the index on the weekly closing base did not manage to close twice above the 13300 Maginot Line. Thus, at the late January/early February highs, a false break of the 5th double arc took place. Thus, the 5th double arc is now double confirmed or double negative tested ATH resistance double arc, so most important falling resistance environment for the year 2018. Just end of 2018, the 5th double arc influence is phasing out according the time.
Accordingly, it might be that the falling 5th ATH resistance double arc will deliver falling DAX/FDAX main resistance into end of 2018. Whereby the market could never close significantly above the 5th ATH threshold (weekly base) and could thus follow its downwards oriented course.
So, the next really important bull market continuation signal is very easy to identify:
==> the first two consecutive weekly closings above the upper line of 5th. No matter when this series occurs.
At January 2018 ATH, the previously anticipated correction began which should test some yearly supports at 12500-12400 in course of February. Namely the falling 4th double arc main support. Since this support area was violated, wounded and undershot with the February lows the FDAX triggered a sell signal according time which extended the correction into end of March. In terms of price, the cycle from the absolute February to the final March low barely made a progress cause the 4th double arc radiated strong support energy at large.
Finally, the current correction low was cemented on 03/26 at 11707pts, there 3!! existing yearly supports matched on that day and week.
March correction low at 11707 arrived at Falling 2015 ATH Support Line, lower line of 4th double arc and the Rising 2016 Yearly Support. A turn caused by a triple support existing in the yearly time frame is always a very serious stuff.
Thus: ==> 11707 has nice odds to be the final low of whole 2018!!
As we can see in the chart above, the FDAX has developed quite nicely since its 2018 correction low, next week candle will be the 5th week of a new upcycle which began at 2018 Low. The series of higher week lows, higher week highs and higher closings since 2018 low tells us that the market is impulsing upwards...
... and every halfway talented magnet trader now sees what may come now, should be pending into end of April or early May!
Namely the backtest of some main 2018 resistance thresholds above current quotations that there are:
A) The finally downwards broken 1*1 Angle out of 2016 Trump Low. This is nearest strongest upmagnet resistance, a rising resistance in the yearly time frame, for the next candle at "round" 12700-12705 Gann number resistance. Within GUNNER24 Up Setups the finally downwards broken 1*1 Angles are often most natural backtest targets before the recent main trend wants to resume which is down in this current case.
==> 1*1 is usually very strong natural resistance actually and the very first backtest of the 1*1 could mean the final high of the weekly upcycle which began at 2018 Low! Thus, FDAX could reach 12700 in course of next week just to print important April top there only then to immerse into the regular weak period of May to September.
As long as the price within an up setup is below this 1*1 Angle, bear market rail, we have to look for nice low-risk short entries at main attraction areas and such a very low risk short exists now at the easily identifiable important = actually very powerful triple resistance upmagnet at 12777 for the very first May trading week!
There and then the A) rising 1*1 Bear Angle intersects the B) falling lower line of 5th ATH double arc resistance at C) weekly upside gap!
==> Future triple resistance magnet at 12777! We should recon with a third test of the 5th ATH resistance area and caused by the 5th/1*1 and perhaps even by the 12777 gap magnet the FDAX should make a lower correction high in the course of the next 2-3 trading weeks, resp. next 13 trading days, afterwards market should at least test back the Rising 2016 Yearly Support in course of June 2018 or early July 2018 at around 11950pts!
==> first downtarget at 11950/June 2018!
But it might be that the regular weak May to September period is able to force the market into a lower 2018 Low which could be made at 11650 surroundings and perhaps will arrive in course of August to September!
Within weekly setup above, we recognize that 1*2 Angle together with Falling 2015 ATH Support rail forms very attractive future double support at 11650 for the September trading weeks. So, 11650/September is a derivable GUNNER24 Down Magnet in the weekly!
The monthly 1*1 Bull Market Angle out of important higher 2014 Bull Market Low is also at 11650 surroundings for the late summer months. This monthly 1*1 Bull Market Angle below represents strongest W.D. Gann bull market support for 2018!
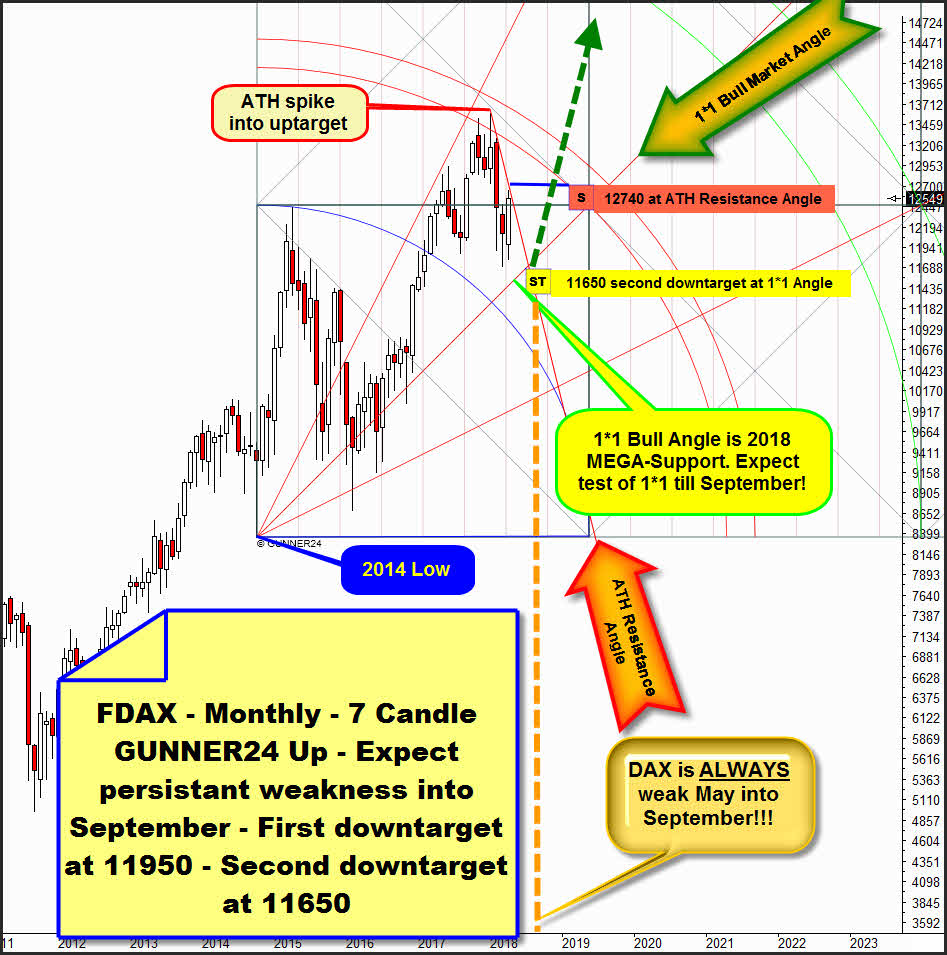
That's why he has the strongest attraction resp. magnetic effect IF the FDAX violates its 11707pts 2018 Low in course of the summer months!!
But the very fact that we can identify the 11650 both in the monthly and weekly time frame as a very important attraction price for a possible multi-month downtrend seems suspicious!
This makes the processing of the 11650 resp. of the monthly 1*1 Bull Market Angle during the regularly weak summer months very possible in my view!!
Therefore, a next monthly 1*1 Bull Market Angle backtest is second downtarget for the FDAX short attempt. The processing probability of the second downtarget until September 2018 is in my experience around 55%! A 1*1 test in course of 2018 would be a real gift for any bull and would be Gentleman`s long entry for the bull market continuation into 15000pts/2019-2020!
The processing probability of the 11950 first downtarget until September 2018 is in my experience around 85%!!
Gentleman`s short entry is between 12740 and 12780 if reached until May, 9th. Watch that February 2018 high found to the T resistance at falling monthly ATH Resistance Angle which takes course at 12740 for the April candle. 12740 is falling ATH resistance in the monthly, existing for April 2018 and consequently the April very likely will not be able to close above the 12740!
At 12740pts/April 2018 starts ATH resistance area above. Usually very strong ATH resistance area ends about 12780/early May 2018!
FDAX is expected to top and turn at 12740-12780 quadruple ATH resistance up magnet until May, 9th! Afterwards market should correct - minimum - into 11950/June 2018!
SL trigger for a short engagement starting 12740-12780 are the first two consecutive weekly closings above the weekly upper line of 5th double arc = two consecutive weekly closings above 12950 until end of May 2018!
Be prepared!
Eduard Altmann