
The Gold Miners are breaking out. New year-high at Gold Miners indexes, many leading Miners and Gold Miners EFTs. There are new 52 week highs anywhere you look. Especially the institutional investors are pulling up now those juniors, explorers and seniors that are strongest in trend and fundamentally most promising. The Canadians keep being favorites. The Australians will follow soon.
New powerful buy signals in the daily and weekly time frames are only just being generated. At the moment, both a resistance in the decade time frame and the currently most important alltime-high resistance – together a mighty resistance magnet – are being stridden upwards – indeed most successfully!!
==> Go fully into the Gold Miners again now. It’s a no-brainer, so all in!! The expected uptargets (in the short + medium terms) for the scarcely resumed rally move are to be found in today’s issue.
When it comes to analyze the Gold Miners I like best doing it by means of the HUI (NYSE Arca Gold BUGS INDEX). The last time I did so was in free GUNNER24 Forecasts of 03/20/2016. Then, I expected the Gold Miners index to correct from the 189.13pts March high down to 130-140pts to resume the up move afterwards:
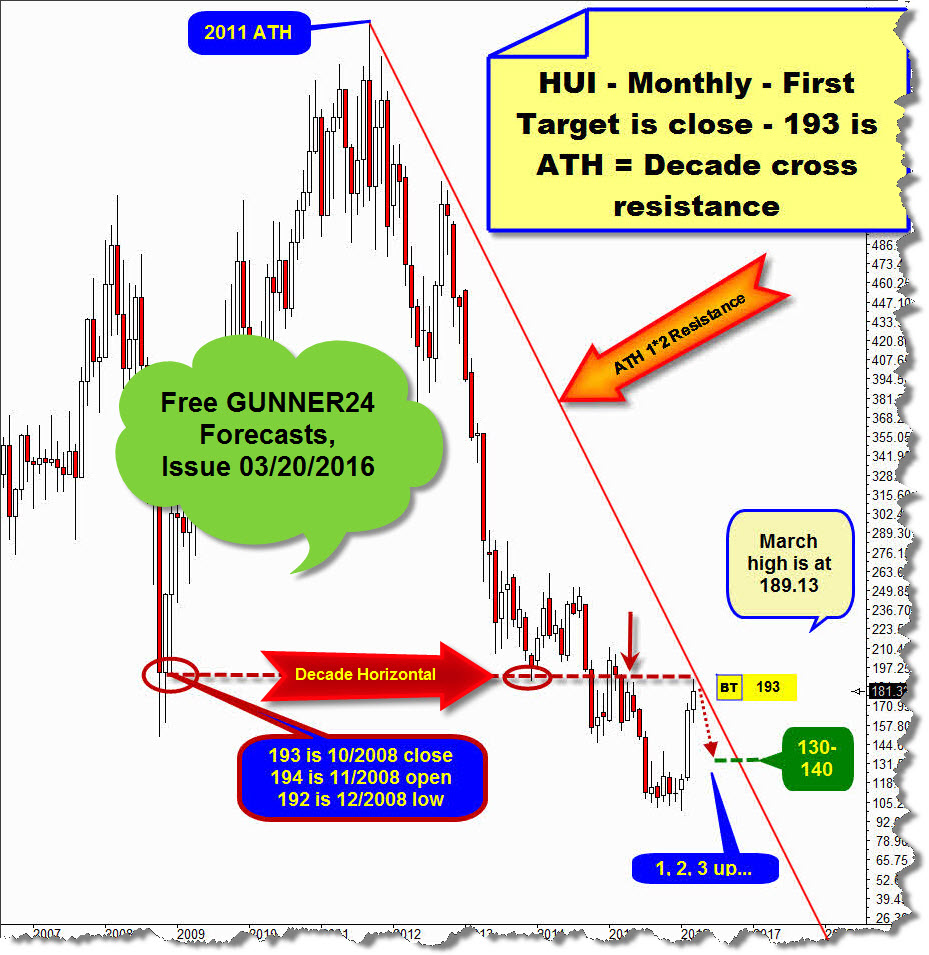
At 194-192 is where the important horizontal resistance in the decade time frame is situated for the HUI. The 193 was the very first target for the current HUI countertrend in the monthly time frame. The 1*2 Angle coming from the alltime-high (ATH) of the year 2011 is determining resistance.
For the present month of April 2016, this ATH 1*2 Resistance Angle takes its course at 188 index points, thereby just under the March 2016 high quoting at 189.13. On Friday, the HUI closed at 194.07, thus exactly at the decade resistance horizontal. The 194.07 represent a new year high and a new 52 week high. Therewith, the ATH 1*2 Resistance Angle is clearly overcome on weekly closing base!
==> This means a next powerful buy signal in the monthly time frame, because an ATH resistance was taken out.
The current buy signal in the daily time frame activated 217 index points as next important uptarget for the HUI. Parallel, the weekly time frame triggered likewise 217 index points as new important uptarget. So, the just newly generated combined – daily+weekly+monthly buy signal is indicating that the horizontal decade resistance at 193 will be overcome. Soon… and certainly without further ado… Being overcome all these resistances WILL! Release a mighty upwards thrust that is powerful, tough, pitiless. The 217 should have to be reached within 3 weeks at most:
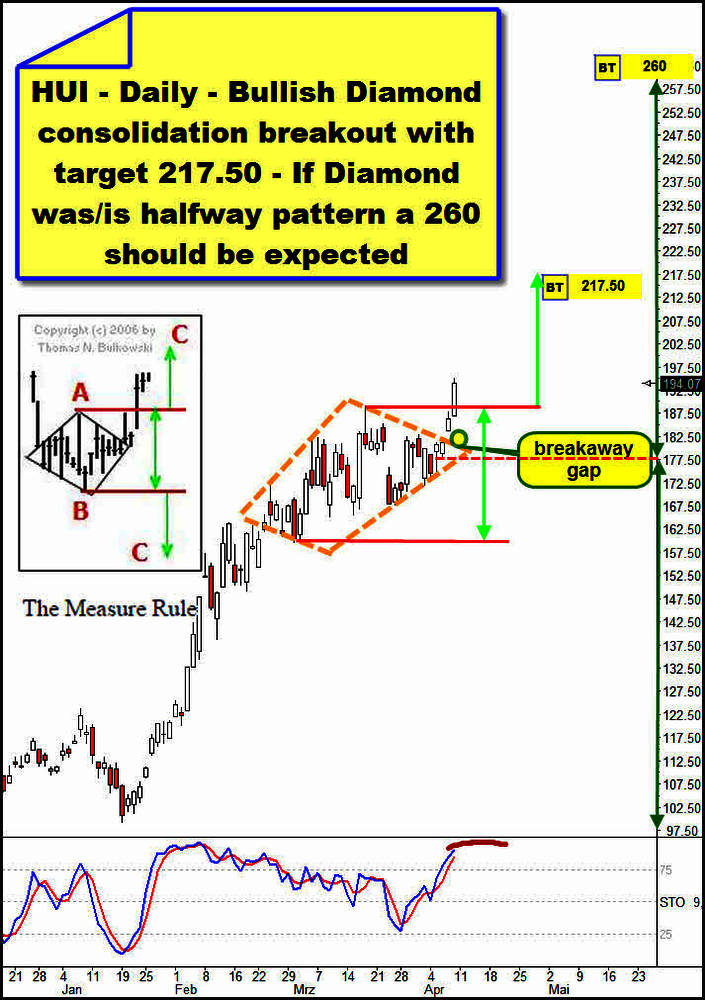
Instead of correcting lower, to 140-130 in April, the HUI shaped a diamond consolidation pattern at thr rally highs.
On Thursday, the diamond consolidation was dissolved upwards in a bullish way. Since Thursday shows an opening gap that showed above the diamond resistance trail this gap is most likely matter of a so-called breakaway gap. On Friday, a very likely successful diamond breakout seems to be confiremd with the new year 2016 high. Breakaway gap + new high for 2016 + new 52 week high are indicating a forceful and impulsive new rally leg!
The measured rule uptarget of the diamond formation is 217.50 ===> the decade horizontal resistance at 193 will thereby be overcome sustainably during the coming days!
Diamond formations are often half-way patterns appearing in the middle of a trend. I.e. the HUI might keep on rising rather unchecked up to 260 points during 3 more month candles!
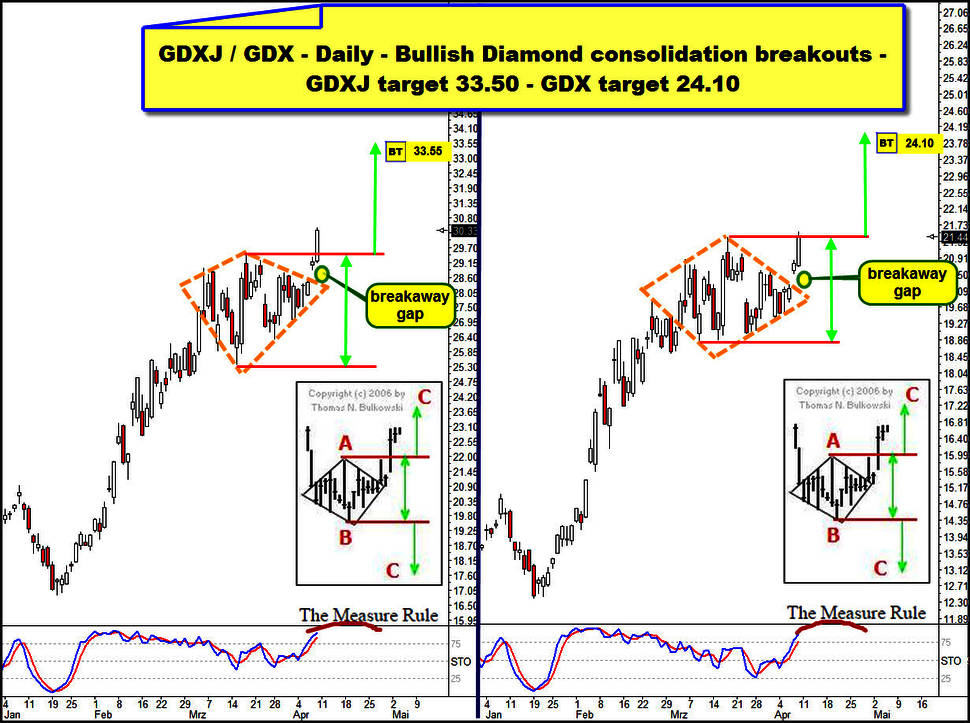
Both GDXJ ETF - the juniors - and the GDX-seniors likewise present bullish diamond consolidation patterns, dissolved upwards on Thursday, accompanied by a breakaway gap:
The measured rule uptarget of the GDXJ diamond pattern – in the chart on the left - is at 33.50$.
The measured rule uptarget of the GDX diamond – in the chart on the right – is at 24.10$.
==> Just like in the HUI, these price targets are supposed to be reached within the next 3 weeks.
Back to the HUI and the newly generated GUNNER24 Buy Signal in the weekly time frame:
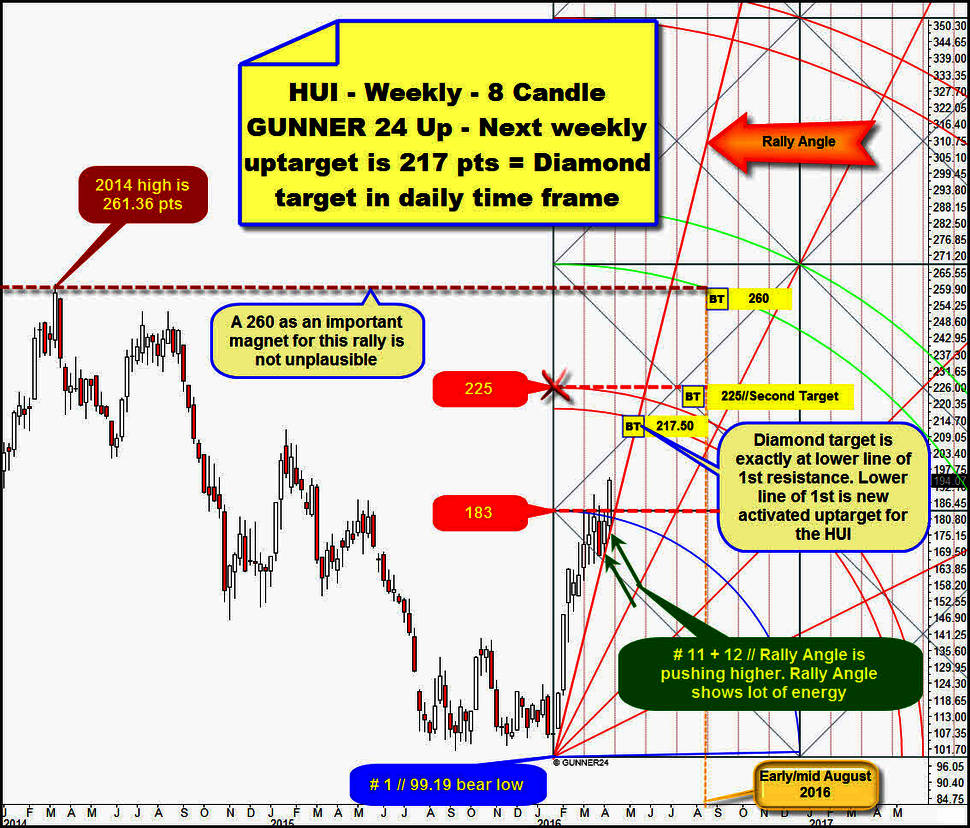
Above, you see the valid 8 Candle GUNNER24 Up Setup in the weekly time frame. This first 8 Candle up impulse beginning at the 99.19 bear-low is putting out natural horizontal resistance at the 183-first square line resistance. In the 12th week of the rally, this horizontal resistance was overcome on closing base in a mercilessly strong way. Trigger for the new upleg was the strong bounce from the Rally Angle at the lows of the 11th and 12th rally week.
Thereby, the lower line of the 1st double arc is activated as next important uptarget. It takes its course at 217 index points for the month of April, the above evaluated measured rule daily diamond uptarget.
==> We can make out a combined daily + weekly uptarget at 217! Thus, the 217 is matter of a very strong up magnet. I think the HUI will have to work it off within just a few weeks.
For the time being, it seems to me doubtful whether it may come again to a backtest of the 183 first square line – now strongest weekly support – the next days before the 217 will have been reached resp. worked off.
The Rally Angle was tested very precisely thus being very exactly defined support magnet. Thereby, each pullback in the daily time frame is supposed to end there. At the moment, the Rally Angle is the best possible = most riskless entry into short- and medium-term long-positions.
In the weekly setup above, you find a Buy-Target hint at the 225-GUNNER24 Resistance Horizontal. The 225 is the next higher uptarget (Second Target) for HUI after the 193-First Target in the monthly time frame. 225 is Second Target for den HUI, thus extremely important up magnet for the new monthly countertrend started in January 2016:
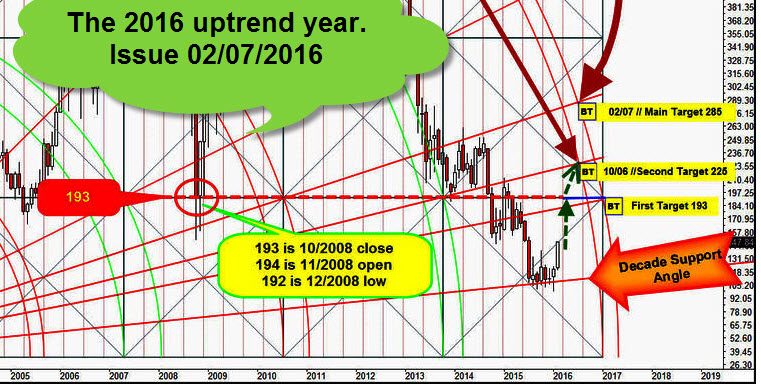
In the 02/07/2016 issue "Gold and Silver Miners - The 2016 uptrend year", the 193 were worked out as First Target, the 225 as Second Target and the 285 as possible Main Target for this countertrend on monthly base.
Since in the weekly time frame, the 8 Candle weekly up as well puts out the 225 as possible target for this countertrend, we should presume that the 217.50 will not be the end of the current up move but rather the combined weekly and monthly 225 Resistance Magnet would like to be headed for. Possibly through the end of April/beginning of May 2016!
A weekly close above 230 will finally activate then the triggered 260 diamond half-way uptarget!
In the weekly time frame, the 260 is locatable at the lower line of the 2nd double arc for the beginning of August/mid-August 2016.
260 as uptarget in the medium term makes total sense since that’s where the final high of the year 2014 is. Year high 2014 is 261.36!!! Thereby, the current rally would have to/be able to test back at least the year high 2014 and thus an important bear market high!
In these whipsaw markets of the last weeks that might confuse any trader thus leading mercilessly to burning the trading account the professional signals have got their special importance. You get them in the GUNNER24 Gold Trader!
You best register with our GUNNER24 Gold Trader now. That’s where we oversee the optimal entries and exits for you. Especially in the difficult market situations where many factors have to be considered the Gold Trader is backed by the additional GUNNER24 Signals based on the combined 1, 4 and 8 hour setups to catch the optimum entries and exits.
|

The GUNNER24 Gold Trader will provide you with the critical knowledge you need to forecast and analyse the precious metals with the GUNNER24 Forecasting Method. All the GUNNER24 Trading Signals you receive real-time are based on the actual Gold and Silver Future. The NEW GUNNER24 Gold Trader is a must for every actively working investor and trader who wants to trade successfully in everyday trading. The insights you receive from the head trader Eduard Altmann (and discoverer of the GUNNER24 Forecasting Method) are truly amazing sometimes. I promise!
Click the button below and order the GUNNER24 Gold Trader - $39.90 US a month. For 201 members and up - $49.90 US a month.
 |
Be prepared!
Eduard Altmann