From the reactions to the Cyprus farce by the most important stock markets and currencies we may – or we must derive some medium-term developments. Whereas the European markets reacted with considerable deductions partially generating the first short-signals and being now supposed to be situated primarily in their respecting correction phases – the US markets showed mixed performances, but on the whole keeping unimpressed by the newly blazing Euro crisis.
On the one hand this inner strength of the US markets being that close to their respecting tops in the face of such an important event – Europe is virtually torn up after all, as far as the tensions between the single countries and politicians are concerned – confirms that the players in the USA priced in the Euro crisis already considering it as to be overcome in the long run.
The ongoing Euro disaster is rather but a little harassing fire for the US markets not even being worth a proper correction last week. On the contrary, the mini-correction at the beginning of the week was bought madly because there is still an immense lot of liquidity that is even likely to increase enormously in the medium term:
As I see it, the US stock markets are going to out-perform the European markets through the end of this bull market – I expect the final stock market top to happen in spring 2014, you know. I think, during the coming months the European markets are going to be withdrawn a lot of liquidity that is supposed to flow into the USA to a great extent. The investor will retreat from the "dictatorial and communist" Europe taking refuge in the secure, free and liberal Safe Haven USA
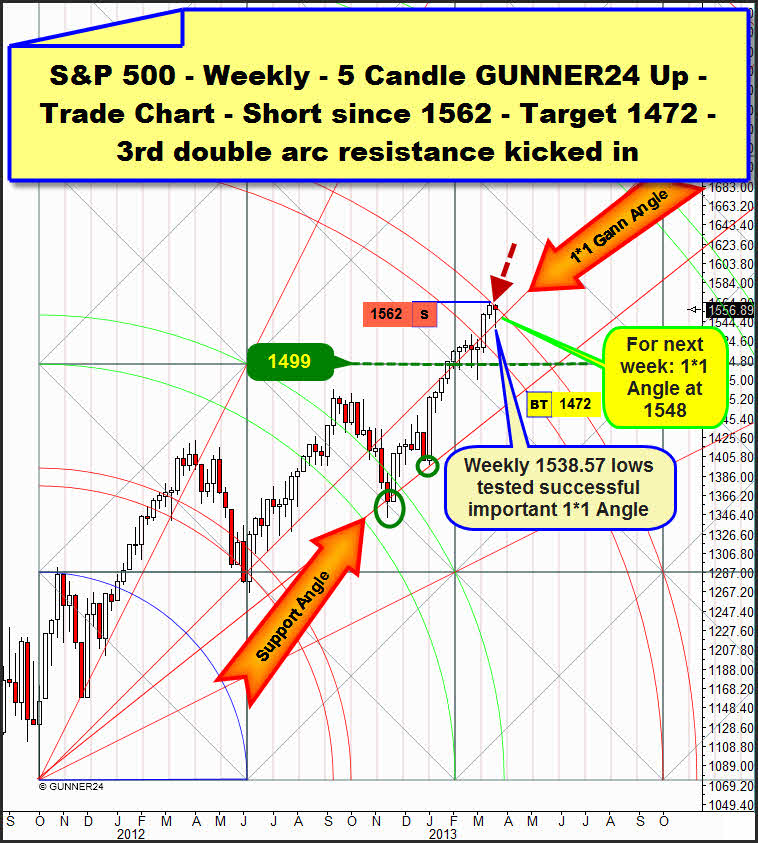
This fundamental change of the investors comportment may lead may provoke that the coming correction in the S&P 500, the NASDAQ-100 and the Dow Jones will result extremely modest now! About this, let’s consider exemplarily the actual weekly setup of the S&P 500 before I dedicate the large part of today’s issue to the currency pair EUR/USD:
We went short at 1562 by the first touch with the upper line of the 3rd in the weekly time frame. To the upper line of the 3rd the market is showing a visible reaction, though by far not so hefty and strong as a short-seller wishes it would. Last week opened exactly at the upper line of the 3rd (second touch) also forcing the market down to the 1*1 Gann Angle. But this test was bought severely on Tuesday. The week closed with a negative result, after all. That was a rare event for the last months…
In my opinion, the next candle/week is newly going to open beneath the upper line of the 3rd. That is likely to lead to a new down-pressure being the market supposed then to head for the 1*1 Gann Angle again! The 1*1 Gann Angle is going to be at 1548 next week. It will take a day close clearly below 1548 to prompt the first hefty sell-off wave. I mean that a daily close below 1544 would activate the strongest weekly support below the actual price.
That’s what the 1499 index points in the strong GUNNER24 Horizontal Support represent. The way the perhaps yet started correction or the possible consolidation since the highs of 03/15 is showing indicates us to work on the assumption that the 1499 may be the end of any correction already. The 1472 still might but don’t have to be worked off inevitably!
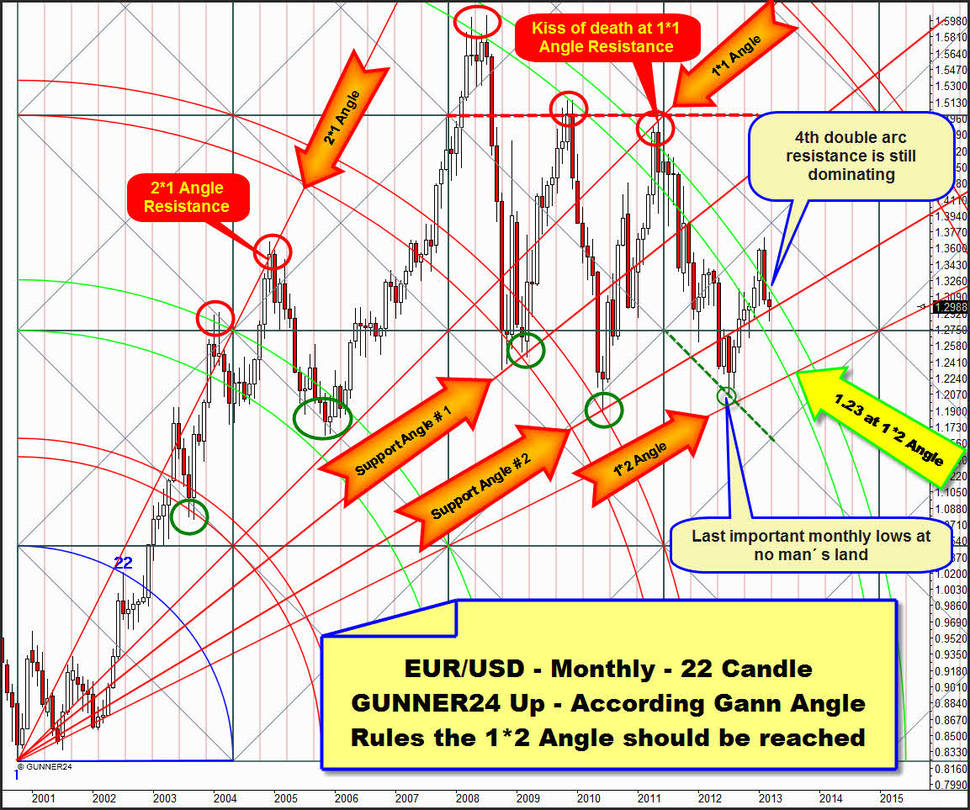
Now the US$ is going to rise at least for the coming 5-6 months, together with the precious metals and the US stock markets. EURUSD is going down. Such is a rather seldom inter-market combination. The pair EURUSD is in an unambiguous uptrend, considered in the very long term:
With the October low of 2000 a 22 months lasting initial up-impulse started whose forecast I’d like to analyze with the GUNNER24 Circle Up Setup at first.
It’s conspicuous that with the all-time high in July 2008 a main resistance was reached, namely the 4th double arc that has been dominating the pair for as many as five years stopping and preventing any persisting up-move and the continuation of the trend.
From below the 3rd double arc has been supporting the pair forcing it upwards over and over again. Lumped together, for as many as almost five years the pair has been consolidating. The last white candle in the monthly chart, January 2013, closed above the 4th for the first time. Technically it’s a buy signal that was denied with the last two candles/months however. Now the pair is going to orient itself downwards again for several months.
For determining the target, for determining the final possible lows of this correction the analysis of the prices at the important Gann Angles (2*1, 1*1 and 1*2) is essential. EURUSD is classically orienting itself by these important Gann Angles. It’s a classical working-off. The important Gann Angles ring in the turns - important ones - in the monthly time frame keeping with the textbook.
After the Kiss of Death at the 1*1 Gann Angle in May 2011, according to the Gann Angle trading rules to reach the 1*2 Gann Angle is now compellingly necessary. It will take a touch with the 1*2 Angle to enable the actual correction move to be finished.
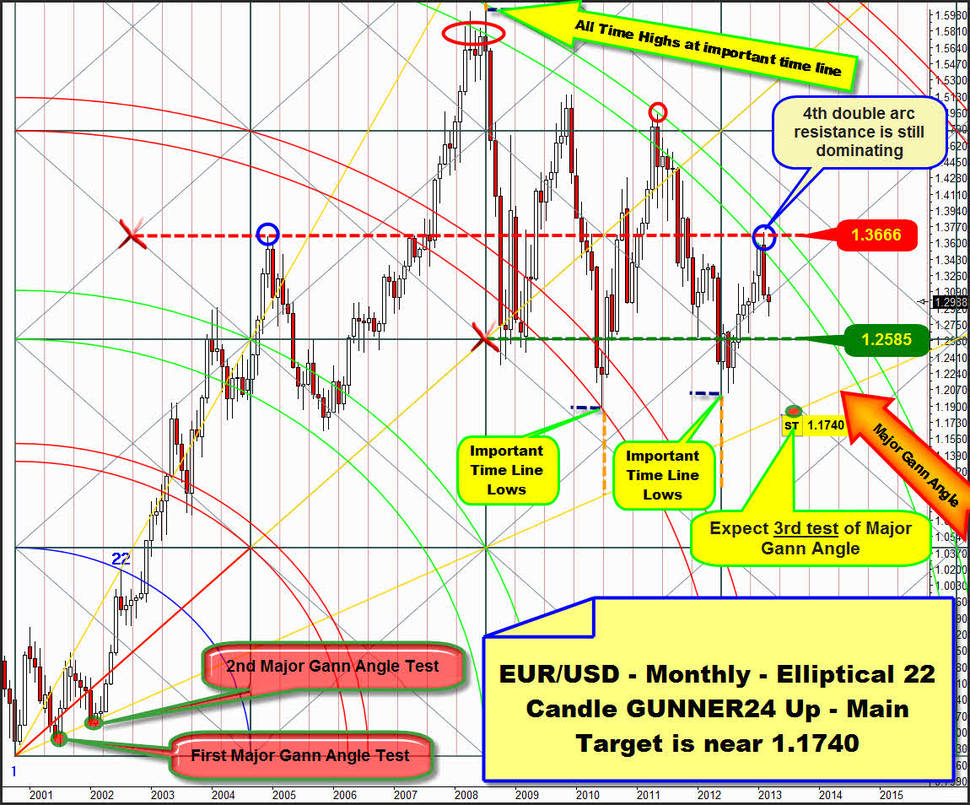
Correspondingly the setup above is putting out the 1.23 as the minimum target for the actual down-swing! There, at 1.23 the pair will meet the 1*2 Gann Angle in July/August. To be still closer to the market, to be able to analyze more profoundly and detailed, in addition a like to use the elliptical setups. Being adjusted the right way they facilitate us enormous market insight:
For positioning an elliptical setup exactly it’s essential that there are to be identified as many as possible meaningful and logical connections of the price with important Gann Magnets (angles, double arcs, time lines, supports and resistances).
In case of the pair the positioning is pretty simple. Important highs and lows can be made out at the important time lines of the corresponding squares. Thus the dominance of the 4th double arc is being confirmed and optically visible in this elliptical up setup as well. From the fact that the February 2013 high was marked at the important GUNNER24 Resistance – the center of the just passed square at 1.3666 – we may infer a new important high. EURUSD is supposed to show newly a hefty SEVERAL MONTH rebound reaction to this dominating Gann Resistance. The main target for the actual downtrend is certainly the Major Gann Angle. This Gann Angle was headed for twice already and tested positively at the beginning of the trend, between 2001 and 2002. The Major Gann Angle is now the strongest down magnet in the monthly time frame.
Steering for the Major Gann Angle is what I expect to happen until July/August 2013. Price target are the 1.1740! For the time being it’s a question of being supposed whether the Major Gann Angle will stop the probably hefty and tough decline. It would be just the third test of this angle, and third tests use to proceed successfully.
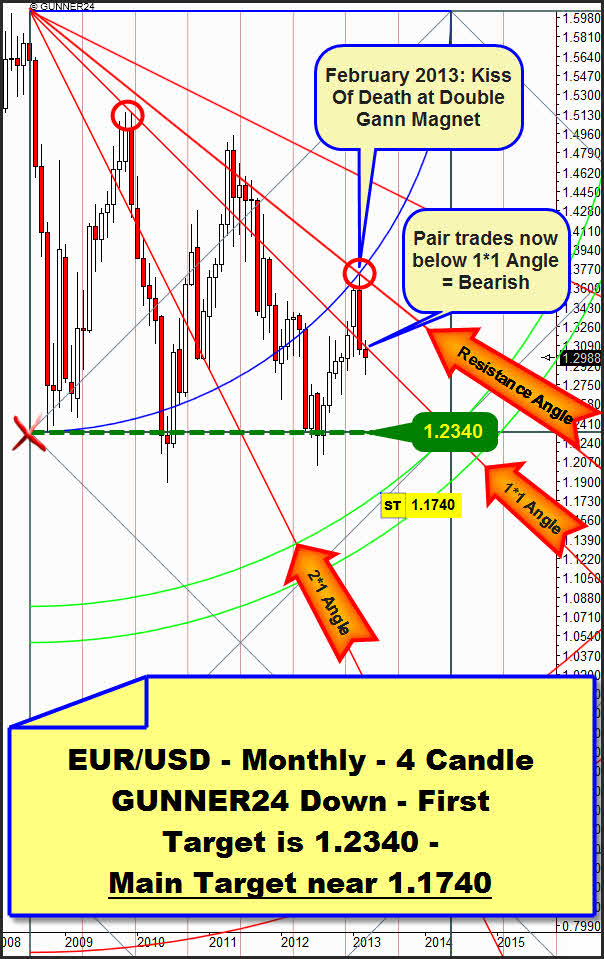
Taking to heart the parallel existing monthly 4 Candle GUNNER24 Down Setup we likewise realize very clearly the threatening situation of the Euro. Especially the February 2013 top was marked at a severe resistance, and the rebound from it seems to develop a hefty down-energy:
At the all-time high we measure 4 months downwards. That’s the initial impulse, the very first wave. Therewith the future supports and resistances are established. The uptrend per se is very strong, that’s why the pair doesn’t achieve within 5 years to leave persistently the first square in the down setup downwards. But the February 2013 high was produced exactly at a combined Gann Magnet Resistance. The combined resistance of the Blue Arc and a Gann Angle, called "Resistance Angle" in the chart above, made the pair fall hard again. It was the matter of a Kiss of Death. Let’s remember… Both monthly up setups are also showing different Gann Resistance Magnets at the February 2013 top. All the Gann Magnets that bundle up at the February 2013 top should/are supposed to be able to trigger a hefty, a very hefty and quick decline.
In addition February 2013 closed beneath the important 1*1 Angle being situated now in the bearish half of the setup again. Thus the February close produced a medium-term sell signal! Shorts are on the agenda! The first target to be put out by the setup above will be the lower line of the first square at 1.2340 again. Also the next down target in the monthly 22 Candle GUNNER24 Circle Up Setup is situated in these surroundings!
I mean, in the elliptical up setup we could identify the Major Gann Angle as the main target of this downswing. In the monthly 4 candle down the first double arc is also lying exactly at the 1.1740 surroundings. Rule: If two different monthly GUNNER24 Setups put out the same magnet as a target, this magnet is a strong attraction point for the price!
Conclusion: The Euro seems to have marked an important cycle high by the February high 2013 being supposed to suffer a considerable depreciation for the next 5-6 months! Now the Cyprus crisis might aggravate the downswing a lot. Target is the 1.1740 till July/August 2013. This forecast means concretely that the Euro and Europe are going to lose considerably confidence. It would also mean that gold is likely to keep its position sturdily during the coming half year being supposed to quote – in Euro-terms - near the all-time highs again, soon! Whether the 1.1740 of EURUSD will resist? Probably they will. There is thoroughly a big chance that there, at 1.1740 the final lows of the entire consolidation – then lasting exactly 5 years - will arrive in July/August 2013.
|
„As far as I know", the GUNNER24 Forecasting Method is the globally unique and only technical analysis tool that deals intensely with the comportment of the market at support and resistance marks being able to combine that with price predictions. You’ll learn everything on these really "secret" facts in the Complete GUNNER24 Forecasting and Trading Course. Order now!
By virtue of the Easter holidays the next Sunday issue of GUNNER24 Forecasts is dropped. Correspondingly the next free issue won’t be published before 04/07/2013.
Be prepared!
Eduard Altmann


