
The stock markets are in a nervous and divergent phase. The calm phase dominating till year-end 2013 is over. Besides it is not supposed to be coming back soon. I.e., also in the foreseeable future the stock markets should be handled only from the angle of day- or swing-trading.
Across the board, unstable trends and quick changes of mood are the standard. In addition, there are diverging chart patterns to be made out everywhere that don’t dissolve according to the rules. As to my experience these are clear signs of an important top shaping. The weak January as well as a comparatively high probability of a 15-20% of corrections in midterm election years keep pointing to a correction in this scale to be likely till summer. The capital flight from Europe to the safer US markets leads to enormous divergences in the different stock-market indexes. I think that the European indexes are partially in the big correction phase yet that is supposed to last through summer = August 2014. Some important EU indexes such as CAC 40, DAX and the EURO Stoxx 50 are clearly showing lower highs and lower low patterns for 2014…
On the other hand the US indexes seem to be obliged – again…- to follow their brutally simple seasonality a la Pavlov that for a midterm year in the 4-year-election cycle is signaling and indicating an important high to occur in the middle of April before the traditional switch into the "Sell-in-May-and-go-away" mode is due.
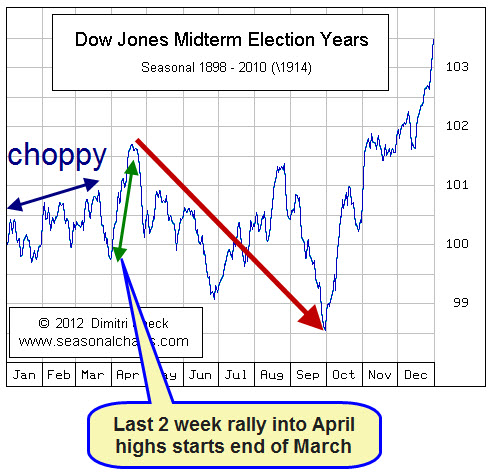
Source: http://www.seasonalcharts.com/zyklen_wahl_dowjones_midterm.html
The S&P 500 continues pressing upwards. On Friday it reached a new all-time high- the mark now is 1883.94 – that however was sold off heftily into the close again. It means that the Smart Money is seeing reasons for distrust again. So the main target of this bull being in its 5th year is not yet worked off officially:
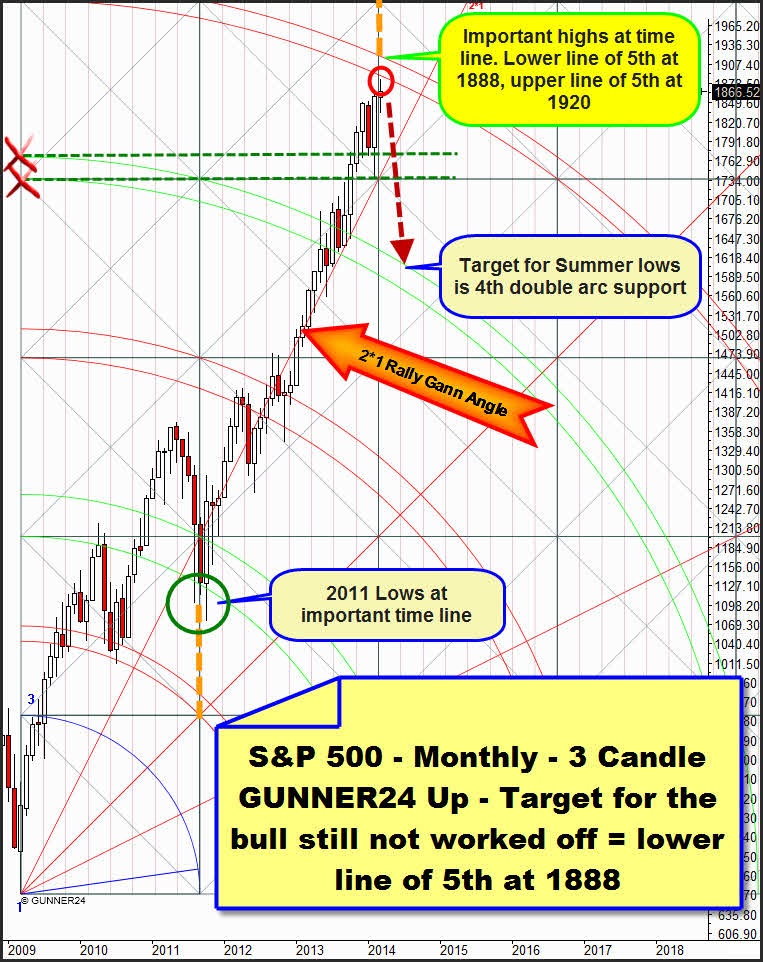
In seekingalpha.com I read last week that the current 60 months of bull-run have lasted severely long in the historic comparison. All the bull-markets of the last 140 years in the S&P 500 kept up 44 months on average. Though the longest bull-market in the S&P 500 within the last 140 years lasted 149 months altogether = 12.5 years!! So, merely theoretically this bull may still be going very long. The signal of this bull for picking up speed again is given to us by the 5th double arc in the monthly 3 candle up setup. It will take one or better two unambiguous monthly closings above this 5th double arc to generate the next long-term buy signal. Not before that one may be pretty safely and steadily on the long side because in that case at least 6 more months of uptrend would be signaled.
But until then the 5th double arc – being the main target of this bull-market – will exert resistance. According to the GUNNER24 Forecasting Method there’s even a high probability for a change in trend to be taken into account immediately after a touch with the lower line of the 5th. I.e. in plain text, as soon as the lower line of the 5th in an up setup is worked off the market may and is allowed to turn heftily. And as soon as consecutively a monthly reversal candle arises confirming so to speak the existence of the main resistance, a pretty secure sell signal will be produced. Such a sell signal cannot be produced before April thereby, but March will have to reach the lower line of 5th before.
But we’re still far from that. First, March or April will have to work off the lower line of the 5th that is situated at 1888 for March and at 1886 for April. On Friday it was close already, but technically, bringing in the seasonality of the midterm election year at least April 2014 will reach the 5th double arc having to trade even between the lines of the 5th. So, for April some prices above 1886 will have to be expected. For a significant April 2014 top maybe the upper line of the 5th will have to be reached necessarily – the 1920!! Also in a current daily up setup of the S&P 500 the 1920 is calculable as an important uptarget. More on that follows in the next chart.
A possible reversal candle – that after all can be generated at the earliest in April – should presuppose at least a 3 month consolidation down to the 2*1 Rally Gann Angle = at least 1750 index points. A monthly close below the 2*1 Rally Gann Angle during the coming 4 months (April, May, June, July) will lead to a test of the 4th double arc = about 1550 till August 2014… i.e. a strong correction (higher than a 15%). That’s still the preferred scenario or the preferred low-area till summer 2014, respectively!
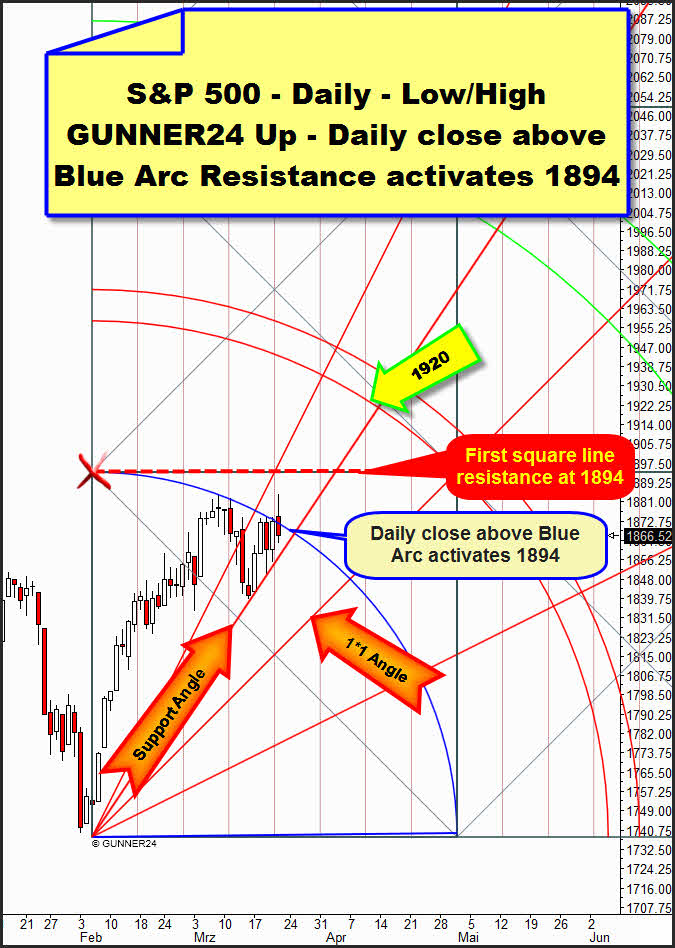
In this daily GUNNER24 Up Setup of the index – thus we are leaving the "Investors’ Level" swiveling into the day-trading or swing-trading area respectively – it becomes apparent how unstable and changeable the market is acting these days. Very simply the setup is measuring the entire initial up impulse from the low of 02/05 to the former all-time high of 03/07. Consider now the dominance of the Blue Arc that is exerting daily resistance. Some daily highs of the last days do pay attention to the Blue Arc. Altogether 4 times the respective days succeeded in generating their highs at the Blue Arc. 3 times thereupon a red candle arises. On Friday the index almost achieved to overcome the Blue Arc on daily closing base. Thereby a new buy signal would have arisen. But once more there was nothing… the Blue Arc is keeping its resistance function intact.
Next week might be in for affliction now. If the Support Angle on daily base is fallen below, a touch with the 1*1 Angle will be compellingly necessary as the next downtarget in the daily one. If for instance on Monday or Tuesday the S&P 500 closes below 1854, the 1828-1830 will have to be reckoned with at the 1*1 Angle. Not before the necessary touch with the 1*1 the next rally-leg would be able to start that consecutively will break the Blue Arc upwards to reach then the upper square line resistance next – the 1894. The 1894 is lying within the lines of the 5th in the monthly up setup. That’s where the whole bull might come to an end.
If the index succeeds to close above the Blue Arc on Monday till Wednesda respectively, i.e. above 1870, it will be very likely not only to achieve the 1894 mark until April but the first double arc as well. Thus the combined daily and monthly uptarget will be attained at 1920!
If the 1*1 Angle collapses on daily base next week = a daily close below 1825, the baby will slide down to 1800!! The 1*1 will have to be worked off in any case since an active Gann Angle sell signal is present. On closing base the 2*1 Angle broke unambiguously the week before last thus making a touch with the 1*1 Angle technically compulsive… The question is just when! Assumed the Friday weakness is about to continue the coming Monday and Tuesday the 1*1 will perhaps be reached during the next 5 days. If the Blue Arc is taken upwards at the beginning of the week this test will be delayed into the near future.
Personally speaking there are lots of ifs and buts! There are too many options to play it safe. And as if that were not confusing enough, also the rather negative short-term perspective and a negative divergence at the NASDAQ-100 are coming along:
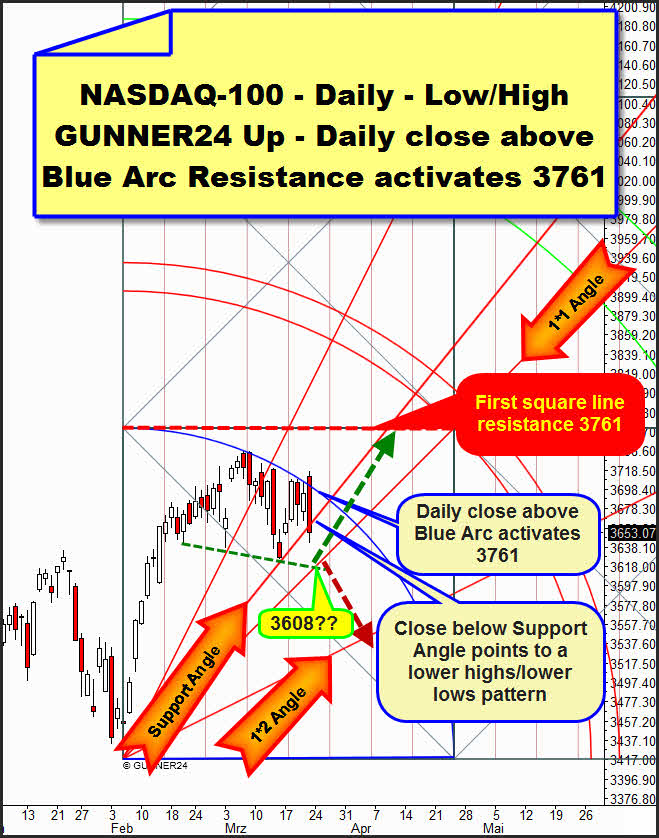
By the development of Friday the NASDAQ-100 rather indicates that it wants to be playing around with the lower highs and lower lows in the daily time frame so possibly being stuck in an initiating downtrend. Thereby, currently it is rather depicting the faint European indexes.
The leader is clearly showing weakness. Unequivocally it is compared with the S&P 500. There is no new bull-market high on Friday. Furthermore no really violent try took place to break the Blue Arc Resistance substantially. There is a negative divergence! Besides, the market closed below its dominating Support Angle. That may all be owed to the expiry day. But even here the Blue Arc keeps on having the market under control being theoretically able to push it down until the resistance of the Blue Arc is expired temporally. That would be the case till the end of April. The NASDAQ-100 rather seems to work off the green dotted daily support line again being obliged to head for the 1*1 Angle = 3608 till Tuesday/Wednesday. In that case there will also be the risk that this daily trend line including the 1*1 Angle doesn’t hold any more. The 1*2 would be activated as the next downtarget then. Actually this is the sign also for the NASDAQ-100 to have topped out finally. (So may have the Dow Jones and the DAX as well)!
A daily close above the Blue Arc Resistance within the next four days will activate the first square line resistance for a possible seasonal high – after Pavlov – in April 2014! This important horizontal resistance takes course at 3761. I do not foresee the first double arc at approximately 3830 until April 2014 at all!! The trading week after the expiry week uses to be directed poor and sluggish often showing a downwards bias, so working off the 1*1 Angle at the NASDAQ-100 (3608) is mabe on the agenda till Tuesday/Wednesday! From there the run into the expected April 2014 highs is supposed to get started.
Be prepared!
Eduard Altmann