
Well, in the equities, the swing high is reached – what's gonna happen next?
As to the S&P 500, in the GUNNER24 Forecast issue of 02/28/2010 we developed the maximum price target of 1080 for March, 2010.
With the Wednesday high of shortly before 1070, that prognosticated target was almost reached. Taking a close look at the March candle we ascertain that the March top should have been accomplished at those 1070. Obviously, the Gann Angle is limiting a further rise.
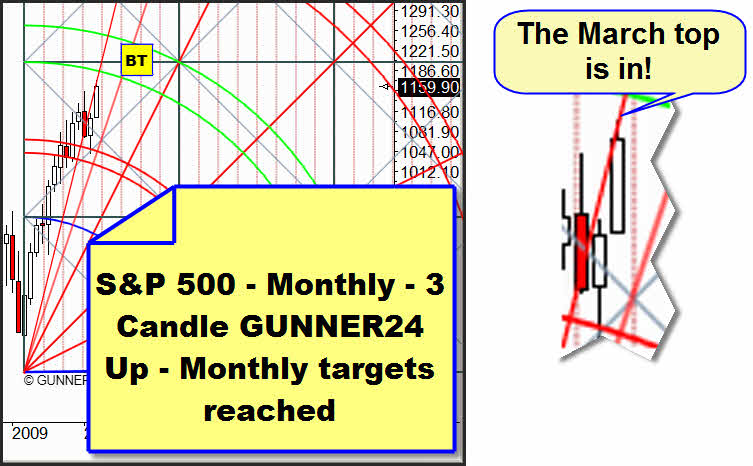
The 1070 are lying precisely on the Gann Angle. And since we know from experience that a re-break of this Gann Angle on closing price basis is pretty unlikely we can assume a close of the March candle between 1050 and 1060.
Furthermore, the next monthly candle is lying exactly on the important time line (in the middle of the just passed square). Thus, next month we can expect the top of the whole upwards trend since March 2009. As a result of our figures, that should happen on April 5 or 6 at 1215.
In the Dow Jones e-mini, the weekly high was produced on Friday.
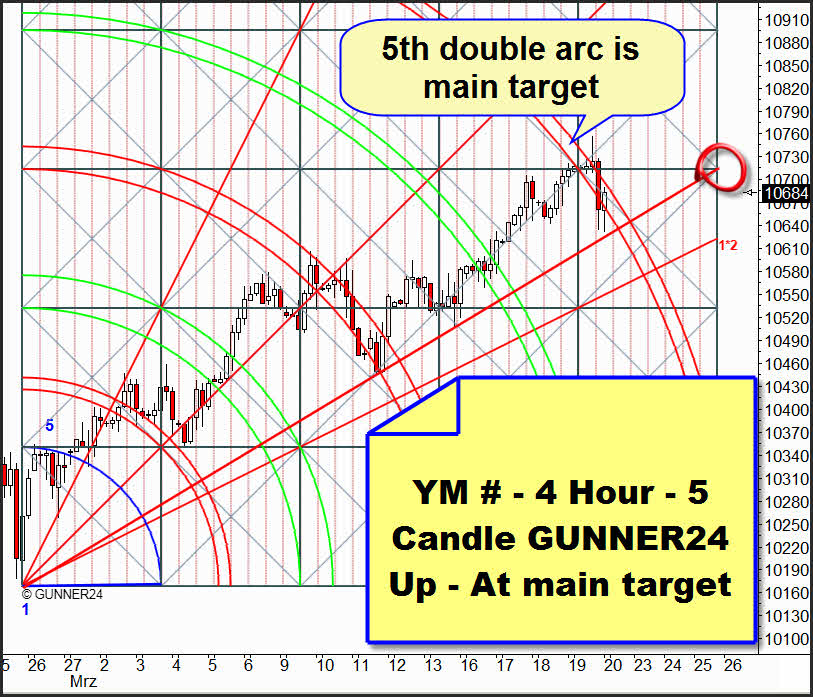
Just in the main target, the price turned. At least the next two or three days, it should be in the sphere of influence of this double arc which is supposed to impede a further price rise and to ring in a little counter trend.
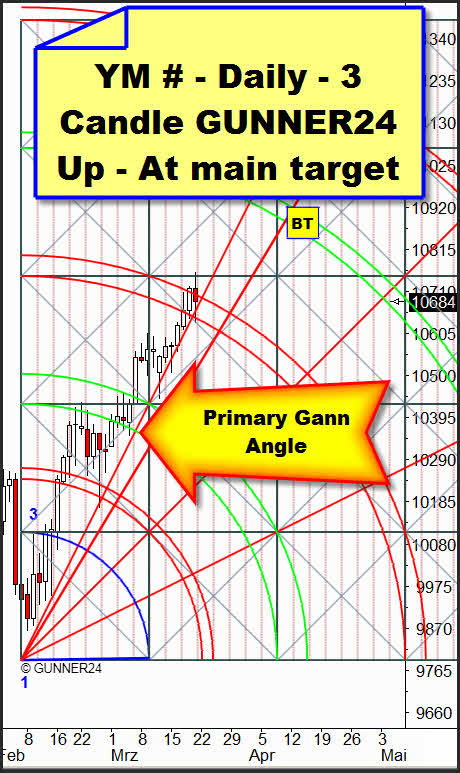
The daily 3 Candle GUNNER24 Up is predicting a short consolidation that will be dominated by the main target.
Even though the further targets were activated by the closing price within the 3rd double arc we will have to consider the possibility that the Friday top in the Dow means the end of the entire upwards trend since March 2009. As we have compiled several times, in the Dow Jones we are expecting "only" a double top at 10700. If the YM # performs the same way as the NDX and the SPX seen from the price and time angle, the final top may be at 10870. Here, we expect the 04/11/2010, as to the time target.
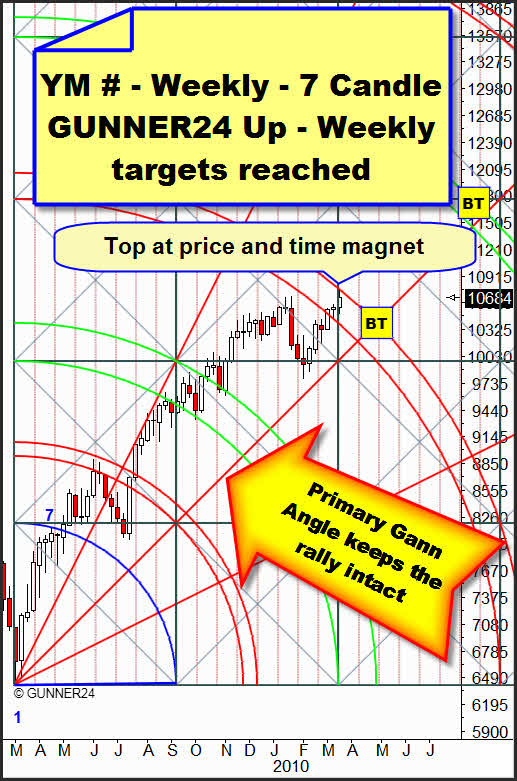
This GUNNER24 Setup is the reason why we assume "only" a double top. The Friday high was marked exactly at the important price and time magnet (intersection upper line of the double arc and the important time line). From next week on, we will be in the 5th passed square where we will have to reckon on a significant change in trend.
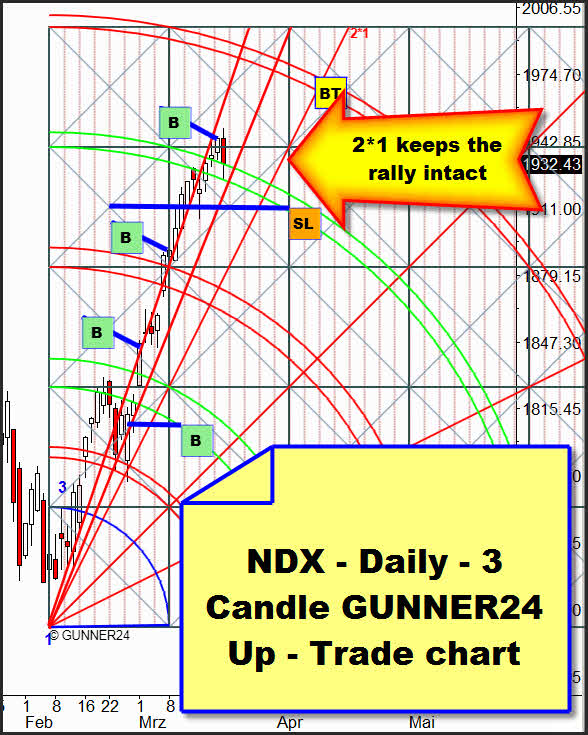
The NDX is determining the bar and rhythm of this exhaustion move in the stock markets. On Thursday, we opened the forth long position since the 4th double arc was broken significantly.
Going into detail we can see the precision of the price following the pre-determined limitations of the GUNNER24 Setup.
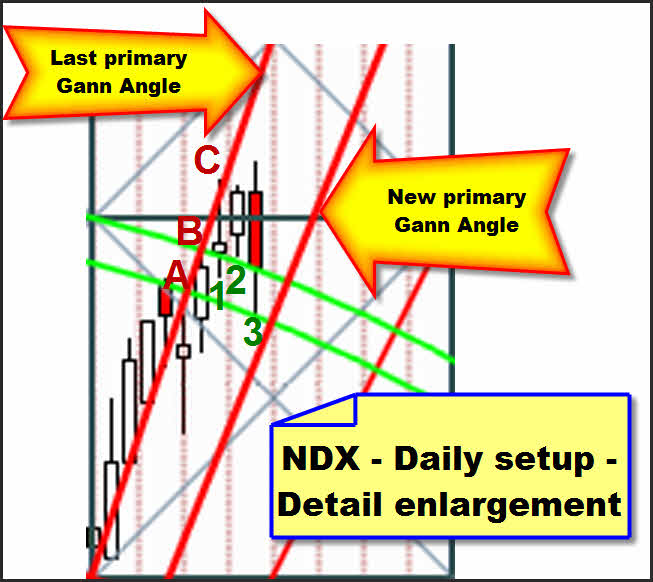
The last primary Gann Angle is limiting the respective price rise at A, B and C red. That is where the respective daily highs are being formed. By the closing price within the double arc, the red B candle is activating the next target. The candle green 1 is opening exactly at the upper line of the double arc. The candle green 2 is marking the daily low exactly at this upper line of the double arc. The candle green 3 is showing us a reversal candle. On the other hand, it is really telling us the upswing is going on. Here, the double arc is being back tested. At the one hand we can see that the close is exactly on the upper line of the double arc and the daily low is lying exactly on its lower line. Nevertheless, the Friday candle is indicating the end of this upswing, first. We should wait for a several day consolidation or a little retracement to the next primary Gann Angle, respectively.
Gold:
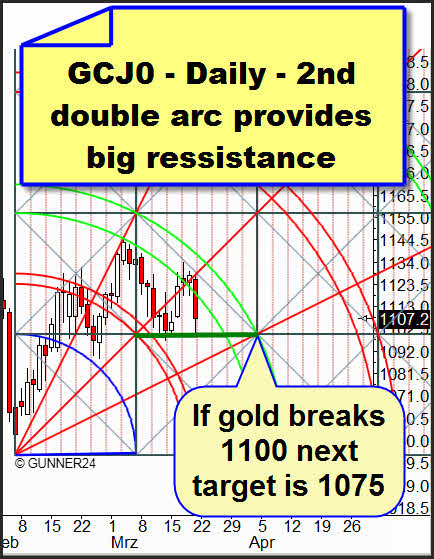
I've got to say that I increasingly dislike the price performance of the gold. The probability that next week we will break the 1100 is becoming evident. The 2nd double arc is influencing the gold price very much, and it's indicating more and more that the temporal influence of this double arc is going to determine the price at least through the 04/11/2010!!
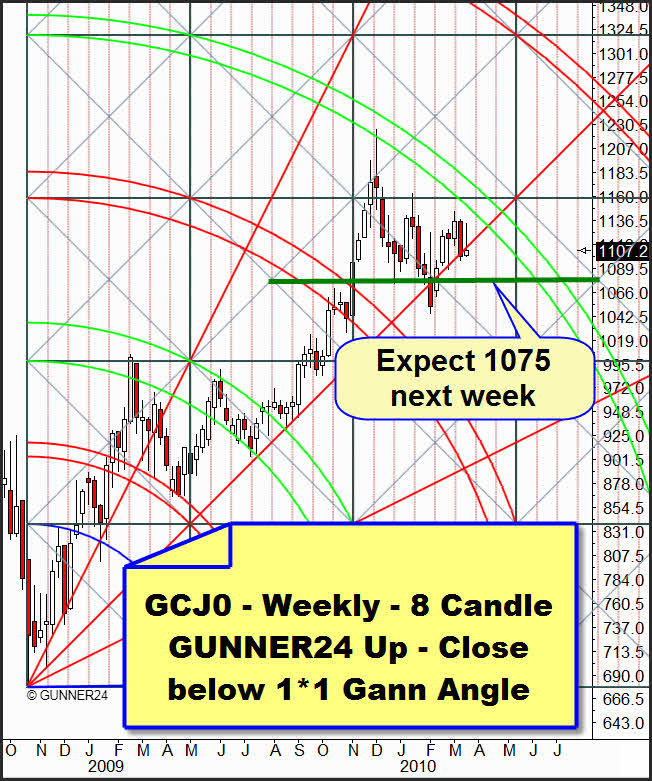
The actual weekly 8 Candle GUNNER24 Up Setup is providing the main reason to the probable submerge from the consolidation area which has lasted 21 days until now. As we worked out in the last issue already, with the break of the 1*1 Gann Angle we have to reckon on a price of 1020 until the beginning of May. With the week closing of 1107, that Gann Angle last week was unequivocally defined as to be a resistance. Thus, its condition possibly changed from being a supporting trend line to become a resistance line. Besides, the last week candle is striking me very much as to be a kiss of death candle. As I said... the 1100 provide a very strong support on daily basis. In case of their break you should enter into some short engagements.
Be prepared!
Eduard Altmann