
There are solidifying indications that a change for gold and silver as well as the Gold and Silver Miners is imminent. Shortly before resp. shortly after Easter 2016, some intermediate tops will be due. Rather deep corrections are supposed to follow. The odds are good for gold as the first important market in the precious metal field to have marked already its uptrend price-high at 1287.80$ 6 trading days ago!
Last Sunday, in the issue headed "Silver looks bullish into 29th of March!" I succeeded in identifying the probably most dominating time support for the entire precious metal field.
It is matter of a circular arc support in silver that is responsible for the currently attained bear market low = year low 2015 as well as for obtaining the present year low 2016.
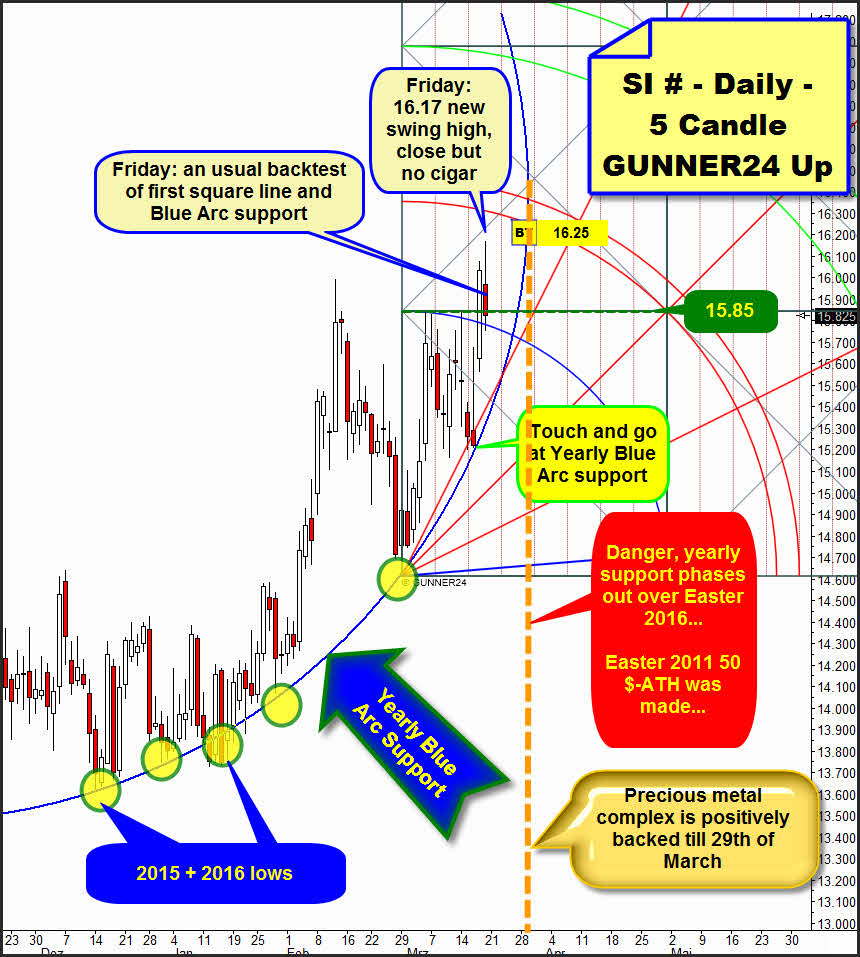
Therewith, we may state that this circular arc support is matter of a support in the yearly time frame = important. EXTREMELY IMPORTANT! Important not only for silver, but also for any other market in the precious metal complex! For – if silver turns because of having lost this yearly support, the other precious metal areas will certainly have to follow, won’t they?
In the chart above, I labeled this arc support in the green/blue arrow the "Yearly Blue Arc Support". The important tests that took place at the yearly support are marked with green/yellow ovals.
Last Sunday, everything pointed to the Yearly Blue Arc support to have to be headed for at 15.20-15.00 within 4 trading days before silver should have newly turned upwards mightily:
==> "B) Silver will newly test the Blue Arc within the next 4 trading days - probability an 80%!! – newly rebounding there and starting there and then its next strong upleg in the current uptrend. Probability likewise an 80%. The probability of silver to rebound – again – heftily from the existing yearly support must be much higher than the multiply confirmed Blue Arc yearly support to be broken finally with the next test!... thus also the existing uptrend coming to an end officially."
Since firstly silver followed this scenario obviously thus keeping on confirming again all the ultimate consequences the Yearly Blue Arc support entails. At 15.21 on the FOMC-Wednesday and at the Yearly Blue Arc support, a powerful rally began, then topping out for the time being at 16.17 with a HIGHER! UPTREND HIGH.
==> Secondly we may, indeed we have to work on the assumption that silver (gold, likewise Gold and Silver Miners…) keep on being supported by upwards forces till March 29 – for that’s when the yearly support for silver expires officially.
==> Moreover, thirdly this means for silver that another upwards push is to be expected for next week that is likely to reach at least the 16.25. Since on Thursday – see the chart above – the first square line at 15.85 was overcome safely on daily closing base, as next daily uptarget the lower line of the 1st double arc resistance at 16.25 is activated being supposed to be worked off through March 29 with considerable certainty.
Fourthly: This following time context is certainly a little dazing for all the Gold and Silver bugs:
==> The Yearly Blue Arc support is officially phasing out on 29th, the first trading day after the Easter 2016 weekend. Thereby, the support will expire exactly one day after Easter Monday. As you know, the 50$ silver alltime-high was reached on the extremely thin traded Easter Monday 2011.
==> My point of view is this: The current existing important Yearly Blue Arc support according to the time factor is DIRECTLY linked with the attained alltime-high 5 years ago, thus silver approaching a very important change. Thereby, silver may obtain an extremely important high shortly before/resp. exactly on/resp. shortly after Easter Monday 2016. Maybe the FINAL HIGH of the year 2016. Yet this theory first requires some confirmation of course!!
When a support on yearly base, when an arc support on yearly base, runs out according time it´s always hard to forecast how the market will unfold into the identified time top. The price might exhaust extremely into the time-top exactly the same day when the support ends. Especially silver is known for extremely hefty exhaustions to emerge at important tops or bottoms. So, it’s quite possible that the 16.25 uptarget is exceeded at least a little bit (16.40?!). Perhaps by a lot however (... a top near the "round" 17$???!).
Sometimes, a few days before an arc support runs out according time, the final price-extreme of trend happens to be made/printed so the market loses the arc support in silence, without hesitation. Sometimes, the day after the arc support has ended a huge decline wave starts, like the important Decade Support Arc downside break at the beginning of 2016 for NASDAQ-100 index. For realizing the described comportment please check free GUNNER24 Forecasts, issue 01/03/2016!
Now to the upcoming/expected Gold and Silver Miners top that in terms of time – as things look just now – should have to be closely related to the imminent silver top!
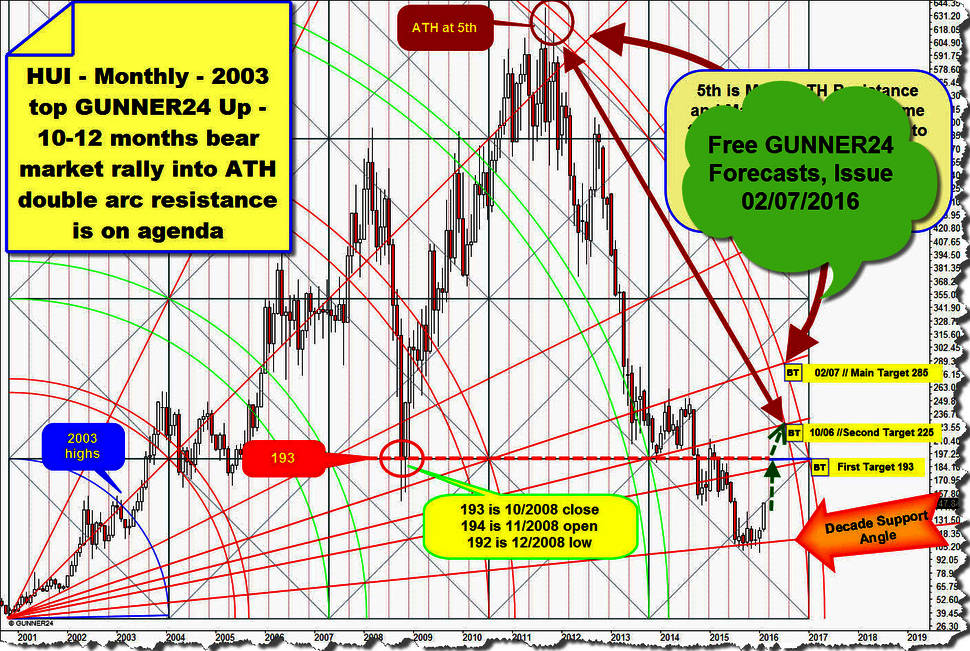
At the beginning of February 2016 (issue 02/07), I recommended to buy the Gold and Silver Mining Stocks. The statement that the HUI (NYSE Arca Gold BUGS INDEX) will have to reach the 193 in this correction in the bear market was a no-brainer. 193 is and was first target for the HUI, watch the monthly 2003 top GUNNER24 Up Setup above. Then, the HUI quoted at 147.84. In the meantime, it has approached pretty close to the 193-first target:
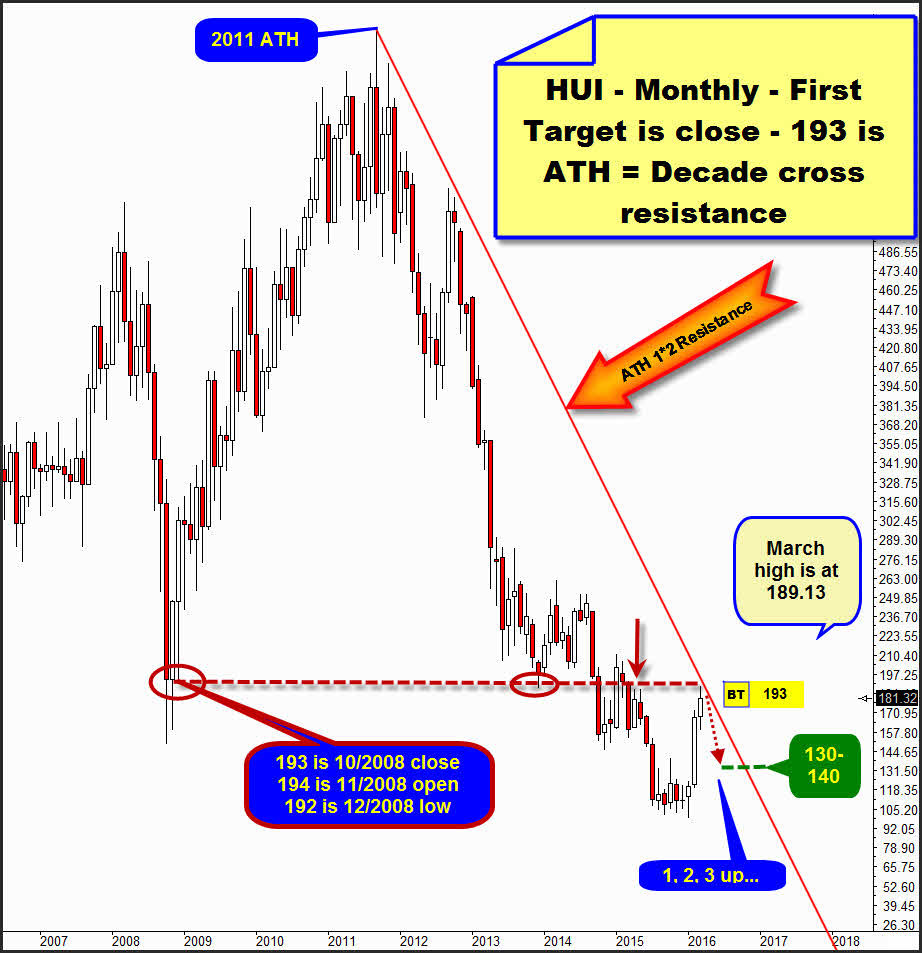
On Friday, it closed at 181.32. Its current March high is at 189.13. Together with silver, the HUI is likewise expected to get a small push higher through 03/29/2016 (+/- 1 trading day = March 24 or 30) to work off its 193-first target.
Please start to offload your Gold and Silver Mining Stocks on Monday evening up a 90-80% of the positions (keep!!!! 10-20% of the original positions as longs), because it is very uncertain that the HUI will get significantly much higher than 193 the next weeks. The current daily and weekly uptrends are in their 3rd month with March 2016 = Fib number = potential month of change when a very important high may be due resp. become necessary!
The 193 is matter of a cross resistance in the decade time frame, because at the bear low of the year 2009 a decade horizontal resistance was formed there intersecting the 1*2 Resistance Angle at 193 in the month of March 2016 that springs from the alltime-high (ATH) of the year 2011.
==> Technically, the March 2016 193-decade cross resistance should have to be strong and powerful enough to force the HUI into a sharp 30% price correction!
==> Thereby, after working off the 193 and beginning with the month of April, the HUI is supposed to correct down to 130-140. Technically, the 130-140 should have to be reached within the next 5 trading weeks. A weekly close below 130 will activate a re-test of the 100!!!!
Since the HUI keeps on being in a confirmed bear market, there is a good chance for the now expected 193-top to be the Q1 as well as the top of the first half year or even – perhaps – the final top of the year 2016.
If I’m wrong with my assessment of the imminent correction and change of trend in the daily and weekly time frames the HUI closing either the trading week 04/04-04/08 or the trading week 04/11-04/15 above 198, till the end of April/early May 2016, the HUI will work off + reach + probably even penetrate heftily its 2nd uptarget at 225! In such a case, you will have to raise your Gold and Silver Miners to a 100% again!
I think that gold has already delivered its final price top of this uptrend keeping its high position only because silver as well as the Gold and Silver Miners are not done yet:
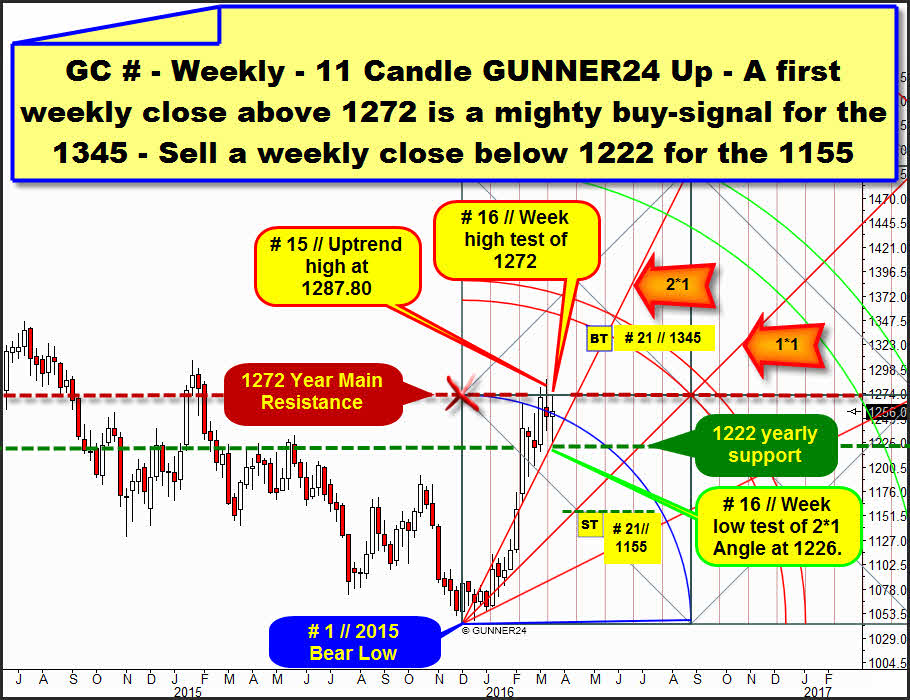
Above, you see an 11 Candle up in the weekly time frame. It starts at the bear low = # 1 measuring from there up to the first important high of the uptrend. Gold looks very exhausted now certainly being in the topping process for quite some time.
At its high, last week oriented itself by the 1272 horizontal that is main resistance horizontal in the yearly + monthly time frames as well as obvious weekly horizontal resistance. The first square line resistance at the 11 Candle up above takes its course exactly at 1272. The after-FOMC high of last week could be reached at 1271.90, so newly no weekly close above 1272 succeeded!
Tuesday last week, gold tested the 2*1 Support Angle at 1226. This weekly low is again only very narrowly above the important 1222 horizontal. The 1222 is likewise important yearly + monthly + weekly horizontal and currently most important support for gold.
Since gold newly rebounded rather heftily and clearly from the 1272 somehow not achieving to escape upwards from the 1272-Year Main Resistance as well as from the Blue Arc magnet, as early as at the high (1287.80) of the 15th week of this uptrend the gold uptrend might have exhausted finally.
==> In terms of the sequence, that might be adequate, because after all, gold was the first of the precious metal markets to come to the important bottom at the end of 2015. Gold reached its bear low at the beginning of December, silver bottomed by mid-December into the bear low. The Gold and Silver Miners did not attain their bear low before mid-January 2016.
Signal situation: A weekly close below 1222 within the next 3 trading weeks will activate the 1155 for the 21th week of the uptrend. 1155 is the center of the first square, so it would mean a sane 50% correction of the 11 week first initial up impulse!
==> If I’m wrong with my assessment the precious metal sector not being willing to top out before the end of April/early May 2016, gold will confirm that with the very first weekly close above 1272!
==> If gold closes one of the next 3 trading weeks above 1272, with more than a 75% of probability it will reach the 1345 (lower line of the 1st double arc) through the end of April/early May 2016!
=========================
Just a brief announcement: Over Easter I’ll take a couple of days off. Thus, the next issue of the free GUNNER24 Forecasts will come out again on 04/03/2016.
=========================
You best register with our GUNNER24 Gold Trader now. That’s where we oversee the optimal entries and exits in gold and silver for you. Especially in the difficult market situations where many factors have to be considered the Gold Trader is backed by the additional GUNNER24 Signals based on the combined 1, 4 and 8 hour setups to catch the optimum entries and exits.
|

The GUNNER24 Gold Trader will provide you with the critical knowledge you need to forecast and analyse the precious metals with the GUNNER24 Forecasting Method. All the GUNNER24 Trading Signals you receive real-time are based on the actual Gold and Silver Future. The NEW GUNNER24 Gold Trader is a must for every actively working investor and trader who wants to trade successfully in everyday trading. The insights you receive from the head trader Eduard Altmann (and discoverer of the GUNNER24 Forecasting Method) are truly amazing sometimes. I promise!
Click the button below and order the GUNNER24 Gold Trader - $39.90 US a month. For 201 members and up - $49.90 US a month.
 |
Be prepared!
Eduard Altmann