
For March, working off the next important monthly target lodging at 2145 is to be scheduled. More concretely: Technically, the 2145 are supposed to be reached till the trading week of March 16-20:
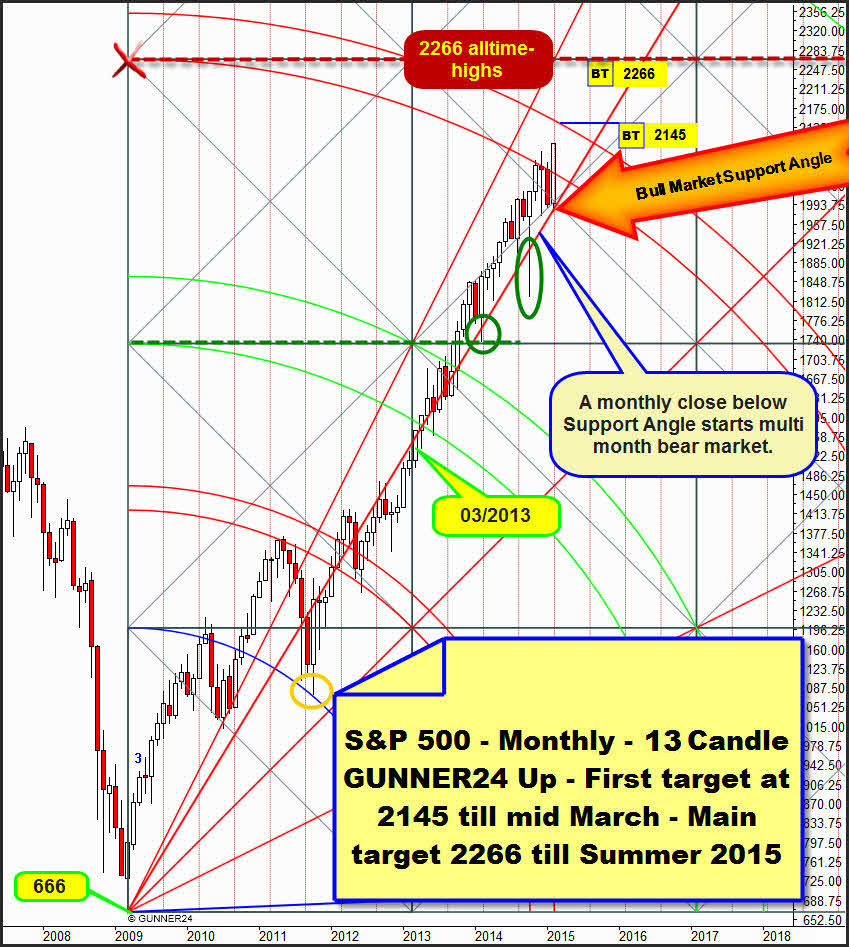
The upper line of the 3rd double arc takes its course at 2145 index points for the month of March 2015. This upper line of the 3rd double arc is the next higher magnet for the index after having been overcome the resistance-function lower line of the 3rd double arc by the lasting February rally.
Today, I’d like to counter-check this 2145 minimum target of the just running upswing by means of weekly setups. In addition, I’m going to make available a forecast according to price and time on what "technically" should happen after working off the 2145 March magnet, incl. a quite possible schedule concerning the processing of the 2266 main target. Furthermore – so I hope – I’m going to work out the March topping region according to price and time in a subtler/more specific way.
The reason for the importance of the month of March is because it will determine with its top and its close whether at all a 3-5 weeks lasting pause in the uptrend is to be reckoned with until the 2266 will be attained. If March closes significantly above the 2145 – from about 2155 or higher – we may monitor but extremely short – at most enduring 2 weeks - mini-consolidations up to 2266 until this mark will have been worked off.
For a March close above 2155 would again have to make accelerate strongly the runaway move that started at the October 2014 lows. These recognitions in respect of the coming and due consolidation- respectively correction-structures are important since – being traders + investors – they enable us thereby to tailor to them the positioning management (increase respectively cutback of long-positions).
I think now that the March top will have to be rather securely above the 2145.
I bethink so because the lower line of the 3rd was exceeded at the November top as well as at the December top and the January top. The lower line of the 3rd double arc was monthly closing-base resistance for 3 months. However, in the respective monthly courses it was allowed to be briefly surpassed. So, since the upper line of the 3rd is in a mathematic context with the lower line of the 3rd, the markets repeating really almost always the past performance at mathematically related supports and resistances, the March high above the upper line of the 3rd should also be brought in.
Let’s try now to grasp this March high and the resulting consequences:
==> Both currently most important up setups in the weekly time frame are helpful here, I think.
Lastly, in the GUNNER24 forecasts of 11/23/2014, I kept a close eye on the weekly time frame with pending uptargets. Then, based on the following 13 candle up, I stated the following:
„Thus, weekly and monthly time frames will be in perfect price-and time-harmony at 2156 for Christmas. 2156 is recognizable weekly up magnet. Its monthly up magnet is anyway."
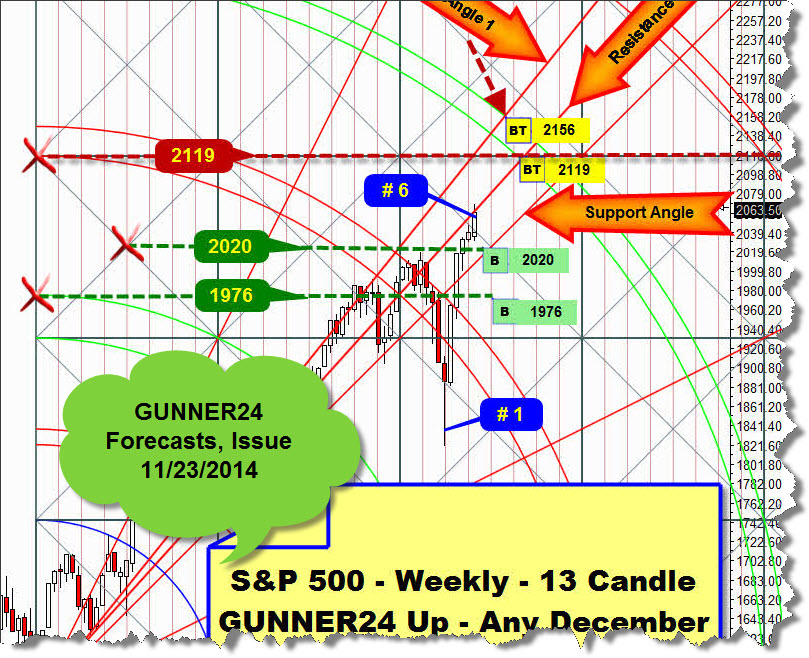
==> On 11/23/2014, the index seemed able/supposed to reach the upper line of the 4th doube arc resistance in the weekly time frame around Christmas 2014 at 2156. For the X-mas week, the upper line of the 4th doube arc was congruent with the upper line of the 3rd resistance in the monthly 13 candle up that is/was at 2156 for December 2014…
Since in the monthly time frame the lower line of the 3rd resistance restrained the market on closing base from November 2014, so far it hasn’t come to the upper line of the 4th doube arc magnet – being the strongest up magnet in the weekly time frame - to be worked off. The coming week will lead to the processing of the upper line of the 4th doube arc magnet.
For next week, the upper line of the 4th double arc = strong weekly resistance will take its course at 2119 index points:
Together with the GUNNER24 Horizontal arising from the intersection point of the lower line of the 3rd double arc with the beginning of the setup (June 2013 lows), next week will form a weekly resistance magnet at 2119.
This horizontal intersects the upper line of the 4th at 2119. Thus, both resistances together (at the same time, at the same price) will form a magnet. In this case it will be a GUNNER Resistance Magnet.
==> For next week, technically it should be rather difficult for the market to go above this magnet substantially. Perhaps/actually, at 2119 a several day pullback is supposed to start that may thoroughly attain the 2080-2070 region.
Nevertheless, even after such a pullback, the runaway move will go on till the 2145, since this is the target in the monthly time frame after all: ==> up magnets in a monthly time frame use to overrule resistances in the lower time frames leading to those resistances to be overcome sooner or later.
In any case, a clear daily close above the 2119 will activate the 2145 (monthly target) as minimum target for the March high.
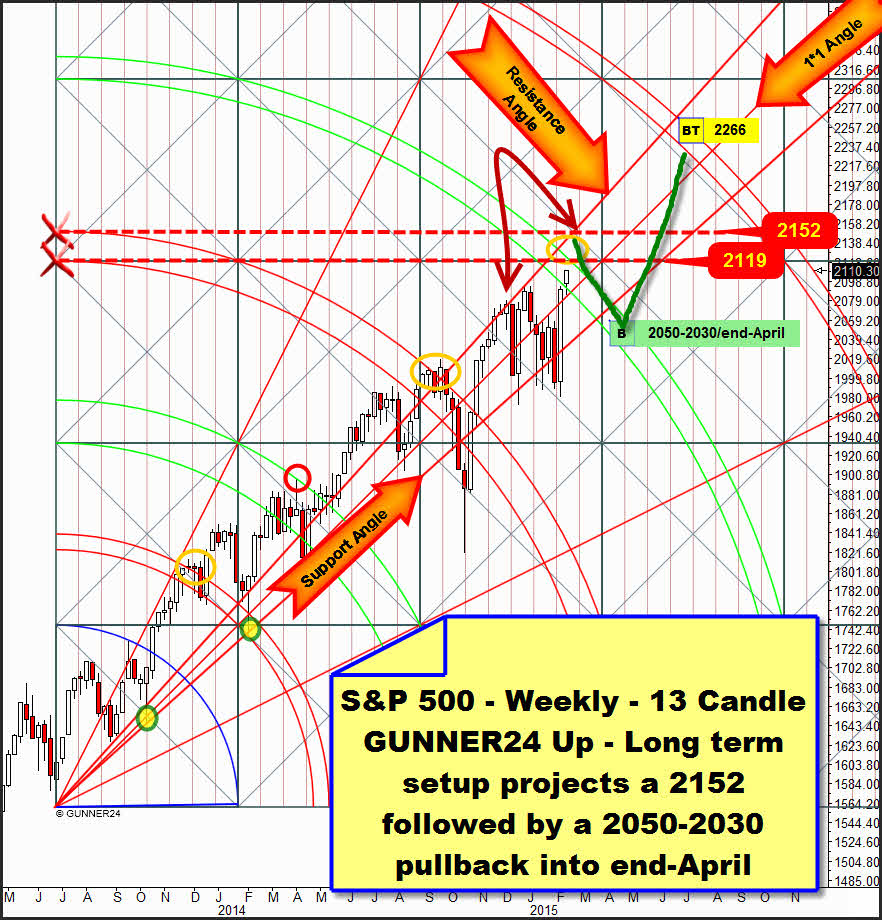
In the end, the weekly 13 candle up confirms quite directly that the 2119 weekly resistance magnet is supposed to be overcome. Thereto, we’ll only have to observe and analyze the former performance at the upper lines of the 1st, 2nd and 3rd double arcs. At the upper line of the 1st and 3rd (orange ovals), the S&P 500 succeeded to exceed the respective upper lines turning in two respectively one narrow weekly closings above the upper line. So, the several week corrections/consolidations began in each case closely above the upper lines.
Only in the case of the upper line of the 2nd double arc the consolidation period began precisely after the upper line was exactly worked off = see the red circle. Hence, in 2 out of 3 occasions the market had to trade above the respective upper lines. Thus, with a 66.66% of probability, the S&P 500 should go above the upper line of the 4th. ==> Thereby, the next higher resistance in the weekly time frame is offering itself as to be the March high.
2152 is likewise a GUNNER24 Horizontal Resistance. Well, at 2152, the Resistance Angle intersects this 2152 horizontal by mid-March. Thus, the next higher weekly resistance magnet above the 2119 magnet is at 2152 offering itself strongly for the March high consequently.
In addition, we remember… above in the analysis of the monthly target that the 2145 should have to be surpassed, technically…!!?
Well, so we ascertained the possibility of the 2152 to be a first refined March high.
As likewise mentioned above, in March it will depend on the closing price. If March accomplishes a close above 2155 – thus above the weekly 2152 resistance magnet – this time the market will be extremely improbable to lay down a correction/consolidation as in the 1st, 2nd and 3rd double arc surroundings, because then it would have to pull straightway up to the 5thh double arc main target.
Since markets almost always repeat their respective performance at mathematically related supports and resistances, as mentioned already, technically it should come to a several week consolidation/ correction = pullback after the March high.
The pullback might thoroughly last 4-6 weeks. Thus, it might endure from mid-March to end-April. A shorter pullback is to be expected with the same probability. In the end, the market is in a runaway move that impedes the bears to breathe. I think however that another dip below the Support Angle going to 2050-2030 represents a Bulls’ present for the 2266 main target that is also to be identified for the summer months in the weekly setup above.
Then, the 2266 will be at the 5th double arc resistance surroundings, namely at the point where the Resistance Angle crosses the upper line of the 5th double arc = 2266 are combined monthly and weekly resistance = main target.
Based on the following, never yet presented weekly up setup beginning at the important October 2014 low, I’d like to put in the balance another, again scarcely higher possible March high:
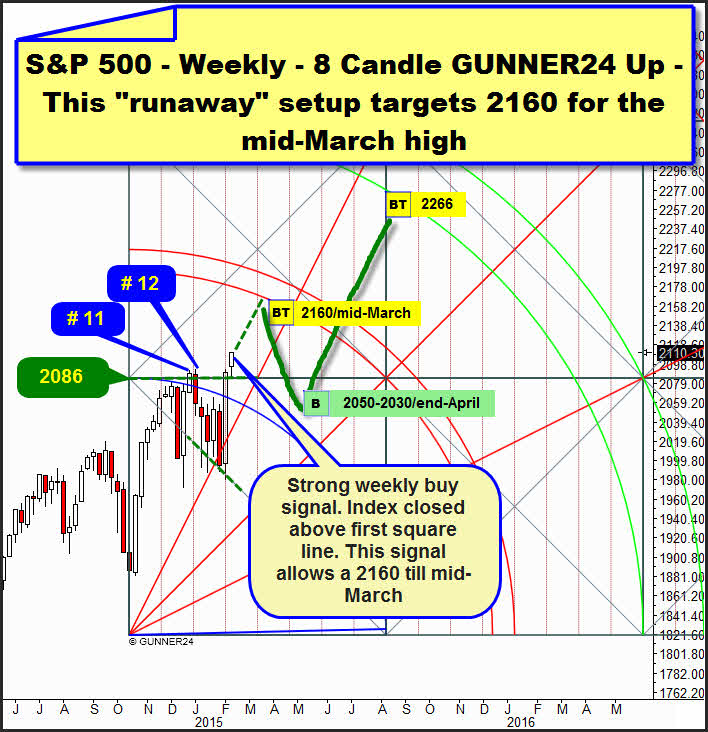
It’s an 8 candle up that may demand still a little more validity. Perhaps we can respectively have to take into consideration 12 candles as first initial up impulse from the low to the absolute high of week # 12. The first square line at 2086 looks a little funny compared with both important highs of the weeks # 11 + # 12, but even so the weeks # 8 + # 10 form their highs at the Blue Arcs, and the green dotted diagonal marked a couple of important weekly lows…
…and the most important recognition: Last week marked its low at 2086. This is technically sufficient evidence that the up impulses enduring 8 weeks – assumed by me – should have to/may be extremely important in terms of signaling.
Since, for the time being, last week first of all tested the 2086 horizontal breaking clearly away from it in succession – as a result 2086 is strong weekly support now – the more or less straight way up to the lower line of the 1st double arc is imminent. The latter takes its course at 2160 for mid-March 2015 being newly activated uptarget in this "runaway" setup!
A brief conclusion again: Until the middle of March, the rally is going on. Minimum target 2145, but more likely above it. Possible March tops are now either at 2152 or 2160. 2119 is next important weekly resistance magnet, able to force the market temporary into the 2080-2070 region.
A clear daily close above 2119 will activate the 2145.
A clear daily close above 2145 will activate the 2152.
A daily close above 2152 will activate the 2160 until the middle of March.
Then it will depend on the reactions to the March top. If the market does not react or just slightly to the respective possible top magnets March closing above the 2155, before the processing of the 2266 main target we would have to reckon only with mini-breaks (1-2 weeks of duration) in the runaway move until it will come to its working off.
March is more likely not accomplishing to close above the 2145 however hence showing a clear reaction to 2145/2152 respectively 2160. Thereby a maximally enduring 4-6 weeks pullback into 2050-2030 support area would have to be reckoned with, before from there by the middle/end of April the next rally-leg into 2266 should start.
|

„As far as I know", the GUNNER24 Forecasting Method is the globally unique and only technical analysis tool that deals intensely with the comportment of the market at support and resistance marks being able to combine that with price predictions. You’ll learn everything on these really "secret" facts in the Complete GUNNER24 Forecasting and Trading Course. Order now!

Be prepared!
Eduard Altmann