
After the back and forth of the last days, on Friday a clear chart-technical decision on the direction in the stock markets was effected. Today, I’d like to demonstrate the 2014 correction targets, in addition pinning down closer again golds1322 countertrend target at the end of this issue.
Trigger for the beginning of the correction was finally the NASDAQ-100 by reaching on 01/23 during the Asian trading hours its long notified main target in the monthly time frame exceeding it extremely narrow:
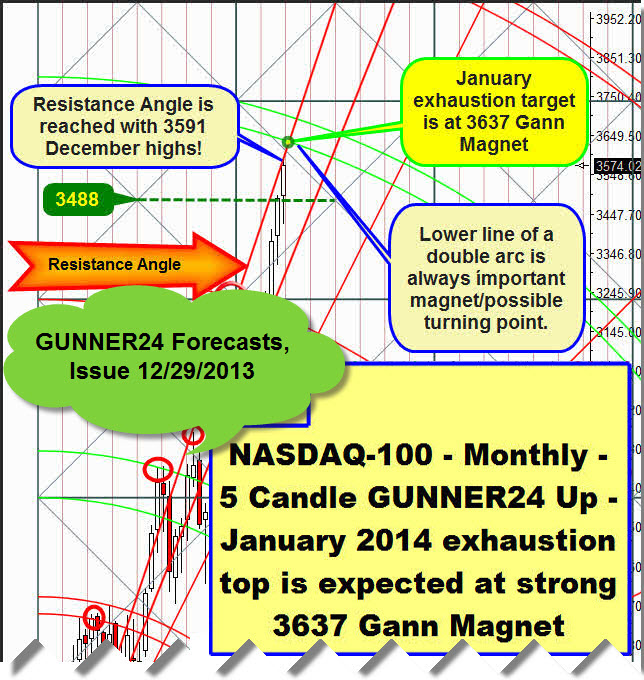
GUNNER24 Main Target = top of this bull was expected at 3637. At 3641 was ending and finish. The several month correction in the uptrend has begun, with a very high probability.
This correction is technically expected to last 4-6 months, correcting about a 15% from the all-time highs (Dow Jones, S&P 500, DAX etc.), perhaps even a 20% from the highs according NASDAQ-100. After the end of this correction through the year-end 2014 the current highs will be attacked, probably even exceeded.
Thus, as forecast already, the markets are likely to give a rather sideways picture for 2014, by and large. They are, corresponding to the midterm election year but above all to W.D. Gann’s decade-cycle being correction years in an uptrend.
Furthermore there is that ominous January effect saying that the entire year is going to perform the same way as January finishes. Since January won’t end in a plus, first you may work on the assumption that the stocks won’t be interesting again before the overbought conditions in the weekly time frames will have been cut back. And such thing takes time…
The following is giving every reason to believe that the world is not going to collapse and not being on the way the monster-decline wave that falls below the 2008/2009 stock-market lows as foreseen/prognosticated by some chart-technicians:
Those were no Major Tops! Dow Jones, S&P 500, NASDAQ-100 topped out at different times and with a measly volume. I always called the GUNNER24 Major Targets in the last months "Exhaustion Tops" because I had expected the markets to show a buy-panic at the end of their respective bull-runs after such a run. Not a chance, as the lacking volume at the tops is only indicating that the markets were too expensive, simply impeding the buyers from following suit. The fact that the markets don’t display this buy-panic of the last bull-idiots and above all, that they don’t present the unloading of long-positions by the Big Boys clearly indicates that it isn’t the matter of the final lows of this bull.
We’ll have to wait and see now how fast this correction is going to expand downwards. The rule of thumb is: The faster and deeper a decline is after important tops, the more it points to a quick end of a correction. This means, if the sell-off goes on unrestrained till mid-February/beginning of March, as many as 80-90% of the whole price decline will be likely to be made. But if the markets want to retest their highs during the coming 10-14 days, pooh, in that case it will rather go down tenaciously till June.
NASDAQ-100 downtargets:
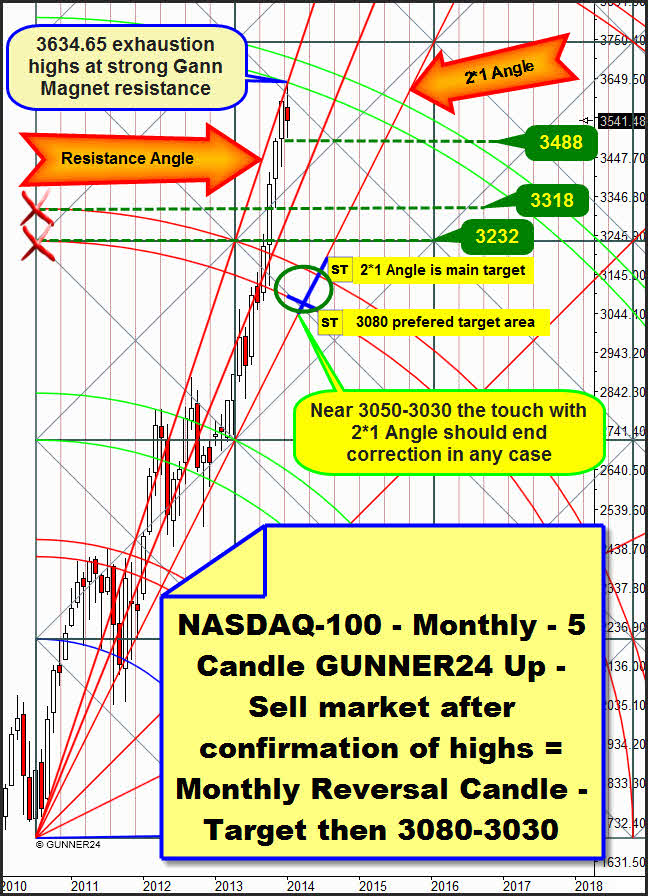
In the monthly time frame, technically a test of the next lower double arc, the 3rd double arc, is due. If the NASDAQ-100 wants to haul off next week, at the next lower monthly 3488 horizontal support, up to the technically almost expected test of the current highs, the whole correction will last longer becoming more tenacious and being necessary a touch with the 2*1 Gann Angle as the correction target – about 3080 till end-May/beginning of June. If the index bangs below the 3488 support next week, and if January closes below the December opening = 3496 thereby delivering a reversal candle it will be possible A) to go short on monthly base – what we will do in that case. SL would be a monthly close above the 4th double arc. And B) the high probability would be there that an immediate test of the 3rd double arc till mid-March at about 3140-3120 (target of the monthly short-position!) would likely be in store, before later on, after a several week rebound the final lows of the correction should be made at the 2*1 Gann Angle till May.
S&P 500 downtargets:
The weekly time frame reached the main target of the 5th double arc as expected first time on 09/15/2013. What clearly contributed a little bit to my confusion respecting the trend recognition was the fact that the top came in on 01/15 instead of occurring between January 04 and 13, besides missing closely the lowest exhaustion target of 1854. Up to last week I had the impression that still a jot was missing, especially because the NASDAQ-100 was definitely not ready yet.
The weekly GUNNER24 Setup makes clear that the correction has begun. No close within the lines of the 5th is to be seen, i.e. the 5th keeps on being strong weekly resistance, so far, for the next months.
==> Any coming touch with the lower line of the 5th will be a nice and profitable short signal. This signal is valid for the next 6 weeks…
The fact that the market didn’t produced long upper wicks at the lower line of the 5th – the mentioned missing exhaustion!!!! – indicates us that the 5th will certainly provide resistance but none of the kind that wouldn’t be surmountable subsequently.
==> A weekly close above the 5th will be – no matter when it takes place – the official and final signal that the bull is going on being reached new all-time highs.
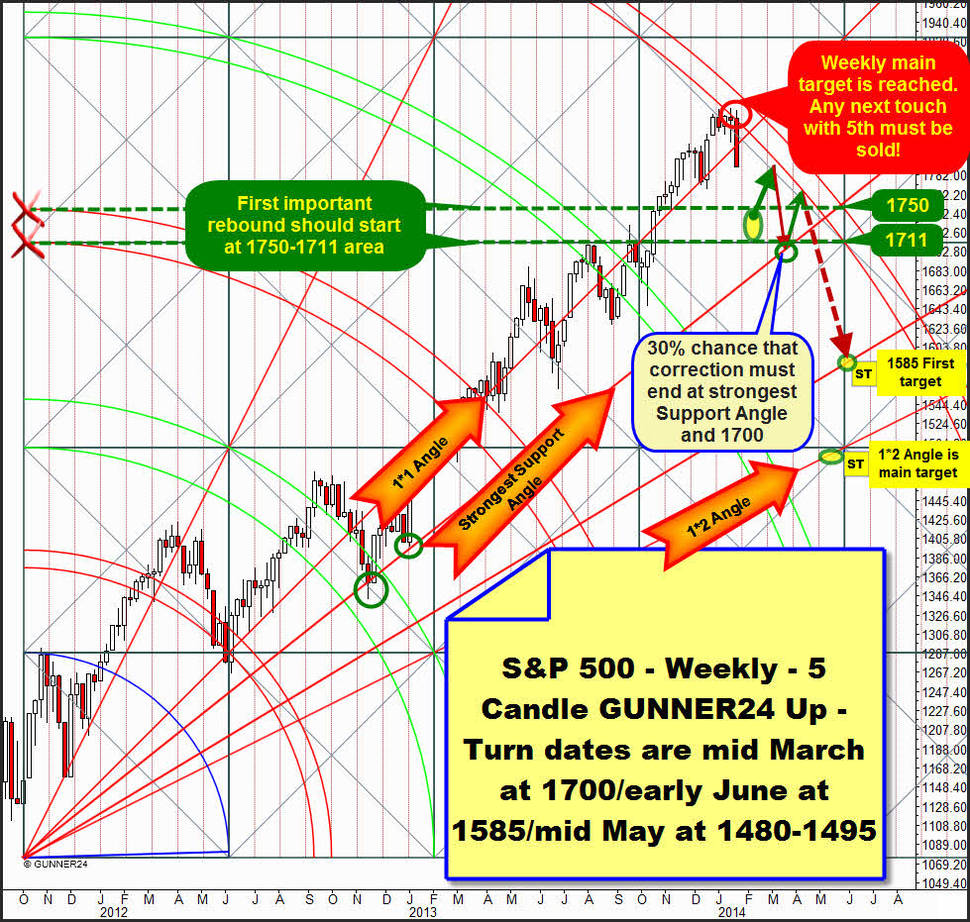
The first leg of the correction is supposed to be finished at 1750. This price target can be worked off as early as by the middle of next week, but at the latest till about February 10-12. If from there the market decides to head for and test the 5th double arc again, the new correction will likely last till about end-May/beginning of June being supposed to end at the Support Angle which resides above the 1*2 Angle = 1585. This is the clearly preferred correction scenario.
But if the index falls down to the 1711 horizontal support during the coming 3-4 weeks retesting then the 5th and retracing downwards to the strongest Support Angle the correction will possibly be finished in March already, at about 1700.
Allowed for this correction – according to the Gann Angle trading rules – is also heading for the 1*2 Gann Angle till the beginning of May/mid-May at 1500. This deep fall is possible and permitted since last week clearly broke the 1*1 Gann Angle downwards with the highest possible energy, representing an important Gann Angle sell-signal and thereby being activated the next lower important Gann Angle as the target. The mentioned 1*2 Angle. During the bull market, this signal occurred several times, but it was denied again and again… But a 20% correction from the highs happens to be 1850 – 20% = 1480!! Well, let’s wait and see.
Mostly we know where the greatest threat lurks and the most profitable gain beckons. For the GUNNER24 Forecasting Method again and again outplays an advantage that many other analyzing methods cannot take into consideration: The factor time.
As I did for instance in the case of the S&P 500 whose high I forecast for my readers exactly to one trading day, in these restless times I will be ready to accompany you, too, with your trading decisions. To know where the trip is going to before the crowd does is of survival and furthermore providing additional safety in trading.
Start just right now, so I’ll give you additionally, every day one fresh trading idea you may convert at once. Daily, you’ll get precise buy-and-sell-triggers, targets and narrow stop-losses for the hippest precious metals, commodities, indexes, currencies and the worldwide hottest stocks.
We use to trade with a maximum of safety, with little use of capital, in both rising and falling markets.
The grand slam is yours – only here you get on the road of success after the secret techniques of W.D. Gann, greatest trader ever.

Click the button below and order the GUNNER24 Trade of the Day - $49.90 US a month.
 |
One’s misery is the other’s joy. Gold is shining again. It’s become obvious that the market participants, beginning on 12/31/2013 switched over into the precious metals, especially and conspicuously visible into gold. It must be something and somewhere one has to invest in. And when the stocks are too expensive there will be some crumbs in it for gold too. I continue working on the assumption that gold is in a countertrend that is supposed to end at the beginning of March. Preferred target is the 1322:
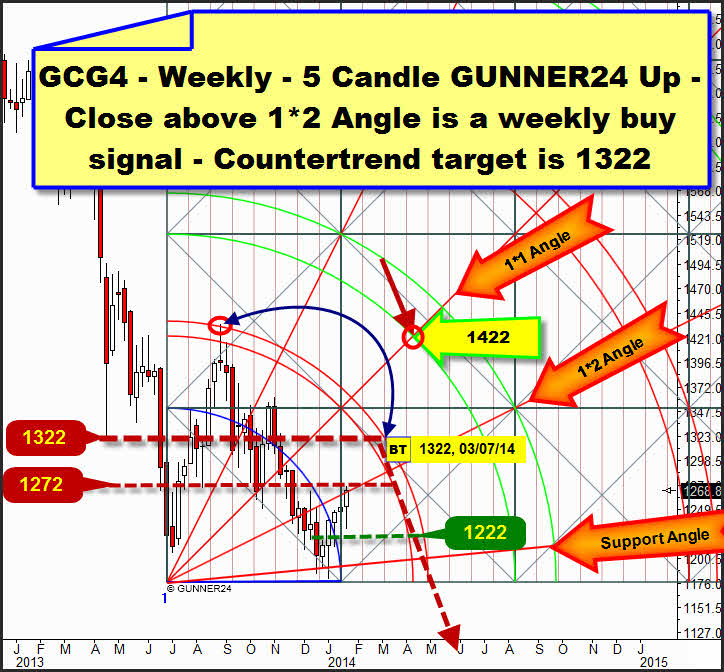
This one is at the upper line of the first double arc in the weekly 5 Candle GUNNER24 Up Setup. The magnetic effect of the upper line of the first was responsible for the market to have had to turn there in August 2013. A la long the upper line may/should be also for this countertrend the biggest possible point of attraction – blue arrow.
The 1322 is at the upper line of the first trading week (03/03-07/2014) in March. Among other things, from this magnet the possible deadline for the end of the stock-market correction is to be derived. I.e. perhaps the investors will have to carry out then a change of the asset classes again.
After reaching the upper line of the first gold is likely to start its decline into the summer lows = lower lows with target 1050.
Since gold’s last weekly close was above the 1*2 Angle – narrowly but anyhow – it is even allowed to head for its 1*1 Angle, according to the Gann Angle trading rules above mentioned. This one intersects the lower line of the 2nd at 1422…!!! in the first April trading week.
As determined for more than a year and observed several times and technically furthermore carved in stone, gold goes on following its monthly GUNNER24 50$ Horizontals:
1422/1372/1322/1272/1222.
They exert alternately support and resistance as well as positive and negative attraction force. The day before yesterday, Friday, the high at the GCG4 Future contract was at 1273.20!
Since gold closed above the 1*2 Angle thereby generating another buy signal that finally activates the 1322, and since gold contrary to the other precious metals got through the "Black Friday" completely unimpressed, thus consolidating at the highs and moreover confirming its nice little uptrend by this strong Friday close, the 1272 is certainly a monthly resistance but it will be cracked. Maybe it will as early as till next Friday.
Be prepared!
Eduard Altmann