
Next one will be D-Week – Crucial as far as the continuation of the stock and gold rally is concerned
With the Friday low, the Dow Jones as well as the S& P and the NASDAQ-100 parked on some extremely important supports. Next week is gonna be universally decisive: Is the rally over, or will the supports shown by GUNNER24 resist, releasing the rally till its prognosticated time target middle of March, 2010?
Considering the stock market, the last time we analyzed the Dow Jones Future Contract (YM #) having a January main target of 10710 (GUNNER24 Forecasts, Issue 01/10/2010). Just 10687 points were reached. One of the reasons was that the high was fulfilled on January 19 instead of January 14, as supposed.
Thus, the lower line of the main target (3rd double arc) in the course of time shifted a little bit downwards:
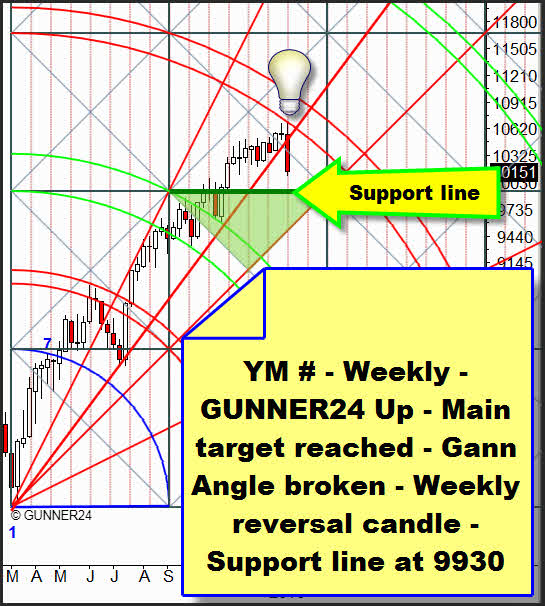
The situation: The lower line of the main target was reached exactly on 01/19 releasing last week's price slide. We see the price produced a reverse candle breaking the Gann Angle which since July, 2009 had supplied a mighty support. On weekly basis, the NQ # contract (GUNNER24 Forecasts, Issue 01/03/2010) and the ES # contract present the same behavior.
Thereby, on weekly basis all in all a short term bearish situation has arisen.
Nevertheless the Dow Jones, the S&P 500 and the NASDAQ-100 are still in the bullish part of their respective GUNNER24 Setups and after a short shake out by the market participants we may go on expecting rising prices. Next week's support is at 9930. It should really be touched briefly. If the 9930 are going to be reached we will seek the long entry on daily basis.
On weekly basis, we simply have to wait and see how the actually happening correction is going to develop and to continue performing.
About that, please read the following 6 ascertainments and analyses:
1. Last week's price performance at the main target did not produce any spike candle. Actually, that speaks for a continuation of the rally.
2. The weekly targets of the S&P 500 and the NASDAQ-100 have NOT worked off yet.
3. Furthermore, we have not seen any price exhaustion in the stock markets yet.
4. We assume that we are going to work off the one year cycle from March 2009 to March 2010 precisely which began with the low in March 2009 and should end with the high of the move in March 2010!
5. The persistently most bullish situation of the monthly chart points undoubtedly to a continuation of the swing:
„We would rather advise against engagements on daily basis because the test of the lower limit of the corridor (cir. 1097) obviously is to be expected in January. In order to shake out the market participants, even 1090 might be on the agenda again. A final January price below 1090 would endanger the rally very much!"
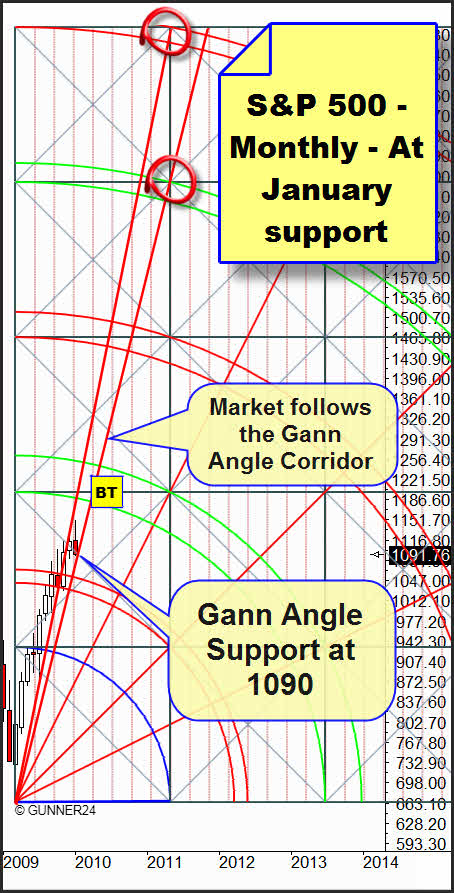
The support worked out in the analysis of 01/03/2010 was reached by Fridays close. The market is still in an extremely steep Gann Angle corridor which is controlling price and time. Thus, it should rebound upwards again next week. Looking at the chart we see that the price might go a little lower next week without endangering the longer term upwards trend. For exact calculations regarding the coming weekly low you should apply the actual Daily GUNNER24 Down Setup.
After the rebound from the lower limit of the corridor the rally "MUST" start in order to enforce our time analysis (high by the middle of March, 2010!).
Next week is that decisive because the final price of the January candle is going to be produced. A weekly close far under 1090 should result in having us touch down from above to the first red double arc at 1040 and test that support.
In this context, let's have a brief look at the actual Monthly GUNNER24 Up Setup for the NASDAQ-100:
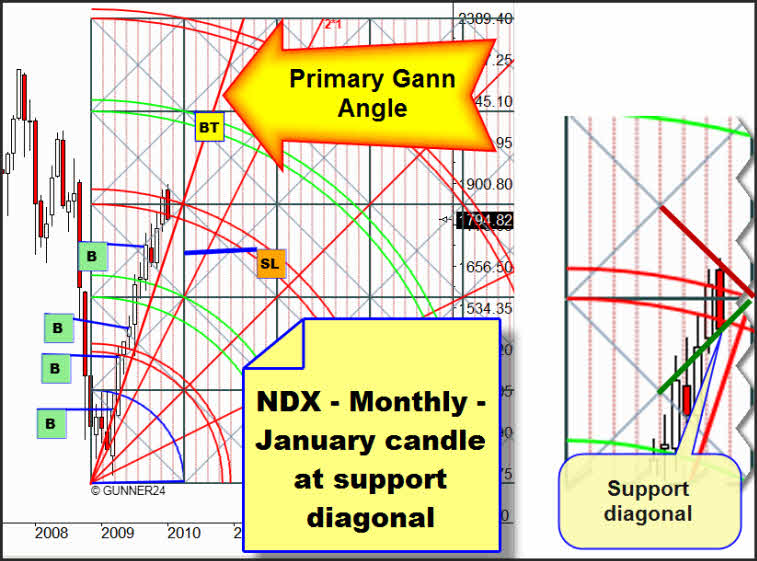
The situation: The market rebounded from the resistance diagonal, marked red in the zoom chart (right), parking exactly on the support diagonal with the Friday close. As you can see, this support diagonal is really dominating. It has been influencing the market since September 2009. Accordingly, it is important to keep the upwards trend going. If next week that support diagonal holds on the rally should take off through the middle of March.
The break of the support diagonal at 1792 results in the next support, the primary Gann Angle (1720). That primary Gann Angle marks the rally in the American stock markets. Since it hasn't been tested more than once another test is permitted. It does not endanger the rally!
=>>The rally is not over before that Gann Angle breaks on final price basis.
6. The seasonality in the commodity markets often marks an important low at the end of January to take off then to the last up swing:
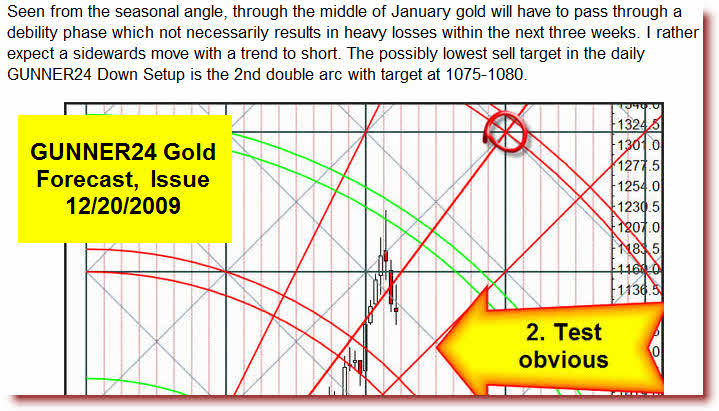
This test at the important time line is virtually offering itself. Please, pay attention to the actual forecast in the following chart:
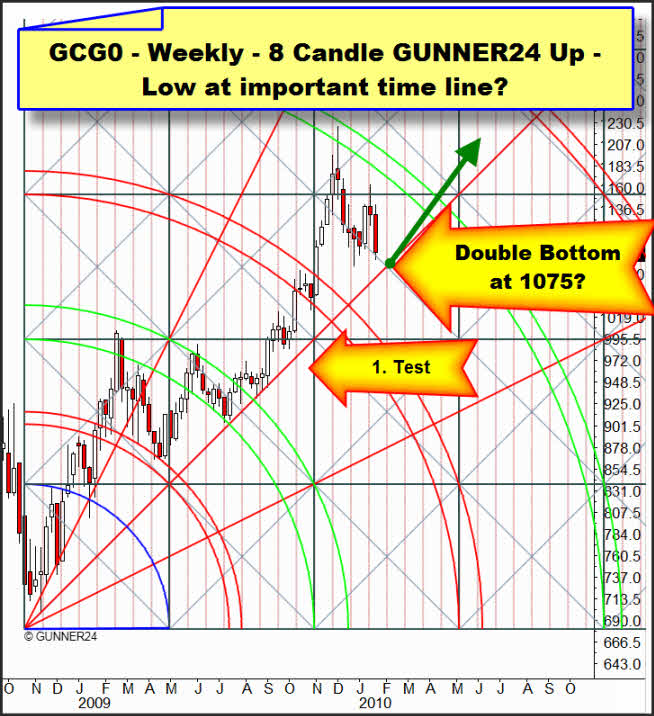
A double bottom at 1075-1070 would be a really ideal qualification to give the market the right push upwards!
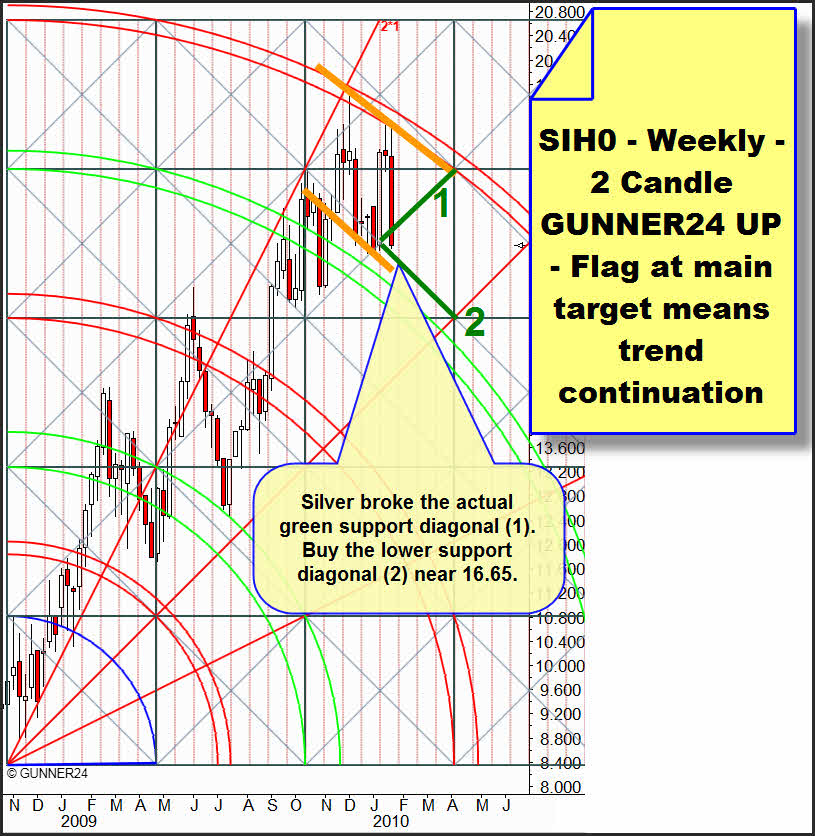
In silver, the situation is looking likewise promising in terms of chart technique. As early as in December 2009 silver reached its main target, the 5th double arc. But it shows the same bullish chart signal (flag) as the GUNNER24 Up Setup at the continuous copper contract in October 2009. See GUNNER24 Forecasts, Issue 10/11/2009.
Conclusion: The markets are parking on important supports. But next week, they should resist. I evaluate last weeks correction as the last shake out before the final up swing. If the supports break everything will go down rapidly and we will have to adjust our analyses.
On Monday, with the coming tests of the Friday lows in the stock markets, the courageous go long with a narrow stop. To find the fine tuning for the long entry on Monday you apply the actual GUNNER24 Down Setups in the 4 and 8 hour time frames and you will see that in both down setups we can expect the main target of the down swing at 1083 in the ES # (upper line of both 3rd double arcs!). Next week the ES # should bounce between 1080 and 1115 with the low maybe occurring at Wednesday.
Thus, I am expecting a short term fall below the Friday lows in all the markets and the retests of them (may last 1 to 1.5 days) to concrete the important supports on monthly basis.
That is why: All the prudent investors and traders should wait and see a successful test of the Friday lows and not seek for a long entry on daily basis before a reversal daily candle.
Gold and silver are hedged downwards by the support diagonal which is underneath the price and by the related support zone. Long entry targets on daily basis are 1075-1070 in gold and 16.65 in silver.
Be prepared!
Eduard Altmann