
In the daily and in the weekly view the equity markets are overbought having reached many up-targets and even passed them with a relatively low trading volume. Being the front motor of the stock markets the NASDAQ-100 just climbed to a new 10 year high. The Elliot Wave bears have been suffering for quite a long time. So week after week they exclaim the sell-off they consider as to be overdue. But there are an increasing number of symptoms indicating that this bull-run has not nearly come to its end but is expected to continue for several months.
A soon top on daily and weekly basis with a following several-week correction is supposed to be the best success the bears might manage to achieve. Then there will be the threat of 14,000 in the Dow, 1385 in the S&P 500 and at least 2610 in the NASDAQ-100 (analysis of 01/08/2012). Time target is March, or rather April.
The indicator situation makes clear that technically nothing else but long entries should be looked for and the significant pullbacks should be bought necessarily, according to the motto "the trend is your friend". Trading and investing can be pretty easy and without too much risk sometimes. Long is the flavor of the medium term, the corrections will have to be bought:
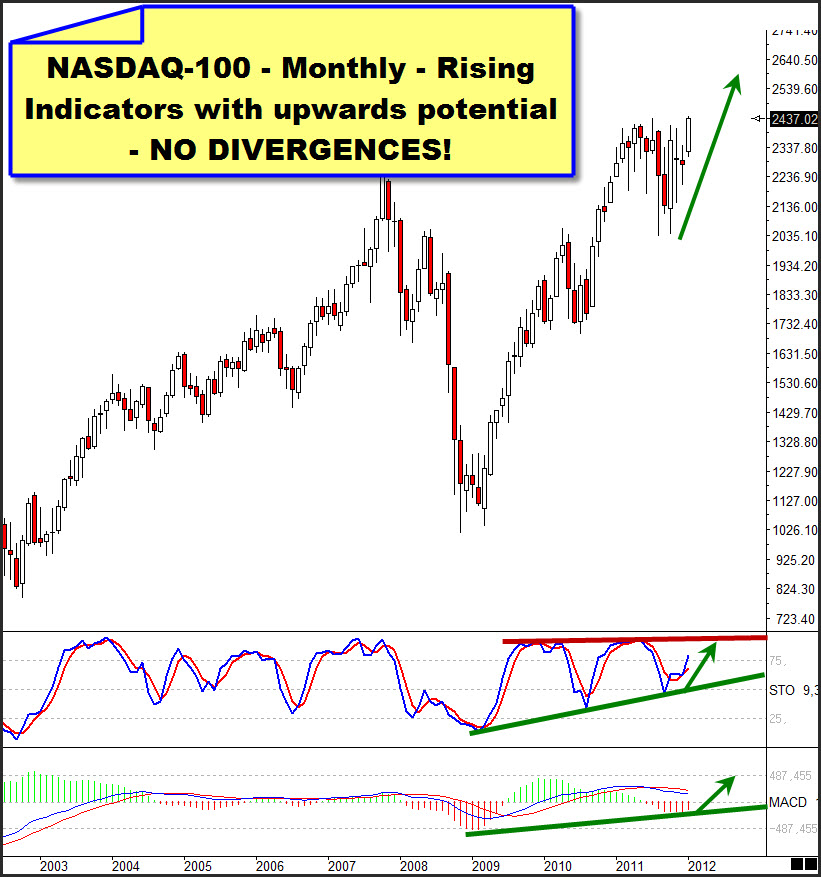
Here’s the monthly chart of the NASDAQ-100. I might have shown the Dow or the S&P 500 as well… To look at Slow Stochastic and MACD is sufficient. Both have got so much space upwards or catch-up potential respectively, so you don’t have to be a chartist to recognize that the short speculations can only last a short time being involved a considerable risk.
As the medium term is definitely clarified now we’ll go into a possible top on daily or weekly basis. I’m going to hop a little bit between NASDAQ-100 and S&P 500, but that contributes to understanding and it’s important for giving the signals.
I think that in the NASDAQ-100 and in the S&P 500 some tops might be marked next week. But we mustn’t go short immediately because perhaps it will be going up for 3-4 more weeks.
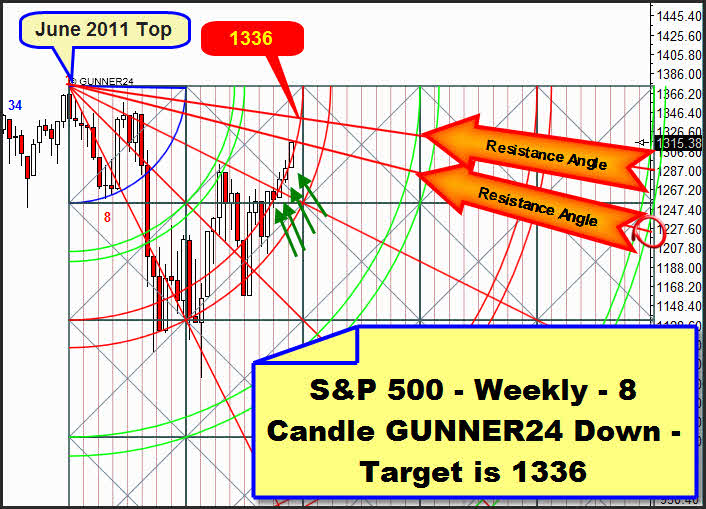
The reason for the possible further rise during 3-4 weeks is given by the clearly identifiable 2nd double arc in the weekly 8 Candle GUNNER24 Down Setup of the S&P 500. The market has been following the upper line of the 2nd double arc upwards for four weeks – visibly for all of us having reached an important resistance Gann Angle on Friday. So the market might have topped… But since the upper line is visibly forcing the market upwards that really may A) go on for 3 more weeks with a power that B) might be just in the relative beginning of its development. I.e. watch out, bears! Maybe the market has just begun to get going in full swing, the trend might intensify during the coming weeks being the 1336 just an interim target which will have to lead to far more severe ascents breaking even the 2011 top if it is broken upwards!
Officially the medium-term rise won’t be ended before we’ll see a weekly close within the 2nd double arc! A reversal candle on weekly basis could be used for a short entry in that case.
The NASDAQ-100 isn’t supposed to have finished yet, either!
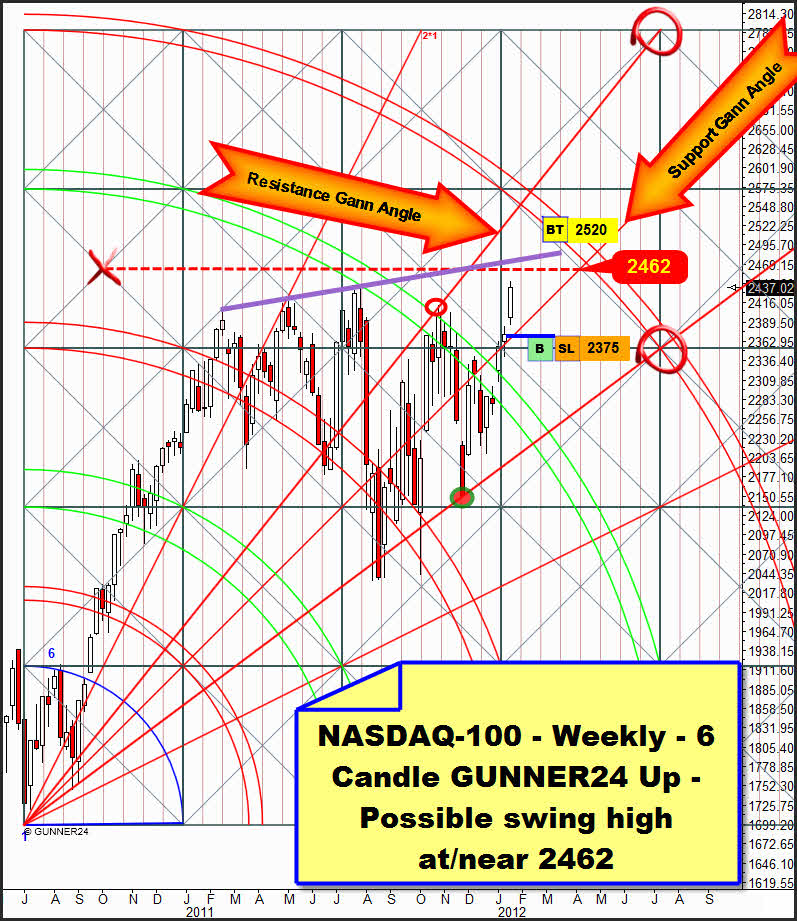
The next visible GUNNER24 Magnet in the weekly setup is lying at 2462. That’s where the center of the just passed square is, where we have always to reckon with a counter reaction. This resistance is is corresponding to the 1336 in the S&P 500. But the acceleration of the current trend is not older than three weeks, so in terms of times that’s very recent; it might go on at least two more weeks. The acceleration began by crossing the 1*1 Gann Angle which is going to provide very strong support now.
Since the price rise (the acceleration) might always reinforce by the end of a trend – the exhaustion we can often see – as well the 2462 as the weekly resistance trend line marked purple in the chart might become rubbish within the next two weeks. Target of this swing are the 2520 anyway. We’ll cover there our longs at 2372 we went in two weeks ago, at any rate. Please pay attention to the new SL!
Well, the 2462 and the 1336 are important resistances where we can expect a top. The weekly setups above demonstrate that, and in the following monthly 3 Candle GUNNER24 Up Setup there’s an extremely important magnet at 1334 that will have to be headed for before the market makes the decision there whether it wants to rebound from it or has to go on rising.
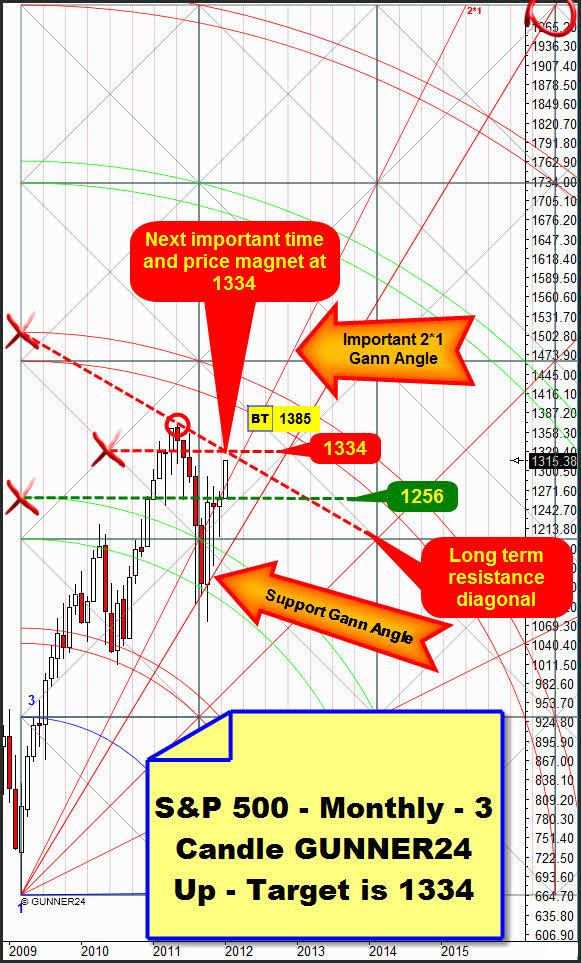
The center of the just passed square is at 1334, and that is where the most powerful resistance diagonal intersects which caused the 2011 top already. So, on daily, weekly and monthly basis we’ll have to expect a reaction to this magnet. That won’t have to be a rebound necessarily.
In Gann trading a reaction means A) the end of the trend but also B) an acceleration of the trend. Since we know from the weekly setup that the trend may easily go on for three weeks a January close above 1334 is thoroughly possible. The monthly support and resistance marks are the most important ones, and they use to cause very severe reactions.
So watch out bears! At the moment you’re just stunned having the chance that next week the market may turn. However, a January close above 1334 would activate the 1385 through March/April 2012, and in that case you’ll be gutted. We’ll buy a January close above 1340! Furthermore we’ll buy a January close above 12720 in the Dow Jones, on monthly basis as well.
Let’s have a brief look at the gold now.
After the December lows gold rose up to the "best short entry area" we had expected in the very long-term weekly 19 Candle GUNNER24 Up. GUNNER24 Forecasts, issue 12/30/2011:
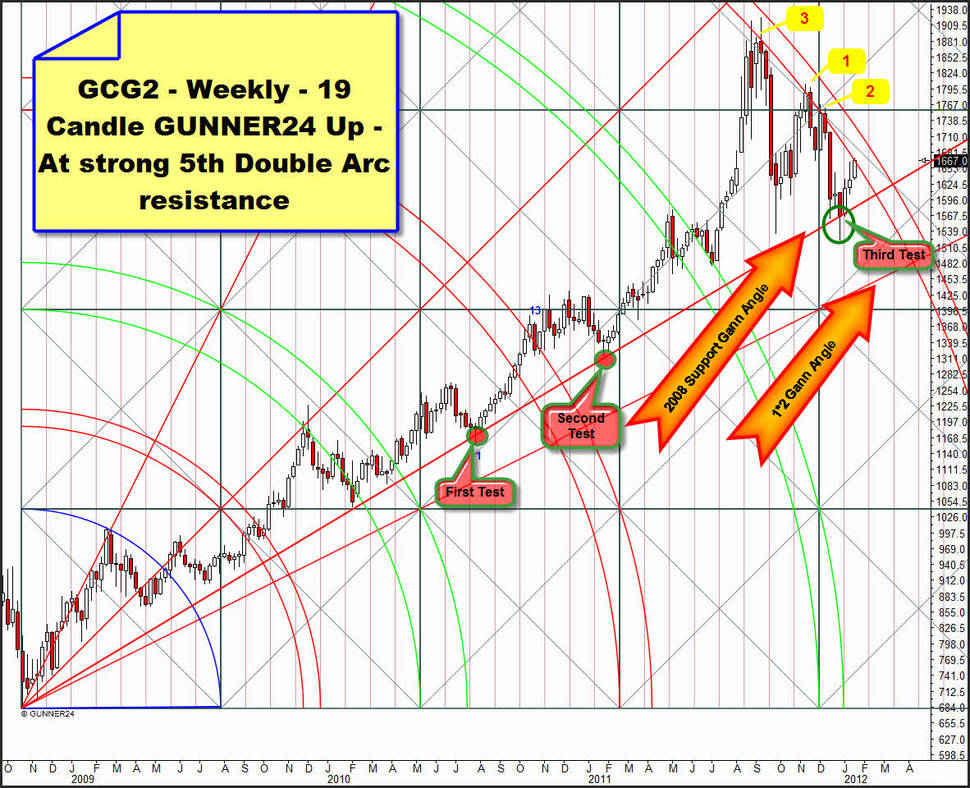
The 2008 support Gann Angle resisted again, and the third rebound from it led back to the long-term resistance of the 5th double arc. Every gold trader knows about the importance of the 1665-1670 area that provided resistance during the whole last week. The reason for that is the lower line of the 5th double arc in the setup above. Since reaching the 5th double arc gold has always rebounded visibly from the lower line of the 5th double arc. Not any close within the 5th succeeded, much less above it.
Technically gold is supposed to overbid the actual 1670.6 high of this swing next week thus meeting the requirements for possible short entry. In that case the market would have produced higher highs for the 5th consecutive week (including the week when the market turned). Next week will open again within the 5th double arc. And immediately after the swing high – perhaps at 1672 – it might turn downwards. That would correspond approximately to the comportment of the market at red 1 and red 2. A reversal candle next week would be the confirmation for the end of the swing, and subsequently in the coming weeks the support Gann Angle is supposed to be targeted for the next test which will be the fourth that is frequently the decisive one.
Another option is that the built-up energy that arose at 1665 on daily basis will first have to discharge and the market will have to copy the silver rise of Friday being obliged to ascent to 1700-1705 before the swing high will be marked. If gold visibly turns down in that case closing below 1665 that would be the short signal. Such a conduct would correspond to red 3 at the all-time high. Also in this scenario the swing is supposed to have come to its end and the 2008 support Gann Angle would be headed for again for the fourth test.
But if the market lasts between 1665 and 1700 next week or even closes above the 5th double arc we will have to assume that another rise will happen that will produce its top in the eighth week of the actual swing. Target in that case would be the next important monthly magnet at 1755.
You best register with our GUNNER24 Gold Trader now. That’s where we oversee the optimal entries and exits for you. Especially in the difficult market situations where many factors have to be considered the Gold Trader is backed by the additional GUNNER24 Signals based on the combined 1, 4 and 8 hour setups to catch the optimum entries and exits.
|

The GUNNER24 Gold Trader will provide you with the critical knowledge you need to forecast and analyse the precious metals with the GUNNER24 Forecasting Method. All the GUNNER24 Trading Signals you receive real-time are based on the actual Gold and Silver Future. The NEW GUNNER24 Gold Trader is a must for every actively working investor and trader who wants to trade successfully in everyday trading. The insights you receive from the head trader Eduard Altmann (and discoverer of the GUNNER24 Forecasting Method) are truly amazing sometimes. I promise!
Click the button below and order the GUNNER24 Gold Trader - $39.90 US a month. For 201 members and up - $49.90 US a month.
 |
Be prepared!
Eduard Altmann