
The US Crude Oil rally should continue to accelerate into 63.00$ GUNNER24 Monthly Uptarget if it succeeds in ending the entire trading year 2017 above 57.60$, because then a very rare double buy signal on yearly base would occur. The oil closed 2017 at 60.51$.
I`ve prepared you for the probable occurence of this mighty trend continuation signal within the December, 17th issue. Then oil quoted at 57.39$ first square line resistance which was a prior activated monthly uptarget resistance and was ready to explode to the upside once 2017 succeeds in closing above 57.60$:
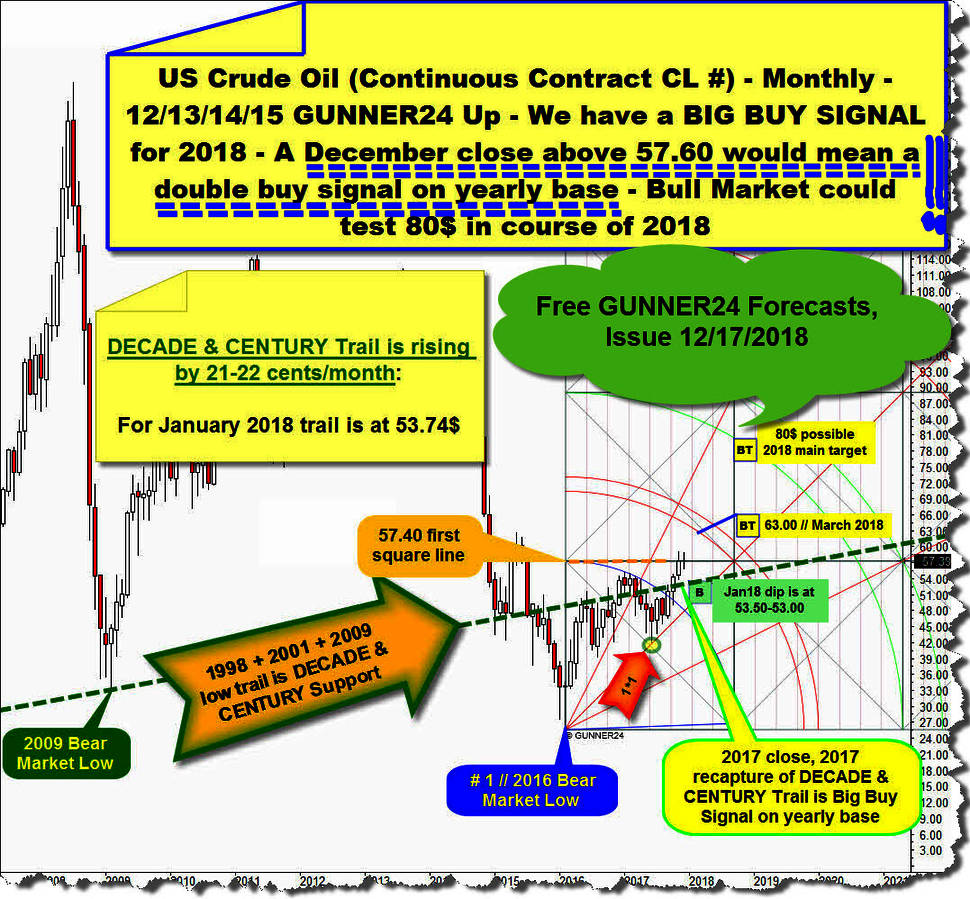
According to the GUNNER24 Trading Rules, a 2017 close far above 57.40$ first square line resistance within 12/13/14/15 Candle GUNNER24 Up Setup means exactly two important things:
First, namely, that the year 2018 should again be an upward trend year. As it was the fact with the 2016 and 2017! And thus the final low of 2018 should be printed near open, and the final high of 2018 should be made near the close of 2018. Thus and attention! it may well be that already the reached low (60.10$) of the very first 2018 trading day is the final low of the entire 2018. Please consider this possibility in the new trade setup described below.
Second, it may now be that the market will deliver a super strong uptrend year 2018 - very similar to 2016, even reaching the 80$ threshold at some point!
Let us now look at how the market has evolved since my last "12-17-2017 Mighty US Crude Oil breakthrough seems to be running - Part 2" analysis:
December 2017 (Dec17) candle opened above the 57.40$ first square line. This bullish auction was a next important signal that market liked to go higher. Dec17 open skipped a price threshold which was important resistance magnet for 2017 and is important magnet for the future. Dec17 closed at 2017 highs, another bullish exclamation mark, suggesting that the upper line of 1st double arc upmagnet should be important uptarget for this bull run!
Because Dec17 as entire 2017 closed above the 57.40$ first square line, this horizontal is now usually very strong future support in the monthly time frame and even has morphed to a horizontal support which dominates in the higher yearly time frame.
Because 57.40$ is overcome on yearly closing base, this magnet is now natural very strong support for entire 2018 and beyond. At or near 57.40$ the final low of 2018 might be printed!, accordingly a 57.40$ test - no matter when he succeeds in course of 2018 - should be bought because he can only lead to a win in the medium term.
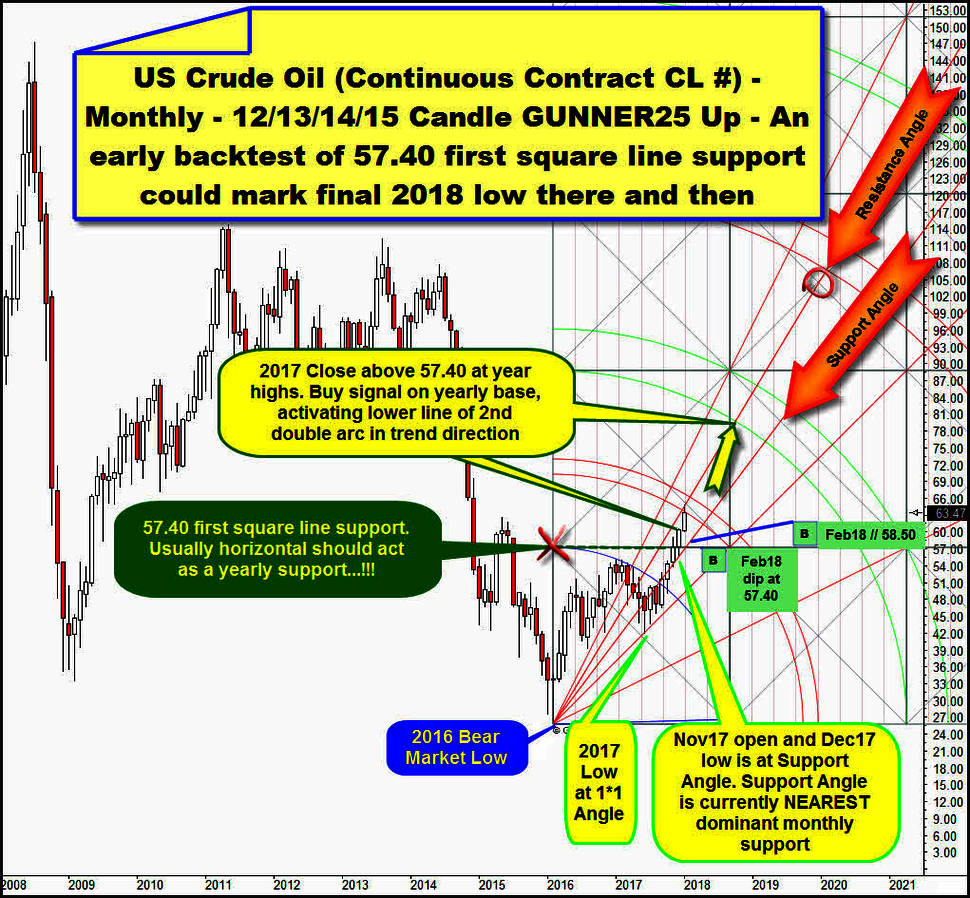
==> Accordingly, and if oils want to test back the 57.40$ in course of February 2018 please buy there and then in any case with mid or long-term uptarget lower line of 2nd double arc = 78$ to 80$ until end of 2018.
==> After the very bullish 2017 close within just 8 trading days previously activated bull market uptarget of lower line of 1st was reached and is now worked off. On Monday 15, current 2018 top was printed at 64.89$ and if you look closely, you realize
A) that 2018 top spiked accurately into natural Resistance Angle out of 2016 Bear Market Low and
B) that crude respects the lower line of 1st double arc as important resistance on monthly base because it ended past week extremely close below the lower line of 1st upmagnet resistance!
==> Lower line of 1st resistance is at 63.50$ for Jan18 candle! 63.50$ is main resistance and monthly resistance for Jan18 candle! This automatically implies that if the oil succeed to close, either Jan18 or Feb18 or March18 ABOVE the 63.50$ arc resistance a next important buy signal in the monthly chart would be fired. With all its subsequent bullish effects...
Oil has met important resistances (Resistance Angle & 1st double arc) at 2018 top environment and in course of past week. Price has found resistance on weekly closing base almost perfectly at the lower line of 1st double arc resistance. The upwards momentum in the daily time frame is now very overbought, the upwards trend was stretched and extreme. There was reasonable divergence between price and some momentum oscillators at 2018 top ==> A trend change is now expected!
I think that the probably already running daily and weekly downtrend will definitely test the Support Angle which is at 58.50$ for Feb18 candle. It would only be too normal if the year 2018 would like to test this important crude bull market magnet very quickly, because his rising, nearest bull market support was most recently touched at Dec17 low and his powerful rebound energy finally led to the buy signal on yearly base.
==> Since the last test of the Support Angle led to a buy signal in the monthly as in the yearly chart, he now also had to offer very strong monthly support and could therefore lead to a significant higher low in the monthly chart on his next test. Thus, it can very well be that the probably already running daily and weekly downtrend ends at the next Support Angle contact!
==> Accordingly, and if oils trades at 58.50$ in course of February 2018, please open there and then a first long position with mid or long-term uptarget lower line of 2nd double arc = 78$ to 80$ until end of 2018.
Be prepared!
Eduard Altmann